. 2021 Feb 5;12(1):841.
doi: 10.1038/s41467-021-21020-x.

Two mechanisms drive pronuclear migration in mouse zygotes

Affiliations

Two mechanisms drive pronuclear migration in mouse zygotes

Kathleen Scheffler et al. Nat Commun. .

Abstract

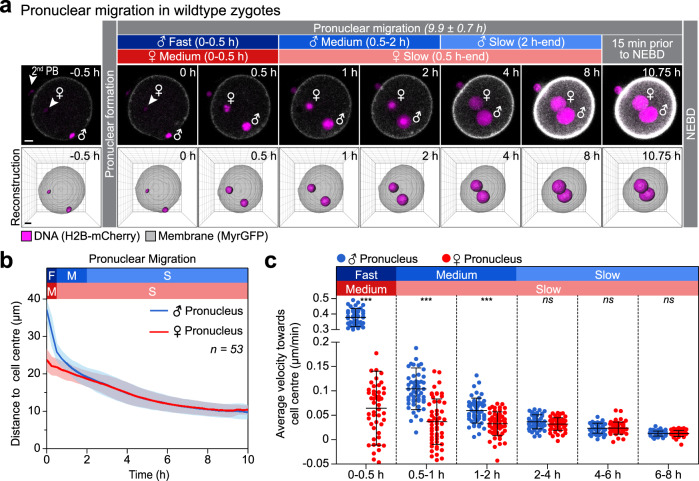
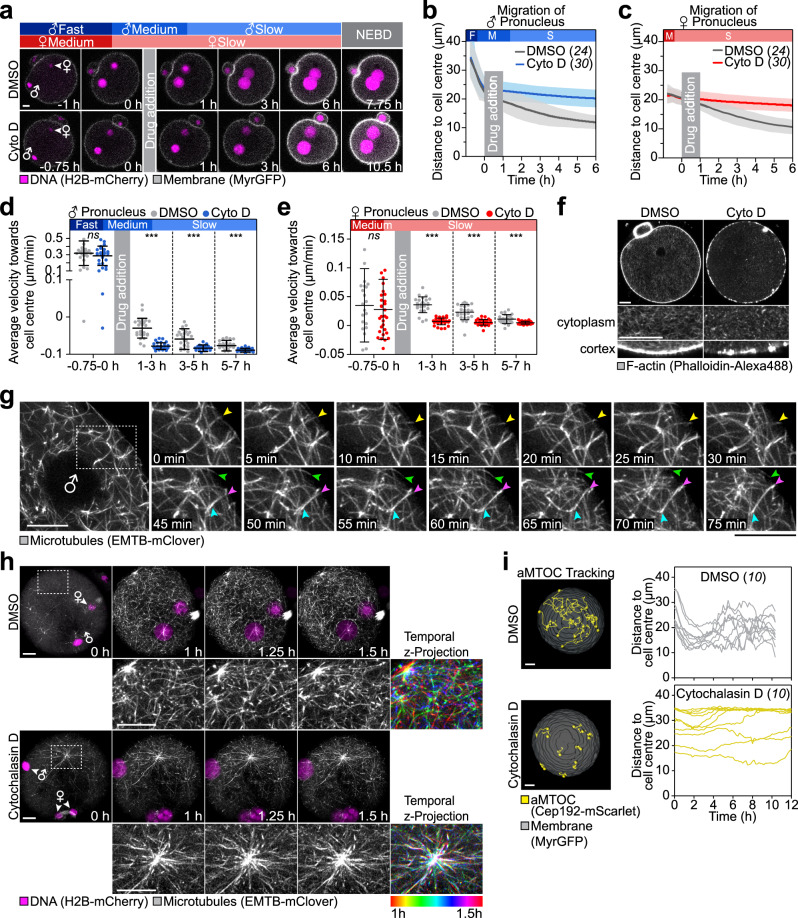
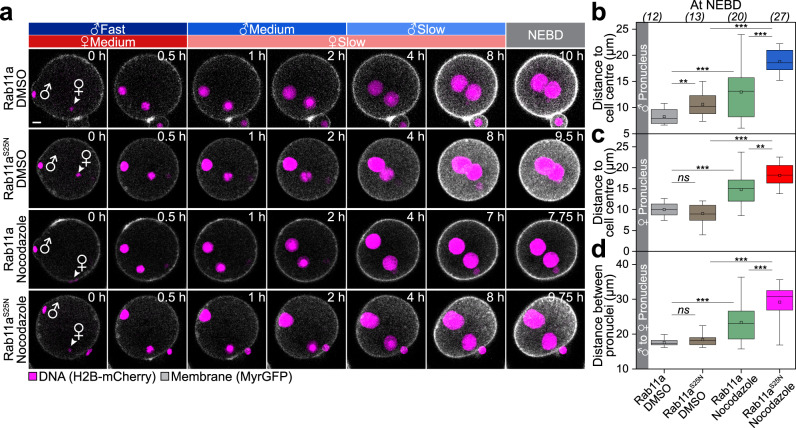
A new life begins with the unification of the maternal and paternal chromosomes upon fertilization. The parental chromosomes first become enclosed in two separate pronuclei near the surface of the fertilized egg. The mechanisms that then move the pronuclei inwards for their unification are only poorly understood in mammals. Here, we report two mechanisms that act in concert to unite the parental genomes in fertilized mouse eggs. The male pronucleus assembles within the fertilization cone and is rapidly moved inwards by the flattening cone. Rab11a recruits the actin nucleation factors Spire and Formin-2 into the fertilization cone, where they locally nucleate actin and further accelerate the pronucleus inwards. In parallel, a dynamic network of microtubules assembles that slowly moves the male and female pronuclei towards the cell centre in a dynein-dependent manner. Both mechanisms are partially redundant and act in concert to unite the parental pronuclei in the zygote's centre.


Conflict of interest statement

The authors declare no competing interests.

Figures

Fig. 1
Fig. 1. Pronuclei migrate by different modes in the periphery and central region of the zygote.
a Three-dimensional time-lapse images (upper panel) and iso-surface reconstruction (lower panel) of pronuclei (H2B-mCherry, z-projection of 28 sections, every 3 µm) and the cell surface (MyrGFP, equatorial section) in live zygotes relative to pronuclear formation (0 h). Female (♀) and male (♂) genomes are labelled; as well as the second polar body (PB), which forms around excess maternal DNA in meiosis II. Distinct phases of migration for male and female pronuclei were defined according to migratory behaviour of male (blue) or female (red) pronuclei (for details see text), which were further characterized by typical speeds within certain ranges as follows: fast (>0.1 µm/min), medium (0.05–0.1 µm/min) and slow (<0.05 µm). Duration of pronuclear migration from pronuclear formation to nuclear envelope breakdown (NEBD) was quantified in Supplementary Fig. 1m. Scale bar, 10 μm. b The mean distance (thick line) of male (♂, blue) and female (♀, red) pronuclei centroids to zygote centre during pronuclear migration was calculated from data sets as shown in (a). Movement speeds are classified as in (a). Total number of analyzed zygotes specified in italics was pooled from five independent experiments. S.d. shown as shaded areas. c Statistical plots of average velocities of male (♂, blue) and female (♀, red) pronuclei during pronuclear migration calculated from data sets shown in (b) with the sample size as in (b). Statistical plots show mean (horizontal middle lines), and standard deviation (whiskers). Two-tailed Student’s t test was used to test for significance (from left to right: p < 0.0001, p < 0.0001, p < 0.0001, p = 0.09, p = 0.9 and p = 0.9).
Fig. 2
Fig. 2. Female pronuclei have a pronounced fast migration phase when forced to form close to the cell surface.
a Three-dimensional time-lapse images of pronuclei (H2B-mCherry) and the cell surface (MyrGFP) relative to pronuclear formation (0 h) in zygotes treated with DMSO or 1 µM nocodazole. Female (♀) and male (♂) genomes are labelled; as well as the second polar body (PB). Scale bar, 10 μm. b Distance of female pronuclei formation site from the cell centre relative to pronuclear formation (0 h) in DMSO- and nocodazole-treated zygotes calculated from data sets as shown in (a). All individual values (circles) are overlaid with a box plot showing median (line), mean (small square), 5th, 95th (whiskers) and 25th and 75th percentile (boxes enclosing 50% of the data) calculated from the total number of zygotes (italics) and pooled from four independent experiments. Two-tailed Student’s t test was used to test for significance (p < 0.0001). c The mean distance (thick line) of female (♀) pronuclei centroids to zygote centre relative to pronuclear formation (0 h) in DMSO- and nocodazole-treated zygotes was calculated from (a). Phases of respective movement speeds are classified as in Fig. 1a. Total number of analyzed zygotes (italics) was pooled from four independent experiments. S.d. shown as shaded areas. d Statistical plots of average velocities of female (♀) pronuclei during pronuclear migration in DMSO- or nocodazole-treated zygotes calculated from (c) with the same sample size as in (c). Statistical plots as in Fig. 1c. Two-tailed Student’s t test was used to test for significance (from left to right: p < 0.0001, p < 0.0001 and p = 0.3).
Fig. 3
Fig. 3. Rab11a is required for pronuclear migration in the periphery of the zygote.
a Three-dimensional time-lapse images of pronuclei (H2B-mCherry) and the cell surface (MyrGFP) in zygotes expressing SNAP-Rab11a or SNAP-Rab11aS25N until nuclear envelope breakdown (NEBD). Female (♀) and male (♂) genomes are shown at pronuclear formation (0 h). Phases with respective pronuclear movement speeds are classified as in Fig. 1a. Scale bar, 10 μm. The mean distance (thick line) of male (♂, (b)) and female (♀, (c)) pronuclei centroids to zygote centre during pronuclear migration in zygotes expressing SNAP-Rab11a or SNAP-Rab11aS25N was calculated from data sets as shown in (a). Total number of analyzed zygotes specified in italics was pooled from six independent experiments. S.d. shown as shaded areas. Statistical plots of average velocities of male (♂, (d)) and female (♀, (e)) pronuclei during pronuclear migration in zygotes expressing SNAP-Rab11a or SNAP-Rab11aS25N calculated from (b) and (c) with the same sample size as in (b) and (c), respectively. Statistical plots show mean ± s.d. Two-tailed Student’s t test was used to test for significance (from left to right: d p < 0.0001, p = 0.7, p = 0.08, p = 0.4, p < 0.0001 and p = 0.06; e p < 0.0001, p = 0.5, p = 0.8, p = 0.2, p = 0.02 and p = 0.5). We noticed that dominant-negative Rab11a strongly but not completely abolished the fast migration phase of male pronuclei (d). Detailed analysis of these early processes suggests that male pronuclei maintain contact to the plasma membrane for twice as long in dominant-negative Rab11aS25N expressing zygotes (Supplementary Fig. 4j, l). Rapid nuclear expansion during this time-period (Supplementary Fig. S1k) together with a mildly delayed flattening of the cone (Supplementary Fig. 4k) may explain why fast migration may not be fully blocked upon inhibition of Rab11a. Furthermore, we noticed that pronuclei are slightly accelerated in Rab11a-overexpressing zygotes, which means that they move mildly faster over a longer period of time (Fig. S12p, q). f Distance of pronuclei centroids to zygote centre at NEBD in zygotes expressing SNAP-Rab11a or SNAP-Rab11aS25N calculated from data sets in (a). Box plot showing median (line), mean (small square), 5th, 95th (whiskers) and 25th and 75th percentile (box) was calculated from the total number of analyzed zygotes specified in italics. Two-tailed Student’s t test was used to test for significance (male p < 0.0001 and female p = 0.03).
Fig. 4
Fig. 4. Rab11a, Spire, Formin-2 and actin accumulate in the fertilization cone.
a Three-dimensional time-lapse images of mScarlet-Rab11a and male pronucleus (♂, H2B-EGFP) relative to pronuclear formation (0 min) in live zygotes (z-projection of seven sections, every 1.5 µm). The region outlined in the overview is magnified in the bottom panel. b Three-dimensional time-lapse images of mClover3-Spire2 and male pronucleus (♂) relative to pronuclear formation (0 min) in live zygotes (z-projection of 20 sections, every 1.5 µm). Below, schematic depicting the stages of the fast migration phase of pronuclei from time point of pronuclear formation until pronucleus is launched off the cell surface. c Three-dimensional time-lapse images of mClover3-Spire2, Formin-2-EGFP and male pronucleus (♂) relative to pronuclear formation (0 min) in live zygotes (top, z-projection of 20 sections, every 1.5 µm or bottom, single planes of middle slices of male pronucleus). d Three-dimensional time-lapse images of mClover3-Spire2 and male pronucleus (♂) in live zygotes expressing SNAP-Rab11a or SNAP-Rab11aS25N. e Histogram showing percentage of SNAP-Rab11a- or SNAP-Rab11S25N-expressing zygotes with cortical mClover3-Spire2 enrichment quantified from (d). Data are mean ± s.d. from three independent experiments. The total number of analyzed zygotes is specified in italics. Two-tailed Student’s t test was used to test for significance (p = 0.0007). f Super-resolution (airyscan) time-lapse images of F-actin (single section) displayed in grayscale (top) and fluorescence intensity map (bottom, pseudocolour, 12-Bit grayscale) in live zygotes in proximity of the forming male pronucleus (♂). Corresponding look-up table is shown as a colour scale bar ranging from intensity levels 1 (low) to 4096 (high). Time point 0 min marks the start of acquisition. Yellow arrowheads mark increased F-actin levels between cell cortex and male pronucleus. Scale bars, 10 μm.
Fig. 5
Fig. 5. Spire-dependent local actin nucleation drives pronuclear migration in the periphery of the zygote.
a Super-resolution (airyscan) time-lapse images of mScarlet-Spire2 (white) and F-actin (EGFP-UtrCH, pseudocolour, 12-Bit grayscale) in live zygotes in proximity of the forming male pronucleus displayed as single plane. Time point 0 marks the start of acquisition. Corresponding look-up table is shown as a colour scale ranging from intensity levels 1 (low) to 4096 (high). b Three-dimensional time-lapse images of pronuclei and the cell surface relative to pronuclear formation (0 h) in zygotes overexpressing SNAP (control) or SNAP-Spire2. Female (♀) and male (♂) genomes are shown. Phases with respective movement speeds are classified as in Fig. 1a. c The mean distance (thick line) of male pronuclei centroids to zygote centre during pronuclear migration in zygotes overexpressing SNAP or SNAP-Spire2 was calculated from (b). The total number of analyzed zygotes specified in italics was pooled from three independent experiments. S.d. shown as shaded areas. d Statistical plots of average velocities of male pronuclei during pronuclear migration in zygotes overexpressing SNAP (control) or SNAP-Spire2 calculated from (c) with the same sample size as in (c). Statistical plot shows mean ± s.d. Two-tailed Student’s t test was used to test for significance (from left to right: p = 0.7, p = 0.003, p = 0.001 and p = 0.2). e Laser ablation of live zygotes behind or in front of the male pronucleus (PN) during fast migration phase; yellow boxes indicate region of laser ablation. Single section time-lapse images of pronuclei (SiR-DNA) and the cell surface (CellMask Green) in live zygotes relative to time point of laser ablation (0 min) are presented. Images were acquired at 20-s intervals before and after laser ablation. f Box plot of velocities showing median (line), mean (small square), 5th, 95th (whiskers) and 25th and 75th percentile (box) with individual values (circles) calculated from Supplementary Fig. 5f as an average velocity of the 80 s time window before and after ablation from the total number of zygotes (italics) pooled from four independent experiments. Migration towards cell centre (>0) and towards cell surface (<0). Two-tailed Student’s t test was used to test for significance (from top to bottom: p = 0.2, p = 0.04, p = 0.06 and p = 0.3). g Box plot of velocity change after laser ablation showing median (line), mean (small square), 5th, 95th (whiskers) and 25th and 75th percentile (box) with individual values (circles) calculated from (f) with the same sample size as (f). Absolute velocities were calculated through subtraction of velocities before ablation from velocities after ablation. Increase (>0) or decrease (<0) of velocity after laser ablation. Two-tailed Student’s t test was used to test for significance (p = 0.03).
Fig. 6
Fig. 6. The fast migration mode requires actin nucleation in the periphery of the zygote.
a Three-dimensional time-lapse images of pronuclei and the cell surface relative to pronuclear formation (0 h) in zygotes injected with 3 μM MBP (control) or FH2 until nuclear envelope breakdown (NEBD). Female (♀) and male (♂) genomes are shown. Phases with respective movement speeds are classified as in Fig. 1a. The mean distance (thick line) of male (b) and female (c) pronuclei centroids to zygote centre during pronuclear migration in zygotes injected with MBP or FH2 was calculated from (a). The total number of analyzed zygotes specified in italics was pooled from three independent experiments. S.d. shown as shaded areas. Statistical plots of average velocities of male (d) and female (e) pronuclei during pronuclear migration in zygotes injected with MBP or FH2 calculated from (b) and (c) with the same sample sizes as in (b) and (c), respectively. Statistical plots show mean ± s.d. Two-tailed Student’s t test was used to test for significance (from left to right: d p < 0.0001, p = 0.5, p = 0.4, p < 0.0001, p < 0.0001 and p = 0.0003; e p = 0.01, p < 0.0001, p = 0.01, p = 0.5, p < 0.0001 and p < 0.0001). f Distance of pronuclei centroids to zygote centre at NEBD for zygotes injected with MBP or FH2 calculated from data sets in (a). Box plot showing median (line), mean (small square), 5th, 95th (whiskers) and 25th and 75th percentile (box). Two-tailed Student’s t test was used to test for significance (male p = 0.4 and female p = 0.5). g Three-dimensional time-lapse images of with cortical mClover-Spire2 and female pronuclei in DMSO- or nocodazole-treated zygotes relative to pronuclear formation (0 min) in live zygotes (z-projection of 20 sections, every 1.5 µm). Second polar bodies (PB) are labelled. h Super-resolution (airyscan) time-lapse images of mScarlet-Spire2 (white) and F-actin (EGFP-UtrCH, pseudocolour, 12-Bit grayscale) in live zygotes treated with DMSO or nocodazole in proximity of the forming female pronucleus displayed as single plane. Time point 0 marks the start of acquisition. Corresponding look-up table is shown as a colour scale bar ranging from intensity levels 1 (low) to 4096 (high). The brighter beans radiating from the cytokinetic furrow (white arrow) of the second polar body extrusion in DMSO-treated zygotes are actin filaments located in the spindle remnant (yellow arrow) and appear distinct from the places that emerge below the cell surface in nocodazole-treated zygotes. Scale bars, 10 µm.
Fig. 7
Fig. 7. Microtubule- and dynein-dependent transport drives pronuclear migration throughout the centre.
a 3D super-resolution (airyscan) time-lapse images of microtubules (EMTB-mClover) and pronuclei relative to pronuclear formation (0 h) in live zygotes (z-projection of 5 (EMTB) or 11 (H2B) sections, every 4 µm). Female (♀) and male (♂) genomes are labelled. Phases of respective movement speeds are classified as in Fig. 1a. Magnified region outlined in the overview presented as single section. Cell centre directed aster movement (yellow arrowheads). b 3D time-lapse images of pronuclei and the cell surface relative to pronuclear formation (0 h) in zygotes treated with DMSO or 10 µM nocodazole. Yellow arrowheads highlight gap between pronuclei at nuclear envelope breakdown (NEBD). The mean distance (thick line) of male (c) and female (d) pronuclei centroids to zygote centre in DMSO- or nocodazole-treated zygotes was calculated from (b). The total number of analyzed zygotes (italics) was pooled from four independent experiments. S.d. shown as shaded areas. Statistical plots of average velocities of male (e) and female (f) pronuclei in DMSO- or nocodazole-treated zygotes calculated from (c) and (d) with the same sample sizes as in (c) and (d), respectively. Statistical plots show mean ± s.d. Two-tailed Student’s t test was used to test for significance (from left to right: e p = 0.04, p = 0.005, p = 0.0004, p < 0.0001, p < 0.0001 and p = 0.7; f p < 0.0001, p = 0.003, p = 0.002, p = 0.001, p < 0.0001 and p = 0.8). g Distance of pronuclei centroids to zygote centre at NEBD in DMSO- or nocodazole-treated zygotes. Box plot showing median (line), mean (small square), 5th, 95th (whiskers) and 25th and 75th percentile (box). Two-tailed Student’s t test was used to test for significance (male p < 0.0001 and female p < 0.0001). h Three-dimensional time-lapse images of pronuclei and the cell surface in zygotes microinjected with 30 µM MBP (control) or p150-CC1. Labels as (b). The mean distance of male (i) and female (j) pronuclei centroids to zygote centre in zygotes microinjected with MBP or p150-CC1 was calculated from (h) from total number of analyzed zygotes (italics) pooled from four independent experiments. S.d. shown as shaded areas. Statistical plots of average velocities of male (k) and female (l) pronuclei during pronuclear migration in zygotes microinjected with MBP or p150-CC1 calculated from (i) and (j) with the same sample size as in (i) and (j), respectively. Statistical plots show mean ± s.d. Two-tailed Student’s t test was used to test for significance (from left to right: k p = 0.02, p = 0.007, p = 0.3, p < 0.0001, p = 0.0002 and p = 0.4; l p = 0.4, p = 0.3, p = 0.5, p < 0.0001, p = 0.0001 and p = 0.06). m Distance of pronuclei centroids to zygote centre at NEBD in zygotes microinjected with MBP (control) or p150-CC1 calculated from (h). Box plot showing median (line), mean (small square), 5th, 95th (whiskers) and 25th and 75th percentile (box). Two-tailed Student’s t test was used to test for significance (male p < 0.0001 and female p < 0.0001). Scale bars, 10 μm.
Fig. 8
Fig. 8. Inwards-directed microtubule-based transport requires actin.
a 3D time-lapse images of pronuclei and the cell surface in zygotes acutely treated with DMSO or 5 µg/ml cytochalasin D in slow migration phase relative to time point of drug addition (0 h). Female (♀) and male (♂) genomes are shown at pronuclear formation until nuclear envelope breakdown (NEBD). Phases of respective movement speeds are classified as in Fig. 1a. The mean distance (thick line) of male (b) and female (c) pronuclei centroids to zygote centre during pronuclear migration in zygotes acutely treated with DMSO or cytochalasin D from (a). Total number of analyzed zygotes (italics) was pooled from three independent experiments. S.d. shown as shaded areas. Statistical plots of average velocities of male (d) and female (e) pronuclei during pronuclear migration in zygotes acutely treated with DMSO or cytochalasin D calculated from (b) and (c) with the same sample size as in (b) and (c), respectively. Statistical plots show mean ± s.d. Two-tailed Student’s t test was used to test for significance (from left to right: d p = 0.4, p < 0.0001, p = 0.0003 and p = 0.0004; e p = 0.7, p < 0.0001, p < 0.0001 and p = 0.0009). f Super-resolution (airyscan) images of zygotes treated with DMSO or cytochalasin D, fixed 5 hpi and stained for F-actin with Phalloidin-Alexa488. Magnified regions of the cytoplasmic actin network and the actin cortex are shown. g Super-resolution (airyscan) time-lapse images of microtubules (EMTB-mClover3, z-projection of three sections, every 1.5 µm) in live zygotes. The magnified region presented as time-lapse starting ~5.5 hpi (0 min). Arrowheads highlight microtubules encountering the cell cortex resulting in displacement away from cortex (pink, blue) or buckling (yellow, green). h 3D super-resolution (airyscan) time-lapse images of microtubules and pronuclei relative to pronuclear formation (0 h) in live zygotes treated with DMSO or cytochalasin D (z-projection as Fig. 7a). Three time points from 1 to 1.5 h (15-min intervals) were superimposed using ImageJ’s Temporal-Colour Coder and represented in pseudocolour with the corresponding look-up table shown as a colour scale bar from time points 1 to 1.5 h. i Right, 3D tracking of aMTOCs (Cep192-mScarlet) in zygotes relative to pronuclear formation (0 h) in zygotes treated with DMSO or cytochalasin D. Left, graphs display tracks of acentriolar microtubule-organizing centres (aMTOCs) in respect to cell centre. The total number of analyzed aMTOCs is specified in italics each from one representative cell per condition. Scale bars, 10 μm.
Fig. 9
Fig. 9. Local actin nucleation by Spire and Formin-2 and microtubule-based transport drive pronuclear migration in a partially redundant manner.
a Three-dimensional time-lapse images of pronuclei and the cell surface relative to pronuclear formation (0 h) in zygotes expressing SNAP-Rab11a or SNAP-Rab11aS25N and treated with DMSO or 10 µM nocodazole, respectively. Female (♀) and male (♂) genomes are shown at pronuclear formation until nuclear envelope breakdown (NEBD). Phases of respective movement speeds are classified as in Fig. 1a. In 10/27 (37%) of Rab11aS25N nocodazole zygotes, we observed that cells adopted a severely squeezed shape during pronuclear migration pushing pronuclei located beneath the cell surface closer to cell centre, which may account for some movement of pronuclei indirectly to cell centre. Distance of male (b) and female (c) pronuclei centroids to zygote centre at NEBD in zygotes expressing SNAP-Rab11a or SNAP-Rab11aS25N and treated with DMSO or 10 µM nocodazole, respectively, calculated from (a). Total number of analyzed zygotes (italics) was pooled from three independent experiments. Box plot showing median (line), mean (small square), 5th, 95th (whiskers) and 25th and 75th percentile (box). Two-tailed Student’s t test was used to test for significance (from top to bottom: b p < 0.0001, p < 0.0001, p = 0.0006 and p = 0.005; c p < 0.0001, p = 0.001, p < 0.0001 and p = 0.2). d Distance between male and female pronuclei centroids at NEBD in zygotes expressing SNAP-Rab11a or SNAP-Rab11aS25N and treated with DMSO or 10 µM nocodazole, respectively, calculated from (a). Box plot showing median (line), mean (small square), 5th, 95th (whiskers) and 25th and 75th percentile (box). Two-tailed Student’s t test was used to test for significance (from top to bottom: p < 0.0001, p = 0.0008, p = 0.0002 and p = 0.2). Scale bars, 10 μm.
Fig. 10
Fig. 10. Model for pronuclear migration in mouse zygotes.
Pronuclear migration is initiated by the flattening of the cone, which moves the male pronucleus inwards. During this stage, actin nucleation factors Formin-2/Spire concentrate as a ring structure at the edge of the shrinking fertilization cone. Next, actin nucleation by the Formin-2/Spire, which are targeted to the fertilization cone by Rab11a-positive vesicles, launches the pronuclei away from the cell surface. Female pronuclei typically assemble further away from the cell surface due to the metaphase II spindle remnant (green microtubule clusters) and their fast migration phase is less pronounced. In the slow migration phase (small arrowheads) microtubules and dynein drive the inwards-directed movement of the two pronuclei. Both mechanisms cooperate in a partially redundant manner to centre the two pronuclei.

References

    1. Clift D, Schuh M. Restarting life: fertilization and the transition from meiosis to mitosis. Nat. Rev. Mol. Cell Biol. 2013;14:549–562. doi: 10.1038/nrm3643. - DOI - PMC - PubMed
    1. Bianchi E, Wright GJ. Sperm meets egg: the genetics of mammalian fertilization. Annu. Rev. Genet. 2016;50:93–111. doi: 10.1146/annurev-genet-121415-121834. - DOI - PubMed
    1. Trebichalska Z, Holubcova Z. Perfect date-the review of current research into molecular bases of mammalian fertilization. J. Assist. Reprod. Genet. 2020;37:243–256. doi: 10.1007/s10815-019-01679-4. - DOI - PMC - PubMed
    1. Reichmann J, et al. Dual-spindle formation in zygotes keeps parental genomes apart in early mammalian embryos. Science. 2018;361:189–193. doi: 10.1126/science.aar7462. - DOI - PubMed
    1. Chaigne A, et al. F-actin mechanics control spindle centring in the mouse zygote. Nat. Commun. 2016;7:10253. doi: 10.1038/ncomms10253. - DOI - PMC - PubMed

Publication types

MeSH terms