Clinical Trial
. 2021 Feb 5;12(1):814.
doi: 10.1038/s41467-021-21085-8.

Efficacy and tolerability of bevacizumab in patients with severe Covid-19

Affiliations
Clinical Trial

Efficacy and tolerability of bevacizumab in patients with severe Covid-19

Jiaojiao Pang et al. Nat Commun. .

Abstract

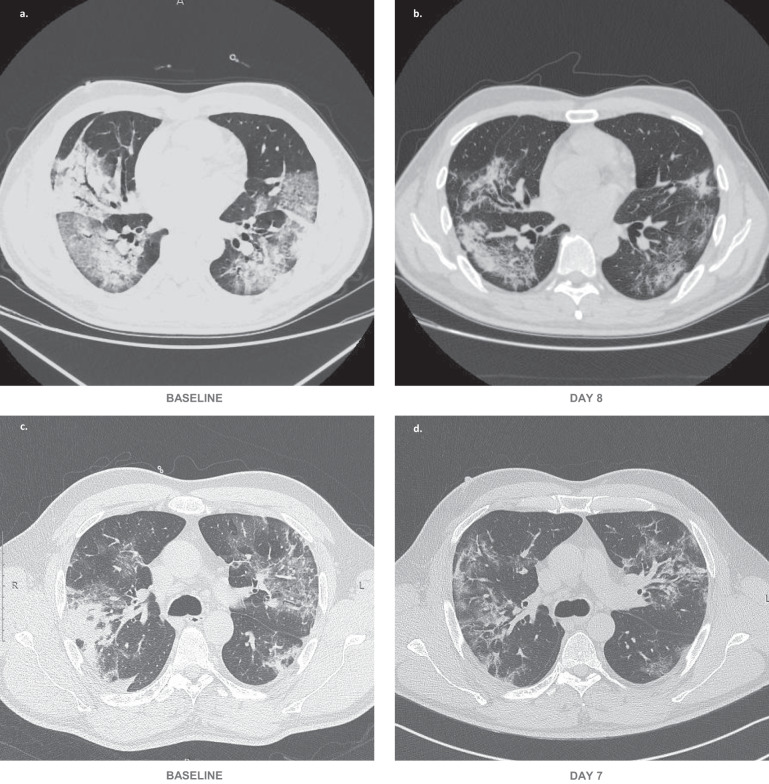
On the basis of Covid-19-induced pulmonary pathological and vascular changes, we hypothesize that the anti-vascular endothelial growth factor (VEGF) drug bevacizumab might be beneficial for treating Covid-19 patients. From Feb 15 to April 5, 2020, we conducted a single-arm trial (NCT04275414) and recruited 26 patients from 2-centers (China and Italy) with severe Covid-19, with respiratory rate ≥30 times/min, oxygen saturation ≤93% with ambient air, or partial arterial oxygen pressure to fraction of inspiration O2 ratio (PaO2/FiO2) >100 mmHg and ≤300 mmHg, and diffuse pneumonia confirmed by chest imaging. Followed up for 28 days. Among these, bevacizumab plus standard care markedly improves the PaO2/FiO2 ratios at days 1 and 7. By day 28, 24 (92%) patients show improvement in oxygen-support status, 17 (65%) patients are discharged, and none show worsen oxygen-support status nor die. Significant reduction of lesion areas/ratios are shown in chest computed tomography (CT) or X-ray within 7 days. Of 14 patients with fever, body temperature normalizes within 72 h in 13 (93%) patients. Relative to comparable controls, bevacizumab shows clinical efficacy by improving oxygenation and shortening oxygen-support duration. Our findings suggest bevacizumab plus standard care is highly beneficial for patients with severe Covid-19. Randomized controlled trial is warranted.


Conflict of interest statement

The authors declare no competing interests.

Figures

Fig. 1
Fig. 1. CONSORT flow diagram.
Twenty-seven participants were enrolled. All participants received bevacizumab treatment (BEVA). One participant dropped out.
Fig. 2
Fig. 2. Comparison of dynamic changes of PaO2/FiO2 between BEVA (bevacizumab) and control groups.
PaO2/FiO2 values in all patients (a), Chinese (b), and Italian (c) groups. The dashed lines represent the baselines; nodes in the lines represent the median values; the lower and upper values of the bar correspond to the 25th and 75th percentiles (Q1 and Q3); the length of the bar represents the interquartile range (IQR); red and blue numbers correspond to the sample sizes (n); numbers on the horizontal lines represent p-values. D-values (the difference values between days 1 or 7 and baseline) of individual patients were utilized for the comparisons between BEVA and control groups of all patients (d), Chinese (e), and Italian (f) patients. The center lines of boxes represent median values; the lower and upper hinges represent Q1 and Q3, the range between which represents IQR; whiskers correspond to the highest or lowest values of non-outlier data (within 1.5 × IQR from the lower or upper hinges); numbers on the horizontal lines represent p-values; red and blue numbers correspond to the sample sizes (n); the red and blue dots represent the data of individual patients. For ac, p-values were calculated by Wilcoxon matched-pairs signed-rank test. For df, p-values were calculated by Wilcoxon signed-rank test. PaO2/FiO2 partial arterial oxygen pressure to fraction of inspiration O2 ratio. p < 0.05 for two-tailed hypothesis tests was considered statistically significant. Source data are provided as a Source Data file.
Fig. 3
Fig. 3. Changes in oxygen-support status in individual patients.
Baseline (day 0) is the day when treatment with a single dose of bevacizumab was performed. The final oxygen-support statuses are on the discharge date or at the end of the 28-day follow-up. For each individual patient, colored columns represent the oxygen-support status of the patient over time. Diamond symbols represent patients discharged from hospitals; star symbols represent patients improved but not discharged, and circle symbols show patients unchanged.
Fig. 4
Fig. 4. Representative chest CT images.
Typical chest CT images of a Chinese patient with severe Covid-19 who received bevacizumab at day 8 (b) relative to the prior treatment baseline (a). Typical chest CT images of an Italian patient with severe Covid-19 who received bevacizumab at day 7 (d) relative to the prior treatment baseline (c).
Fig. 5
Fig. 5. Representative chest X-ray images.
Chest X-ray images of an Italian patient with severe Covid-19 who received bevacizumab treatment at days 0 (a), 3 (b), and 7 (c) relative to the prior treatment baseline.
Fig. 6
Fig. 6. Changes in fever symptom, lymphocyte counts, and inflammation markers of individual patients.
Dynamic changes in fever status of 14 BEVA (bevacizumab)-treated patients who had a fever at enrollment (a). Day 0 marks the time point for initiating bevacizumab treatment; red, orange, and blue columns indicate the duration of fever or normal body temperature status before and after BEVA treatment; and diamonds represent discharge. Numbers along the vertical axis represent the patient numbers that match Fig. 2. Changes of lymphocyte counts (n = 14) (b) and C-reactive protein (CRP) levels (n = 9) (c) before and after BEVA treatment were analyzed by the Wilcoxon signed-rank test. The center lines of boxes represent median values; the lower and upper hinges represent the 25th and 75th percentiles (Q1 and Q3), the range between which represents the interquartile range (IQR); whiskers correspond to the highest or lowest values of non-outlier data (within 1.5 × IQR from the lower or upper hinges); numbers on the horizontal lines represent p-values. The red dots represent the data of individual treated patients. p < 0.05 for two-tailed hypothesis tests was considered statistically significant. Source data are provided as a Source Data file.

References

    1. World Health Organization. Coronavirus disease (Covid-19) outbreak. https://www.who.int (2020).
    1. Wu Z, McGoogan JM. Characteristics of and important lessons from the coronavirus disease 2019 (Covid-19) outbreak in china: summary of a report of 72314 cases from the Chinese center for disease control and prevention. JAMA. 2020;323:1239–1242. doi: 10.1001/jama.2020.2648. - DOI - PubMed
    1. Yang X, et al. Clinical course and outcomes of critically ill patients with SARS-CoV-2 pneumonia in Wuhan, China: a single-centered, retrospective, observational study. Lancet Respir. Med. 2020;8:475–481. doi: 10.1016/S2213-2600(20)30079-5. - DOI - PMC - PubMed
    1. Bhatraju PK, et al. Covid-19 in critically ill patients in the Seattle region - case series. N. Engl. J. Med. 2020;382:2012–2022. doi: 10.1056/NEJMoa2004500. - DOI - PMC - PubMed
    1. Huang C, et al. Clinical features of patients infected with 2019 novel coronavirus in Wuhan, China. Lancet. 2020;395:497–506. doi: 10.1016/S0140-6736(20)30183-5. - DOI - PMC - PubMed

Publication types