. 2021 Feb 5;12(1):832.
doi: 10.1038/s41467-021-21099-2.

Galectin-9 interacts with PD-1 and TIM-3 to regulate T cell death and is a target for cancer immunotherapy

Affiliations

Galectin-9 interacts with PD-1 and TIM-3 to regulate T cell death and is a target for cancer immunotherapy

Riyao Yang et al. Nat Commun. .

Abstract

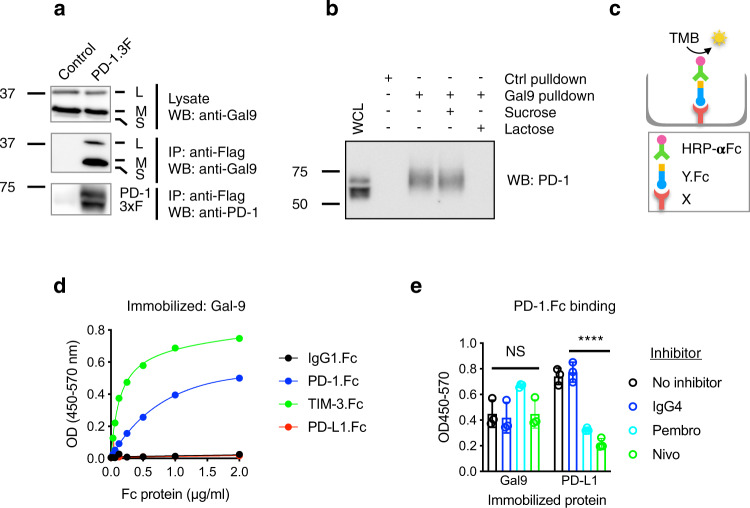
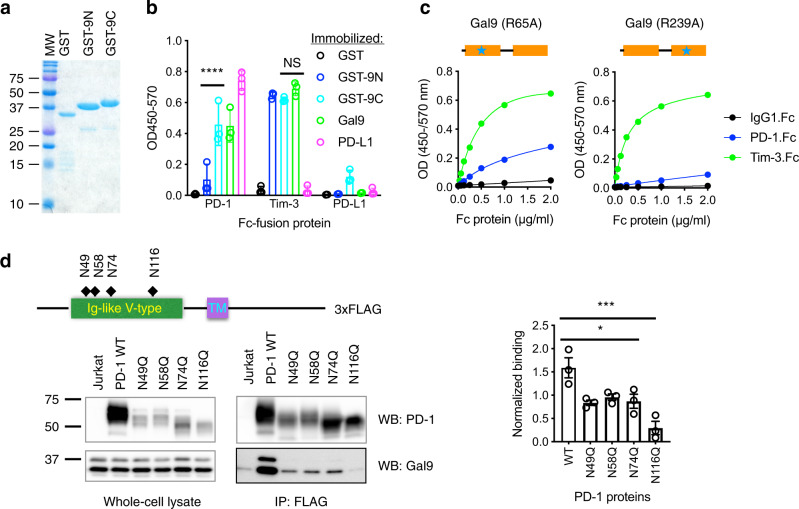
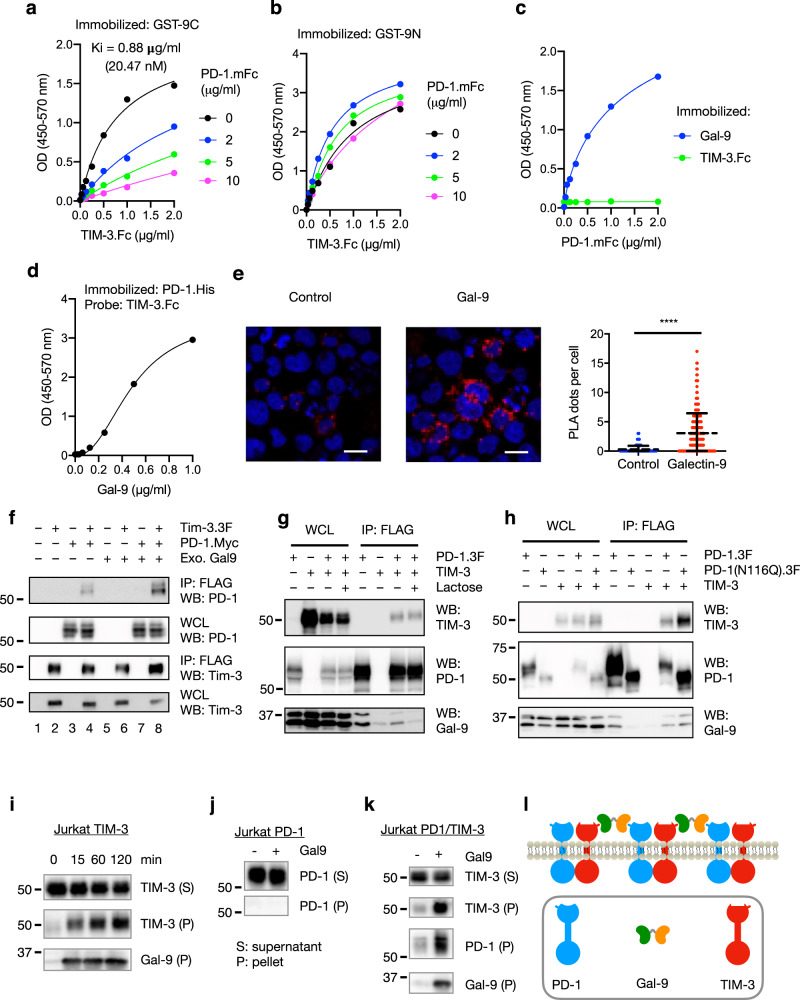
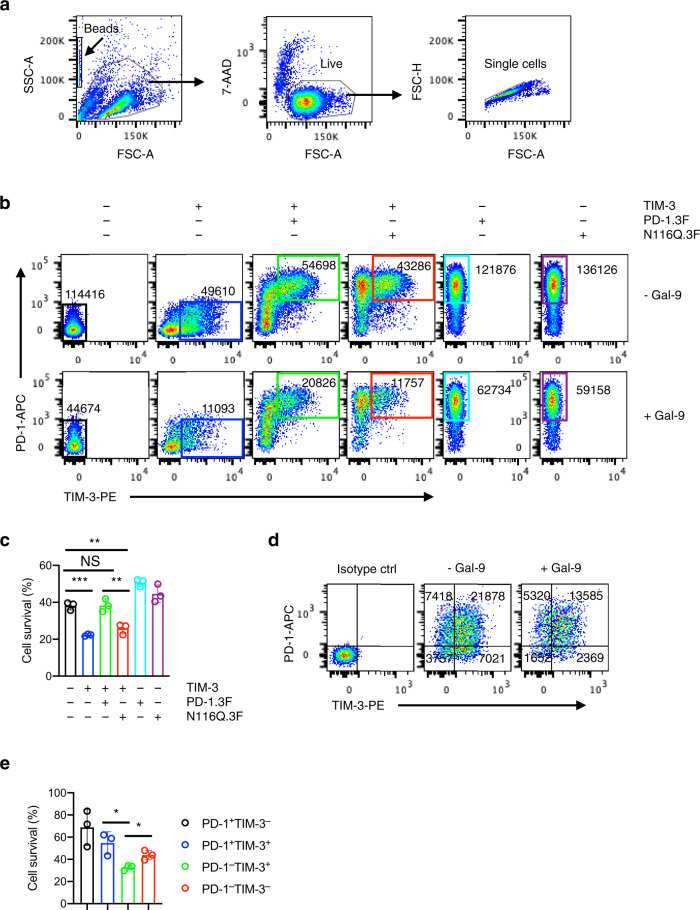
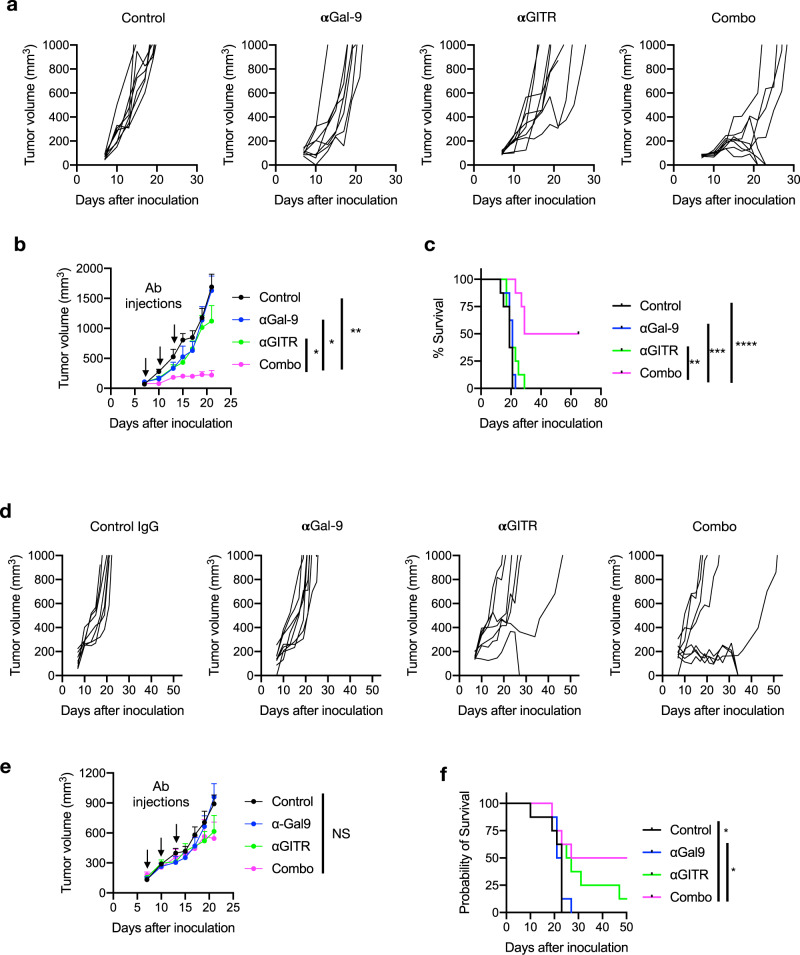
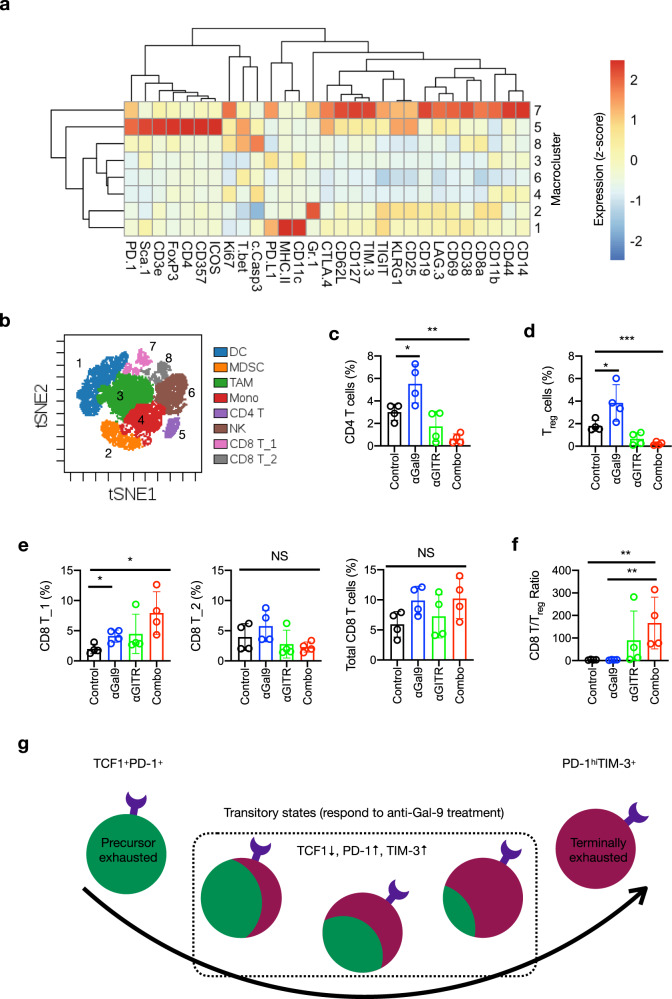
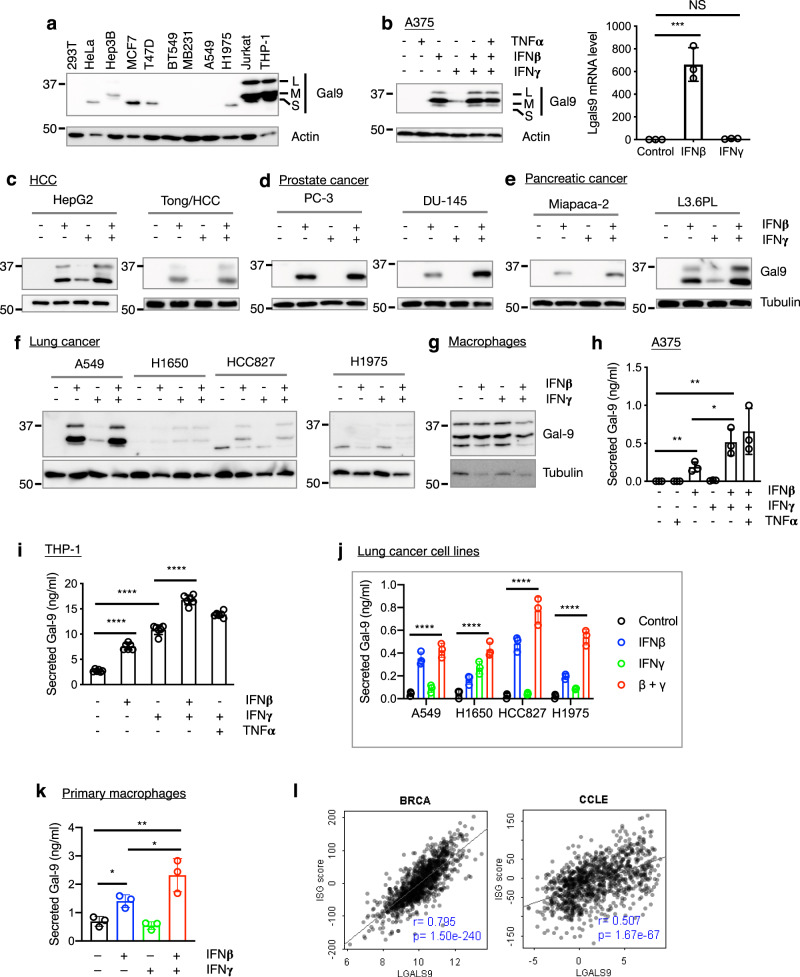
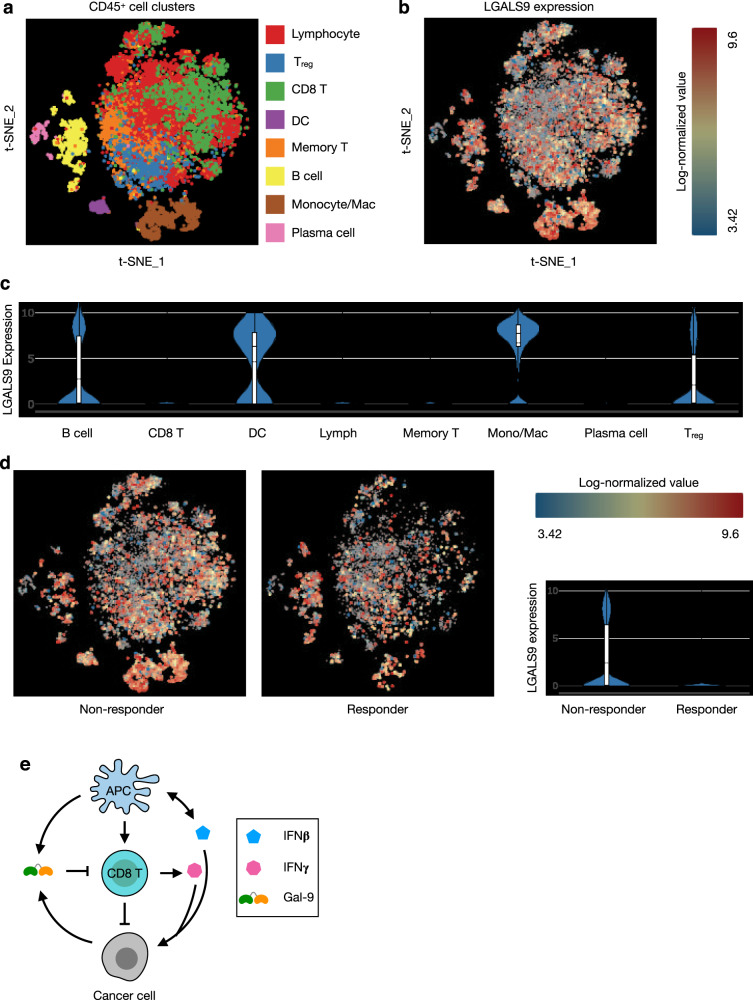
The two T cell inhibitory receptors PD-1 and TIM-3 are co-expressed during exhausted T cell differentiation, and recent evidence suggests that their crosstalk regulates T cell exhaustion and immunotherapy efficacy; however, the molecular mechanism is unclear. Here we show that PD-1 contributes to the persistence of PD-1+TIM-3+ T cells by binding to the TIM-3 ligand galectin-9 (Gal-9) and attenuates Gal-9/TIM-3-induced cell death. Anti-Gal-9 therapy selectively expands intratumoral TIM-3+ cytotoxic CD8 T cells and immunosuppressive regulatory T cells (Treg cells). The combination of anti-Gal-9 and an agonistic antibody to the co-stimulatory receptor GITR (glucocorticoid-induced tumor necrosis factor receptor-related protein) that depletes Treg cells induces synergistic antitumor activity. Gal-9 expression and secretion are promoted by interferon β and γ, and high Gal-9 expression correlates with poor prognosis in multiple human cancers. Our work uncovers a function for PD-1 in exhausted T cell survival and suggests Gal-9 as a promising target for immunotherapy.


Conflict of interest statement

The authors declare no competing interests.

Figures

Fig. 1
Fig. 1. Galectin-9 is a PD-1-binding protein.
a Lysates of Jurkat cells transduced with control lentivirus or PD-1 tagged at the C-terminus with 3× FLAG tag (PD-1.3F) were immunoprecipitated with anti-FLAG magnetic beads and the associated proteins were subjected to immunoblotting with Gal-9 or PD-1 antibodies. The three Gal-9 bands (L, M, S) represent different isoforms resulted from alternative pre-mRNA splicing. b Jurkat PD-1 cell lysates were incubated with glutathione-Sepharose (control) or Gal-9-Sepharose beads with or without sucrose or lactose. Bound proteins were eluted and western blotted with anti-PD-1 antibody. c, d Plate-based binding assay with purified recombinant proteins shows direct and specific binding of PD-1 extracellular domain (ECD) to Gal-9. MaxiSorp plates were coated with Gal-9 and incubated with Fc-fusion protein of the ECD of test binding partners (PD-1, PD-L1, or TIM-3) at various concentrations. Binding was detected by spectrophotometry using an HRP-labeled anti-human IgG (Fc-specific) antibody and the HRP substrate TMB (3,3’,5.5’-tetramethylbenzidine). X: protein immobilized on plate; Y.Fc: Fc conjugated potential binding protein or IgG1-Fc (control); HRP-αFc: HRP (horseradish peroxidase)-labeled anti-Fc antibody. e Binding of PD-1 ECD to immobilized Gal-9 or PD-L1 ECD in the absence or presence of the PD-1 antibodies pembrolizumab (Pembro) or nivolumab (Nivo). n = 3 independent experiments. Error bars represent SD. Statistical differences were assessed using two-way ANOVA with Sidak’s multiple comparisons test. IgG4 vs Nivo, P < 0.0001; IgG4 vs Pembro, P < 0.0001. Data are representative of three (a, b) or two (d) independent experiments. Source data are provided as a Source data file.
Fig. 2
Fig. 2. Binding of Gal-9 to PD-1 is primarily mediated by the C-CRD of Gal-9 and the N116-linked glycan of PD-1.
a SDS-PAGE of GST and GST-fusion proteins of the N-CRD (GST-9N) and C-CRD (GST-9C) of Gal-9. b Plate-based binding assay measuring the binding of PD-1, TIM-3, and PD-L1 to indicated proteins immobilized on MaxiSorp plates. n = 3 independent experiments. Error bars represent SD. Statistical differences were assessed using two-way ANOVA with Tukey’s multiple comparisons test. ****P < 0.0001. c Plate-based binding assays of PD-1 and TIM-3 binding to immobilized Gal-9 mutants with loss-of-function point mutation in the N-CRD (R65A) or C-CRD (R239A), respectively. d Lysates of Jurkat cells expressing 3xFLAG-tagged WT PD-1 or glycosylation site mutants were incubated anti-FLAG M2 magnetic beads. Bound proteins were eluted and subjected to Western blotting with PD-1 or Gal-9 antibodies. Statistical differences were assessed using ordinary one-way ANOVA with Dunnett’s multiple comparisons test. *P < 0.05; ***P < 0.001. WT vs N49Q, P = 0.0113; WT vs N58Q, P = 0.0302; WT vs N74Q, P = 0.0148; WT vs N116Q, P = 0.0002. Data are representative of two (a, c) or three (d) experiments. Source data are provided as a Source data file.
Fig. 3
Fig. 3. Characterization of TIM-3/Gal-9/PD-1 tri-molecular interaction.
a, b TIM-3 ECD binding to plate-immobilized GST-Gal-9C (a) or GST-Gal-9N (b) in the presence of increasing concentrations of PD-1 ECD. c PD-1 ECD binding to plate-immobilized TIM-3 ECD or Gal-9. d TIM-3 ECD binding to plate-immobilized PD-1 in the presence of increasing concentrations of Gal-9. e Duolink assay of PD-1 and TIM-3 association in Gal-9 KO Jurkat cells co-expressing the two receptors with or without Gal-9. Scale bar: 10 μm. Dashed lines represent mean values; error bars represent SD. Statistical differences were assessed using unpaired two-tailed t-tests. n = 254 cells examined for each group over two independent experiments. ****P < 0.0001. f Jurkat cells expressing PD-1 (myc tagged) and TIM-3 (3xFlag tagged) individually or together were incubated with or without 2 μg/ml exogenous Gal-9 followed by IP/western blotting with indicated antibodies. g, h IP/Western analysis of Jurkat cells expressing TIM-3 and 3xFlag tagged wildtype PD-1 or PD-1(N116Q) mutant, individually or in indicated combinations, in the presence or absence of lactose. ik Jurkat cells expressing PD-1 (i) or TIM-3 (j) or both (k) were incubated with or without Gal-9, and then lysed in a detergent buffer and centrifuged. Protein levels in the supernatants (S) and pellets (P) were determined by western blotting with the indicated antibodies. l Schematic diagram showing TIM-3/Gal-9/PD-1 tri-molecular interactions. TIM-3 and PD-1 dimerize through their intracellular domains. Gal-9 crosslinks TIM-3/PD-1 dimers with its N-CRD (green) and C-CRD (orange) to form galectin/glycoprotein lattices. Data are representative of two (ai) or three (j, k) independent experiments. Source data are provided as a Source data file.
Fig. 4
Fig. 4. Co-expressed PD-1 protects TIM-3+ T cells from Gal-9-induced cell death.
ac Jurkat cells transduced with indicated proteins individually or in combinations were treated with or without Gal-9 for two days and stained with PD-1/TIM-3 antibodies. Cell survival of relevant PD-1/TIM-3 subsets was determined by flow cytometry with counting beads. a Cells were gated based on FSC/SSC parameters and 7-AAD staining. b, c Viable single cells equivalent to 3000 counting beads are shown in plots for each sample (10,000 beads were added to each sample just prior to data acquisition). Numbers in plots indicate cell count in corresponding gates. Data (mean values ± SD) from three independent experiments are shown (c). Two-tailed unpaired t-test. NS, not significant (P > 0.05); **P < 0.01; ***P < 0.001. Control vs TIM-3, P = 0.0003; control vs TIM-3 + PD-1, P = 0.9382; control vs TIM-3 + PD-1(N116Q), P = 0.0040; TIM-3 + PD-1 vs TIM-3 + PD-1(N116Q), P = 0.0084. d, e Human CD8 T cells were incubated in ImmunoCult-XF T Cell Expansion Medium with or without Gal-9 in the presence of IL-2 and ImmunoCult Human CD3/CD28/CD2 T Cell Activator for 2 days and analyzed by flow cytometry with counting beads as described above for the survival of different PD-1/TIM-3 subsets. Numbers in plots indicate cell counts in corresponding quadrants. Data (mean values ± SD) are representative of three independent experiments. Two-tailed unpaired t-test. *P < 0.05. PD-1TIM-3+ vs PD-1+TIM-3+, P = 0.0212; PD-1TIM-3+ vs PD-1TIM-3, P = 0.0164. Source data are provided as a Source data file.
Fig. 5
Fig. 5. Gal-9 is a target for cancer immunotherapy.
a Tumor growth curves of individual C57BL/6J mice inoculated with MC-38 tumors at day 0 and subjected to indicated treatment. b The average tumor growth of mice inoculated with MC-38 tumor cells and subjected to the indicated treatments. Each dot represents mean of 8 mice in each treatment group. Error bars represent SEM of the means. Treatment schedule is indicated by arrows. Statistical differences of tumor growth kinetics between treatment groups were assessed using unpaired two-tailed t-tests to compare area under the curves. Control vs combo, P = 0.0023; αGal-9 vs combo, P = 0.0302; αGITR vs combo, P = 0.0192. c Log-rank (Mantel–Cox) tests for comparison of survival curves of mice inoculated with MC-38 tumors. Control vs combo, P < 0.0001; αGal-9 vs combo, P = 0.0001; αGITR vs combo, P = 0.0017. d Tumor growth curves of individual BALB/cJ mice inoculated with EMT6 tumors at day 0 and subjected to indicated treatment. e Average tumor growth of mice inoculated with EMT6 tumor cells and subjected to the indicated treatments. n = 8 mice in each treatment group. Error bars represent SEM of the means. Treatment schedule is indicated by arrows. Statistical differences of tumor growth kinetics between treatment groups were assessed using unpaired two-tailed t-tests to compare area under the curves. f Log-rank (Mantel–Cox) tests for comparison of survival curves of mice inoculated with EMT6 tumors. Control vs combo, P = 0.0363; αGal-9 vs combo, P = 0.0433; control vs αGITR, P = 0.0666; αGITR vs combo, P = 0.2394. Data are representative of two (ac) or one (df) independent experiments. Source data are provided as a Source data file.
Fig. 6
Fig. 6. Anti-Gal-9 therapy targets specific tumor-infiltrating T cell populations.
a Heatmap showing differential marker expression in CD45+ TIL clusters identified by analysis of CyTOF data using viSNE and FlowSOM. b Annotation of TIL populations based on differential marker expression as shown in (a) and Supplementary Fig. 6. DC, dendritic cell; MDSC, myeloid-derived suppressor cell; TAM, tumor-associated macrophage; Mono, monocytes; CD4 T, CD4 T cell; NK, natural killer cell; CD8 T_1, CD8 T cell subset 1; CD8 T_2, CD8 T cell subset 2. ce T cell subset frequency in total CD45+ TILs. c CD4 T cells. Control vs αGal-9, P = 0.0337; control vs combo, P = 0.0013. d Treg cells. Control vs αGal-9, P = 0.0327; control vs combo, P = 0.0009. e CD8 T cell subsets. CD8 T_1 subset: control vs αGal-9, P = 0.0155; control vs combo, P = 0.0165. f CD8 T/Treg ratios in TILs from indicated treatment groups. Control vs combo, P = 0.0022, αGal-9 vs combo, P = 0.0021. g Proposed model of Gal-9 inhibition-elicited T cell response in tumor. The proliferating transitory T cells in the process of precursor exhausted T cells differentiation into terminally exhausted T cells are the major responders to anti-Gal-9 treatment. Unpaired two-tailed t tests were used for comparing means between treatment groups in (cf). n = 4 mice in each treatment group. Error bars represent SD. Source data are provided as a Source data file.
Fig. 7
Fig. 7. Interferon β and γ promote Gal-9 expression and secretion.
a Baseline expression of Gal-9 protein in cancer cell lines. L, M, and S denote the three common Gal-9 isoforms resulting from alternative pre-mRNA splicing. b Regulation of Gal-9 expression in A375 human melanoma cells by indicated inflammatory cytokines at protein (left) or mRNA (right) levels. Data are presented as mean values ± SD. Statistical differences were assessed using ordinary one-way ANOVA with Dunnett’s multiple comparisons test. NS, not significant; ***P < 0.001. Control vs IFNβ, P = 0.0002; control vs IFNγ, P = 0.9940. c–g The effects of IFNβ and IFNγ on Gal-9 expression in cell lines of multiple cancer types and primary macrophages. hk The effects of IFNβ and IFNγ on Gal-9 secretion from tumor cells and immune cells. h A375 melanoma cells. n = 3 independent experiments. Control vs IFNβ, P = 0.0074; IFNβ vs IFNβ + IFNγ, P = 0.0388; control vs IFNβ + IFNγ, P = 0.0070. i THP-1 monocytic leukemia cells. n = 6 independent experiments. Control vs IFNβ, P < 0.0001; control vs IFNγ, P < 0.0001; IFNβ vs IFNβ + IFNγ, P < 0.0001; IFNγ vs IFNβ + IFNγ, P < 0.0001. j Lung cancer cell lines. n = 3 independent experiments. Control vs IFNβ + IFNγ, P < 0.0001 for all the cell lines. k Primary macrophages. n = 3 independent experiments. Control vs IFNβ, P = 0.0117; IFNβ vs IFNβ + IFNγ, P = 0.0395; control vs IFNβ + IFNγ, P = 0.0099. l Expression correlation of LGALS9 with ISGs in the TCGA BRCA dataset and all cancer cell lines in CCLE, as analyzed by linear regression (Pearson correlation with two-tailed p-values). Unpaired two-tailed t tests were used for comparing means between treatment groups in (hk). Each circle represents one experiment. Error bars represent SD. Data shown in (ag) are representative of three independent experiments.
Fig. 8
Fig. 8. Reanalysis of single-cell RNA-seq data from melanoma TILs for Gal-9 expression.
 Single-cell RNA-seq data of human melanoma TILs (GSE120575) were reanalyzed with BBrowser2 (BioTuring). a, b t-SNE plots showing cell type composition (a) and Gal-9 expression (b) in melanoma TILs. c Violin plot showing expression of Gal-9 in melanoma TIL cell types. n = 1455 B cells, 305 plasma cells, 1391 macrophages/monocytes, 209 dendritic cells, 5459 lymphocytes, 3878 CD8 T cells, 1740 regulatory T cells, and 1773 memory T cells. d Gal-9 expression in non-responder (n = 10,190 cells) and responder (n = 5110 cells) to anti-PD-1 therapy. For violin plots in (c, d), whiskers indicate minima and maxima, lines inside box indicate medians and means, and bounds of box indicate 25th and 75th percentiles, respectively. e Interferon-induced Gal-9 expression and secretion as a potential mechanism of tumor adaptive immune resistance. In the TME, IFNβ (produced by APCs and tumor cells) and IFNγ (produced by activated CD8 T cells) induce Gal-9 expression and secretion by APCs and cancer cells. Gal-9, in turn, induces death of T cells and dampens the antitumor immune response.

Similar articles

Cited by

References

    1. Fridman WH, et al. The immune contexture in human tumours: Impact on clinical outcome. Nat. Rev. Cancer. 2012;12:298–306. doi: 10.1038/nrc3245. - DOI - PubMed
    1. Chen L, Flies DB. Molecular mechanisms of T cell co-stimulation and co-inhibition. Nat. Rev. Immunol. 2013;13:227–242. doi: 10.1038/nri3405. - DOI - PMC - PubMed
    1. Mann TH, Kaech SM. Tick-TOX, it’s time for T cell exhaustion. Nat. Immunol. 2019;20:1092–1094. doi: 10.1038/s41590-019-0478-y. - DOI - PubMed
    1. Chen Z, et al. TCF-1-Centered transcriptional network drives an effector versus exhausted CD8 T cell-fate decision. Immunity. 2019;51:840–855. doi: 10.1016/j.immuni.2019.09.013. - DOI - PMC - PubMed
    1. Escobar G, Mangani D, Anderson AC. T cell factor 1: a master regulator of the T cell response in disease. Sci. Immunol. 2020;5:eabb9726. doi: 10.1126/sciimmunol.abb9726. - DOI - PMC - PubMed

Publication types

MeSH terms