. 2021 Feb 5;11(1):3258.
doi: 10.1038/s41598-021-82729-9.

NLRC5/CITA expression correlates with efficient response to checkpoint blockade immunotherapy

Affiliations

NLRC5/CITA expression correlates with efficient response to checkpoint blockade immunotherapy

Sayuri Yoshihama et al. Sci Rep. .

Abstract

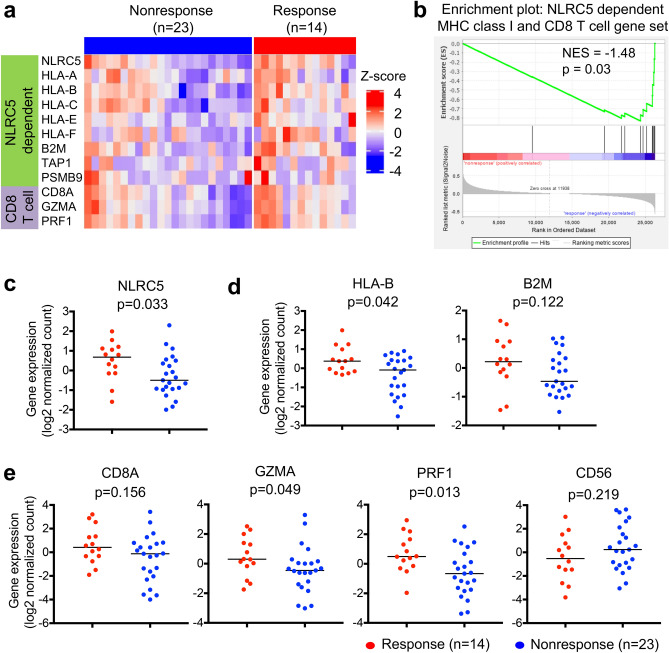
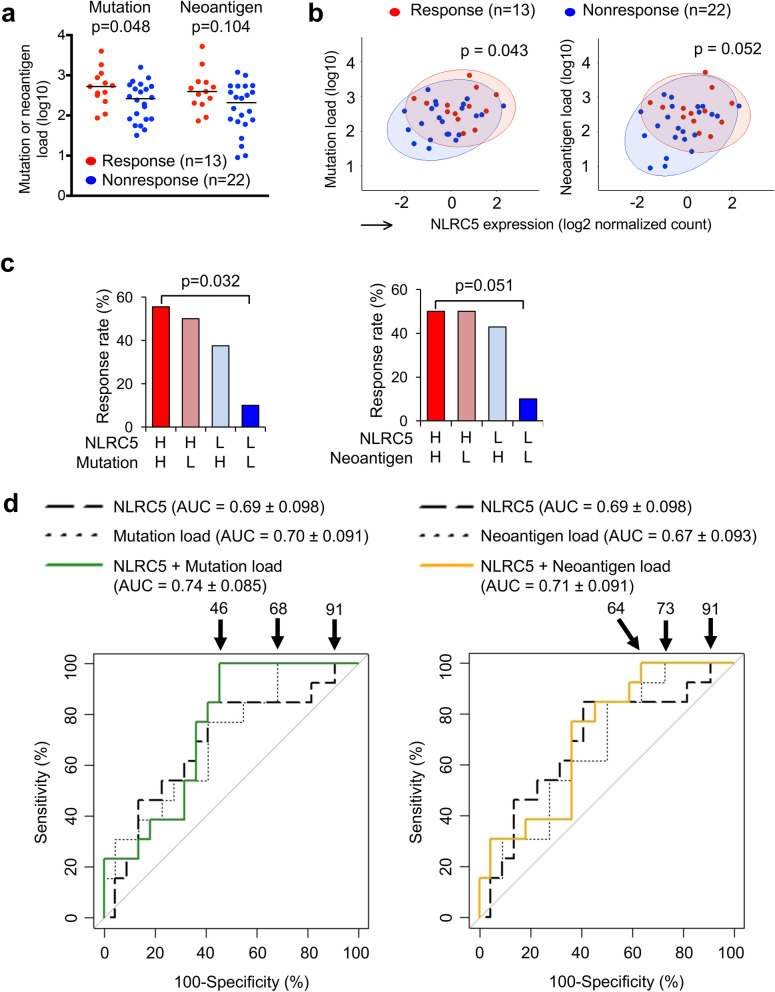
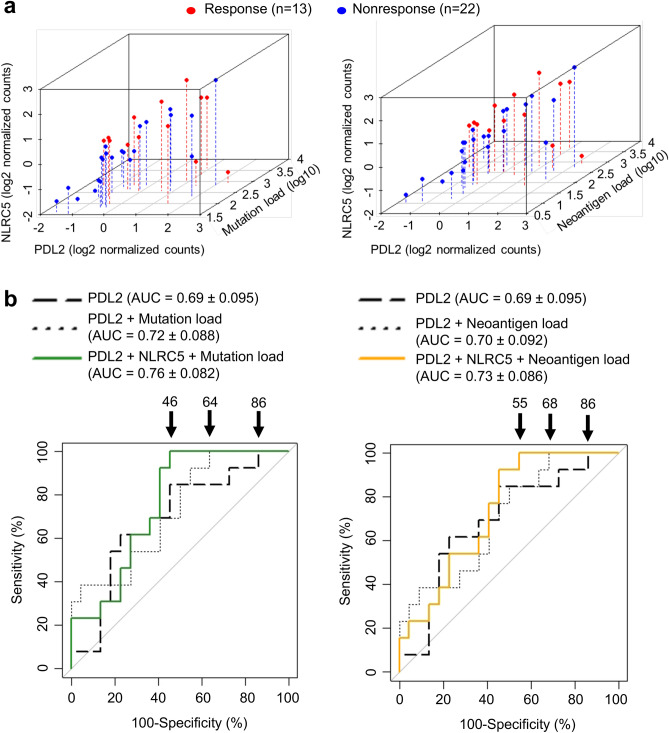
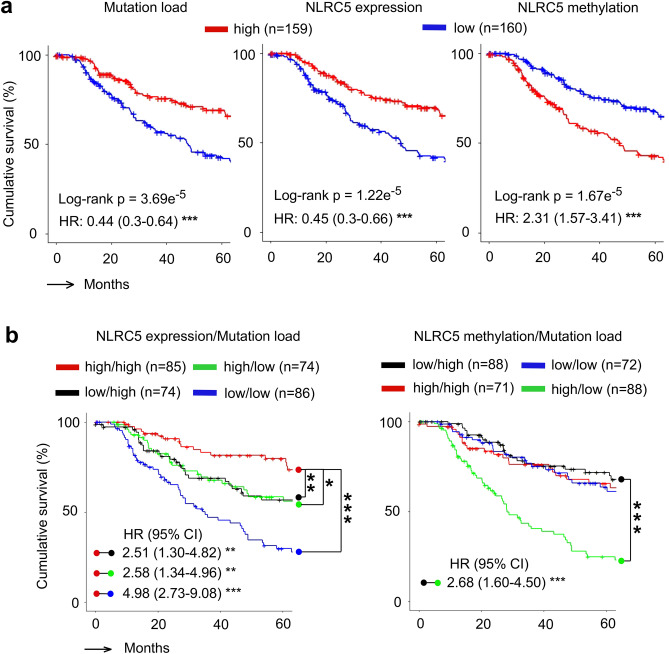
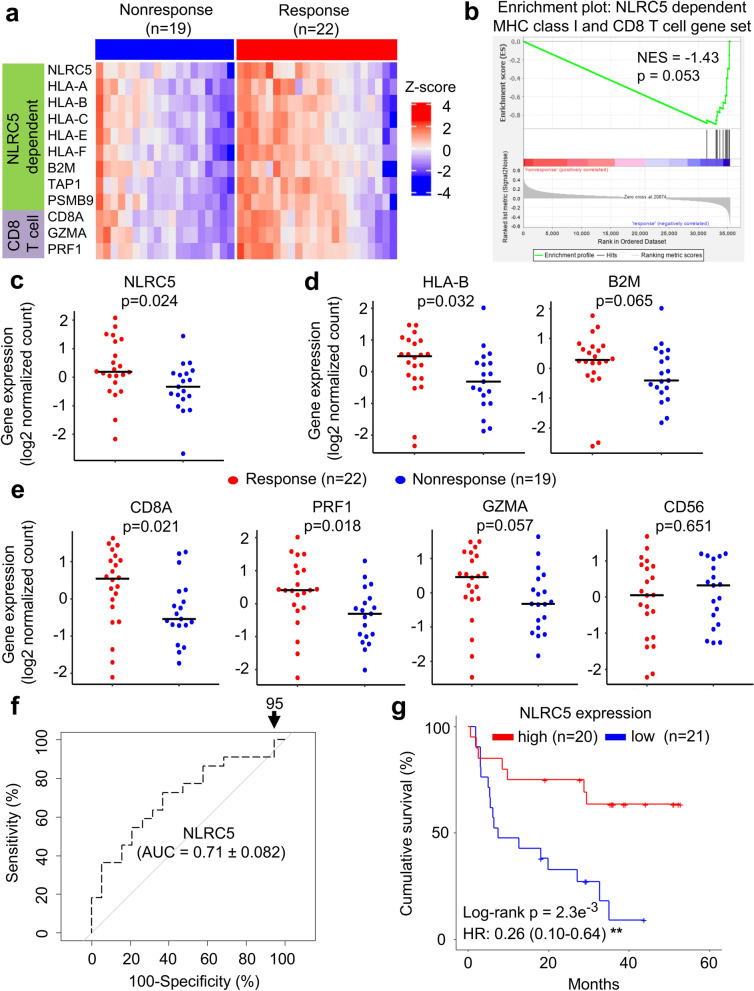
Checkpoint blockade-mediated immunotherapy is emerging as an effective treatment modality for multiple cancer types. However, cancer cells frequently evade the immune system, compromising the effectiveness of immunotherapy. It is crucial to develop screening methods to identify the patients who would most benefit from these therapies because of the risk of the side effects and the high cost of treatment. Here we show that expression of the MHC class I transactivator (CITA), NLRC5, is important for efficient responses to anti-CTLA-4 and anti-PD1 checkpoint blockade therapies. Melanoma tumors derived from patients responding to immunotherapy exhibited significantly higher expression of NLRC5 and MHC class I-related genes compared to non-responding patients. In addition, multivariate analysis that included the number of tumor-associated non-synonymous mutations, predicted neo-antigen load and PD-L2 expression was capable of further stratifying responders and non-responders to anti-CTLA4 therapy. Moreover, expression or methylation of NLRC5 together with total somatic mutation number were significantly correlated with increased patient survival. These results suggest that NLRC5 tumor expression, alone or together with tumor mutation load constitutes a valuable predictive biomarker for both prognosis and response to anti-CTLA-4 and potentially anti-PD1 blockade immunotherapy in melanoma patients.


Conflict of interest statement

The authors declare no competing interests.

Figures

Figure 1
Figure 1
The expression of NLRC5-dependent MHC class I and CD8+ T cell genes are correlated with response to anti-CTLA-4 antibody therapy. Patients groups who benefitted from anti-CTLA4 antibody therapy (Response, n = 14) and who did not (Nonresponse, n = 23) were analyzed for differential gene set enrichment by (a) heatmap and (b) GSEA as well as individual gene expression levels of (c) NLRC5, (d) HLA-B, B2M, (e) CD8A, granzyme A (GZMA), perforin (PRF1) and CD56. Bar represents the median value. P-values calculated using Mann–Whitney U test. NES, normalized enrichment score.
Figure 2
Figure 2
Multivariate analysis with NLRC5 expression and load of mutation or neoantigen provide predictive information for the response to anti-CTLA-4 therapy. (a) Comparison of mutation and neoantigen load between response (n = 13) and non-response (n = 22) groups. P-values were calculated using Mann–Whitney U test. (b) Scatterplots for NLRC5 expression and mutation or neoantigen load. 95% confidence ellipses about the centroids were drawn for both response (red circle) and non-response group (blue circle). P-values were calculated using Hotelling’s Test. (c) Response rate to anti-CTLA-4 therapy in the four groups stratified by NLRC5 expression and mutation/neoantigen load. Cohort was divided into four groups based on the level of NLRC5 expression and mutation or neoantigen load. The response rate (%) to the therapy among each group was calculated. Patients carrying higher value of the median are defined as high group (H), those carrying lower value of the median are defined as low group (L) in respective variables. Statistical significance between the groups of high NLRC5 expression/high mutation or neoantigen load and low NLRC5 expression/low mutation or neoantigen load were determined by the χ2 test. (d) ROC curves for logistic regression models using the respective combination of NLRC5 expression, mutation load and neoantigen load. The numbers with arrow are showing false positive rate with 100% sensitivity. AUC (area under the curve) ± SE (standard error) is depicted.
Figure 3
Figure 3
Combination of PD-L2 expression with NLRC5 expression and mutation or neoantigen load are sensitive predictors for responses to anti-CTLA-4 therapy. (a) Scatterplots for NLRC5 and PD-L2 expression with mutation load (left panel) or neoantigen load (right panel) for response (n = 13) and nonresponse (n = 22) groups. (b) ROC curves for logistic regression models using the respective combination of PD-L2 expression, NLRC5 expression, mutation load and neoantigen load. The numbers with arrow are showing false positive rate with 100% sensitivity. AUC (area under the curve) ± SE (standard error) is depicted.
Figure 4
Figure 4
Combination of NLRC5 expression and load of mutation or neoantigen provide prognostic information. (a) Kaplan–Meier estimates of five year overall survival of patients with high and low mutation load (Left), NLRC5 gene expression (Middle), and NLRC5 methylation (Right). Patients in the TCGA melanoma cohort were stratified by medians into high and low groups (n = 159 and n = 160). (b) Kaplan–Meier estimates of five year overall survival of patients with varying levels of two factors, NLRC5 expression and mutation load (Left) and NLRC5 methylation and mutation load (Right). Patients were stratified by two factors (NLRC5 expression/NLRC5 methylation and mutation load) in a similar fashion with (a), yielding four groups (high NLRC5 expression/NLRC5 methylation and high mutation load, likewise, high and low, low and high, low and low). Pairwise log-rank test was used to analyze the survival in indicated pairs. Hazard ratio (HR) and 95% confidence interval (CI) was determined by multivariate analysis using Cox regression model (see Methods). *p < 0.05; **p < 0.01; ***p < 0.001.
Figure 5
Figure 5
The expression of NLRC5 and NLRC5-dependent MHC class I and CD8+ T cell genes as a predictor to anti-PD1 therapy. Patients groups who benefitted from anti-PD1 therapy (Response, n = 22) and who did not (Nonresponse, n = 19) were analyzed for differential gene set enrichment by (a) heatmap and (b) GSEA as well as individual gene expression levels of (c) NLRC5, (d) HLA-B, B2M, (e) CD8A, granzyme A (GZMA), perforin (PRF1) and CD56. Bar represents the median value. P-values calculated using Mann–Whitney U test. NES, normalized enrichment score. (f) ROC curve for logistic regression model using NLRC5 expression. The numbers with arrow are showing false positive rate with 100% sensitivity. AUC (area under the curve) ± SE (standard error) is depicted. (g) Kaplan–Meier estimates of five year overall survival of patients with high and low NLRC5 gene expression, stratified by median expression (n = 20 and n = 21). Hazard ratio (HR) and 95% confidence interval (CI) was determined by multivariate analysis using Cox regression model (see Methods). **p < 0.01.

References

    1. Pardoll DM. The blockade of immune checkpoints in cancer immunotherapy. Nat. Rev. Cancer. 2012;12:252–264. doi: 10.1038/nrc3239. - DOI - PMC - PubMed
    1. Sharma P, Allison JP. The future of immune checkpoint therapy. Science. 2015;348:56–61. doi: 10.1126/science.aaa8172. - DOI - PubMed
    1. Postow MA, Callahan MK, Wolchok JD. Immune checkpoint blockade in cancer therapy. J. Clin. Oncol. 2015;33:1974–1982. doi: 10.1200/JCO.2014.59.4358. - DOI - PMC - PubMed
    1. Swart M, Verbrugge I, Beltman JB. Combination approaches with immune-checkpoint blockade in cancer therapy. Front. Oncol. 2016;6:233. doi: 10.3389/fonc.2016.00233. - DOI - PMC - PubMed
    1. Weber JS, Kahler KC, Hauschild A. Management of immune-related adverse events and kinetics of response with ipilimumab. J. Clin. Oncol. 2012;30:2691–2697. doi: 10.1200/JCO.2012.41.6750. - DOI - PubMed

Publication types

MeSH terms

Substances