. 2021 Jun;1494(1):31-43.
doi: 10.1111/nyas.14571. Epub 2021 Feb 5.

Associations between private vaccine and antimicrobial consumption across Indian states, 2009-2017

Affiliations

Associations between private vaccine and antimicrobial consumption across Indian states, 2009-2017

Emily Schueller et al. Ann N Y Acad Sci. 2021 Jun.

Abstract

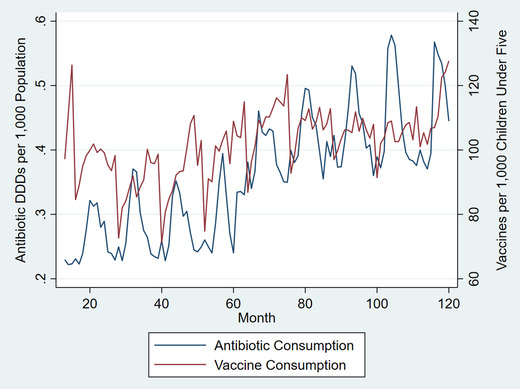
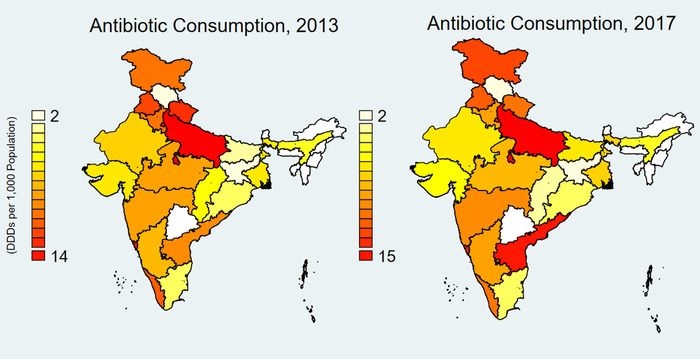
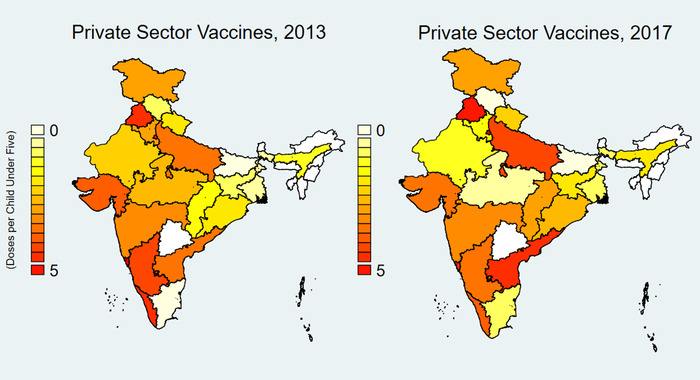
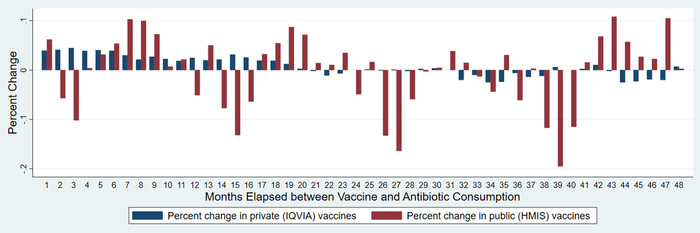
Vaccines can reduce antibiotic use and, consequently, antimicrobial resistance by averting vaccine-preventable and secondary infections. We estimated the associations between private vaccine and antibiotic consumption across Indian states during 2009-2017 using monthly and annual consumption data from IQVIA and employed fixed-effects regression and the Arellano-Bond Generalized Method of Moments (GMM) model for panel data regression, which controlled for income and public sector vaccine use indicators obtained from other sources. In the annual data fixed-effects model, a 1% increase in private vaccine consumption per 1000 under-5 children was associated with a 0.22% increase in antibiotic consumption per 1000 people (P < 0.001). In the annual data GMM model, a 1% increase in private vaccine consumption per 1000 under-5 children was associated with a 0.2% increase in private antibiotic consumption (P < 0.001). In the monthly data GMM model, private vaccine consumption was negatively associated with antibiotic consumption when 32, 34, 35, and 44-47 months had elapsed after vaccine consumption, with a positive association with lags of fewer than 18 months. These results indicate vaccine-induced longer-term reductions in antibiotic use in India, similar to findings of studies from other low- and middle-income countries.

Keywords: AMR; India; antibiotic use; antimicrobial resistance; antimicrobial use; vaccine.


Conflict of interest statement

The authors declare no competing interests.

Figures

Figure 1
Figure 1
Monthly antibiotic and vaccine consumption in 13 Indian States and Delhi, 2009–2017. Sources: IQVIA 2018 and Government of India Health Management Information System. All rights reserved. DDDs were calculated using the Anatomical Therapeutic Chemical Classification System (ATC/DDD, 2016) developed by the Collaborating Centre for Drug Statistics Methodology of the World Health Organization (WHOCC). Indian states and Union territories include Andhra Pradesh, Assam, Bihar, Delhi, Gujarat, Karnataka, Kerala, Madhya Pradesh, Maharashtra, Odisha, Rajasthan, Tamil Nadu, Uttar Pradesh, and West Bengal. Other states were omitted due to lack of data before 2013.
Figure 2
Figure 2
Private sector antibiotic consumption per 1000 population in 21 Indian States and Delhi, 2013 and 2017. Source: IQVIA 2018. All rights reserved. DDDs were calculated using the Anatomical Therapeutic Chemical Classification System (ATC/DDD, 2016) developed by the Collaborating Centre for Drug Statistics Methodology of the World Health Organization (WHOCC). Indian states and Union territories include Andhra Pradesh, Assam, Bihar, Chhattisgarh, Delhi, Goa, Gujarat, Haryana, Himachal Pradesh, Jammu and Kashmir, Jharkhand, Karnataka, Kerala, Madhya Pradesh, Maharashtra, Odisha, Punjab, Rajasthan, Tamil Nadu, Uttar Pradesh, Uttarakhand, and West Bengal. Other states were omitted due to lack of data.
Figure 3
Figure 3
Private sector vaccine consumption per 1000 population in 21 Indian States and Delhi, 2013 and 2017. Source: IQVIA 2018. All rights reserved. Indian states and Union territories include Andhra Pradesh, Assam, Bihar, Chhattisgarh, Delhi, Goa, Gujarat, Haryana, Himachal Pradesh, Jammu and Kashmir, Jharkhand, Karnataka, Kerala, Madhya Pradesh, Maharashtra, Odisha, Punjab, Rajasthan, Tamil Nadu, Uttar Pradesh, Uttarakhand, and West Bengal. Other states were omitted due to lack of data.
Figure 4
Figure 4
Arellano–Bond GMM estimation results: percent change in antibiotic consumption associated with a 1% increase in private sector vaccine consumption. Source: IQVIA 2018. All rights reserved. DDDs were calculated using the Anatomical Therapeutic Chemical Classification System (ATC/DDD, 2016) developed by the Collaborating Centre for Drug Statistics Methodology of the World Health Organization (WHOCC). For details on the model specification, see the Supplemental Text (online only).

Similar articles

Cited by

References

    1. Klein, E.Y. , Van Boeckel T.P., Martinez E.M., et al. 2018. Global increase and geographic convergence in antibiotic consumption between 2000 and 2015. Proc. Natl. Acad. Sci. USA 115: E3463–E3470. - PMC - PubMed
    1. Van Boeckel, T.P. , Gandra S., Ashok A., et al. 2014. Global antibiotic consumption 2000 to 2010: an analysis of national pharmaceutical sales data. Lancet Infect. Dis. 14: 742–750. - PubMed
    1. Pathak, D. , Pathak A., Marrone G., et al. 2011. Adherence to treatment guidelines for acute diarrhoea in children up to 12 years in Ujjain, India—a cross‐sectional prescription analysis. BMC Infect. Dis. 11: 32–32. - PMC - PubMed
    1. Porter, G. & Grills N.. 2016. Medication misuse in India: a major public health issue in India. J. Public Health 38: e150–7. - PubMed
    1. Gandra, S. , Joshi J., Sankhil A. & Laxminarayan R.. 2017. Scoping report on antimicrobial resistance in India. Center for Disease Dynamics, Economics & Policy.

Publication types