. 2021 May;118(5):1943-1950.
doi: 10.1002/bit.27708. Epub 2021 Mar 3.

High-rate ethanol production at low pH using the anaerobic granular sludge process

Affiliations

High-rate ethanol production at low pH using the anaerobic granular sludge process

Jelmer Tamis et al. Biotechnol Bioeng. 2021 May.

Abstract

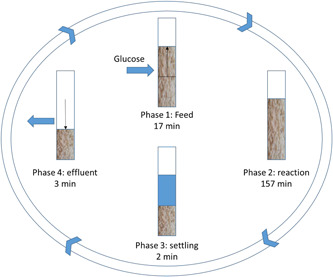
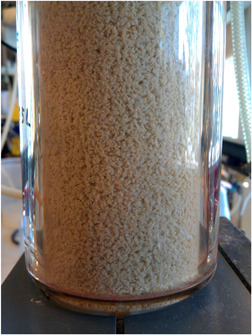
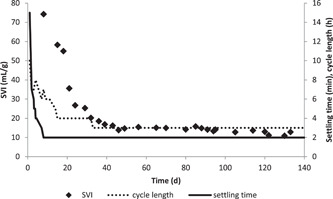
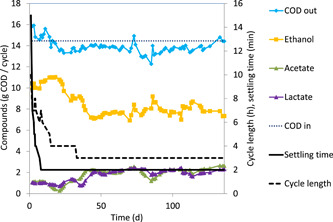
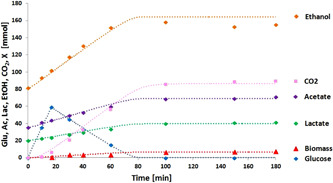
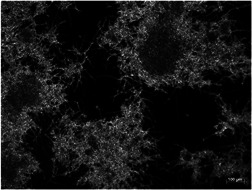
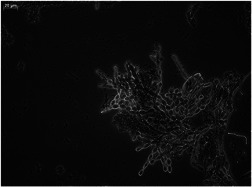
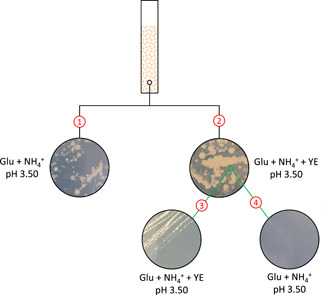
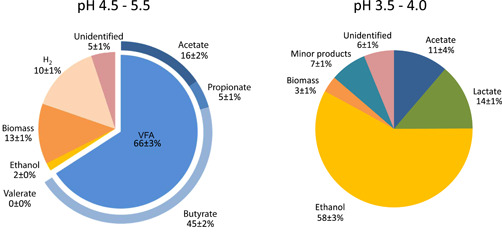
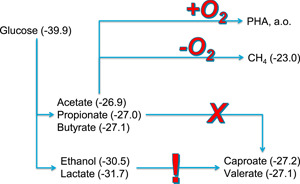
In this study, we investigated the operational performance and product spectrum of glucose-fermenting anaerobic granular sludge reactor at pH 4. A selective environment for the growth of granules was implemented by the introduction of a 2 min settling phase, a hydraulic retention time of 6 h and a solid retention time of 12 ± 3 days. The fermentation products were ethanol, lactate, and volatile fatty acids (VFA) with yields of 0.55 ± 0.03, 0.15 ± 0.02, and 0.20 ± 0.04 gram chemical oxygen demand (gCOD)/gCOD glucose, respectively. The obtained product spectrum was remarkably different from the VFA-dominated product spectrum reported in a previous study when the same system was operated at higher pH (4.5-5.5). The shift in product spectrum coincided with a shift in the microbial community structure with the dominance of eukaryotic Candida tropicalis, Pichia jaroonii, and prokaryotic Lactobacillus species instead of the Clostridia species obtained at higher pH-values. The control of the microbiomes and the associated product spectra provides bioprocess engineers with the option to tailor a suitable precursor compound mixture for subsequent chain elongation fermentation or PHA biopolymer production.

Keywords: VFA; ethanol; granular sludge; open/mixed culture fermentation; resource recovery.


Figures

Figure 1
Figure 1
Overview of the operational cycle of the bioreactor used for the anaerobic fermentation of glucose [Color figure can be viewed at wileyonlinelibrary.com]
Figure 2
Figure 2
Impression of the 0.5–2 mm anaerobic granules in the reactor [Color figure can be viewed at wileyonlinelibrary.com]
Figure 3
Figure 3
The sludge volume index of the biomass inside the reactor as well as settling time and cycle lengths. The settling time and later the cycle length were decreased during start‐up. The sludge became gradually more compact showing a decreasing SVI. SVI, sludge volume index
Figure 4
Figure 4
Profile of the main products in the effluent of the anaerobic fermentation for the duration of the whole experiment (136 days). The influent COD was determined by weighing the amount of glucose and was constant. The sum of the identified product (COD out) was close to the influent COD (94% ± 4%). COD, chemical oxygen demand [Color figure can be viewed at wileyonlinelibrary.com]
Figure 5
Figure 5
Product formation during a representative cycle (day 121) fitted with a data evaluation model in which an assumed lumped stoichiometry for glucose conversion was used. The symbols represent measured data points, while the dotted lines represent the model [Color figure can be viewed at wileyonlinelibrary.com]
Figure 6
Figure 6
Microscope image of crushed granular biomass observed on day 23 with ×100 magnification. Separating the cells via crushing proved difficult due to the hyphae entanglement
Figure 7
Figure 7
Microscope image of a small fragment of a crushed granule observed on day 87 with ×400 magnification. The image shows elongating and branching yeast hyphae with aggregates of bacteria in between
Figure 8
Figure 8
Schematic overview of the plate experiments with granular biomass: (1) on minimal medium only yeast could grow; (2) both bacteria and yeast grew when yeast extract was added; (3) the transfer of bacterial colonies from “2” to plates with yeast extract resulted in growth, while (4) transfer of bacterial colonies from “2” to the minimal medium resulted in no growth [Color figure can be viewed at wileyonlinelibrary.com]
Figure 9
Figure 9
Comparison between the product spectra on chemical oxygen demand basis of the effluent of the bioreactor operated at pH 4.5–5.5 in an earlier study (Tamis et al., 2015) and pH 3.5–4.0 in this study. VFA, volatile fatty acid [Color figure can be viewed at wileyonlinelibrary.com]
Figure 10
Figure 10
Conversion pathways for the anaerobic fermentation of glucose and the subsequent options for industrial valorization; between brackets, the Gibbs free energy per electron (kJ/mol) calculated from the reaction of each compound to CO2 and H2O. The resulting Gibbs energies show that both ethanol and lactate offer the opportunity for further conversion to medium chain length fatty acid, while volatile fatty acid can only be converted either to methane (anaerobically) or to molecules that are produced aerobically, like PHA [Color figure can be viewed at wileyonlinelibrary.com]

References

    1. Angenent, L. T. , Richter, H. , Buckel, W. , Spirito, C. M. , Steinbusch, K. J. J. , Plugge, C. M. , Strik, D. P. B. T. B. , Grootscholten, T. I. M. , Buisman, C. J. N. , & Hamelers, H. V. M. (2016). Chain elongation with reactor microbiomes: Open‐culture biotechnology to produce biochemicals. Environmental Science & Technology, 50(6), 2796–2810. - PubMed
    1. Dashko, S. , Zhou, N. , Compagno, C. , & Piškur, J. (2014). Why, when, and how did yeast evolve alcoholic fermentation? FEMS Yeast Research, 14(6), 826–832. - PMC - PubMed
    1. Fang, H. H. , & Liu, H. (2002). Effect of pH on hydrogen production from glucose by a mixed culture. Bioresource Technology, 82(1), 87–93. - PubMed
    1. Frey‐Klett, P. , Burlinson, P. , Deveau, A. , Barret, M. , Tarkka, M. , & Sarniguet, A. (2011). Bacterial‐fungal interactions: Hyphens between agricultural, clinical, environmental, and food microbiologists. Microbiology and Molecular Biology Reviews, 75(4), 583–609. 10.1128/MMBR.00020-11 - DOI - PMC - PubMed
    1. Gostinčar, C. , Grube, M. , De Hoog, S. , Zalar, P. , & Gunde‐Cimerman, N. (2009). Extremotolerance in fungi: evolution on the edge. FEMS Microbiology Ecology, 71(1), 2–11. - PubMed

Publication types

LinkOut - more resources