. 2021 Apr;36(4):863-873.
doi: 10.1002/mds.28513. Epub 2021 Feb 6.

Closed-Loop Deep Brain Stimulation for Essential Tremor Based on Thalamic Local Field Potentials

Affiliations

Closed-Loop Deep Brain Stimulation for Essential Tremor Based on Thalamic Local Field Potentials

Shenghong He et al. Mov Disord. 2021 Apr.

Abstract

Background: High-frequency thalamic stimulation is an effective therapy for essential tremor, which mainly affects voluntary movements and/or sustained postures. However, continuous stimulation may deliver unnecessary current to the brain due to the intermittent nature of the tremor.

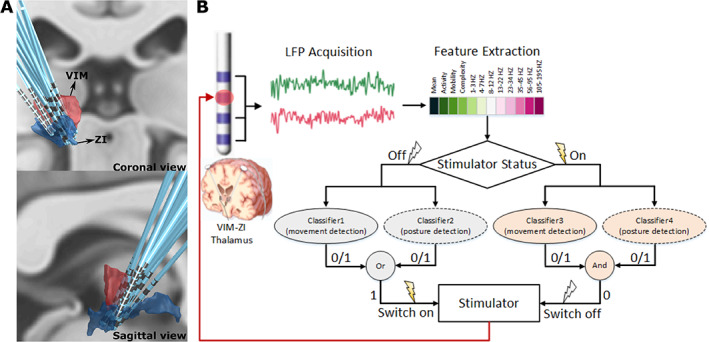
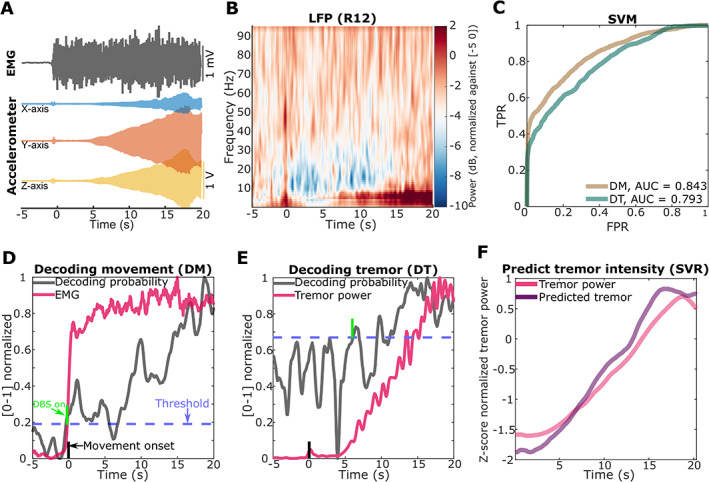
Objective: We proposed to close the loop of thalamic stimulation by detecting tremor-provoking movement states using local field potentials recorded from the same electrodes implanted for stimulation, so that the stimulation is only delivered when necessary.

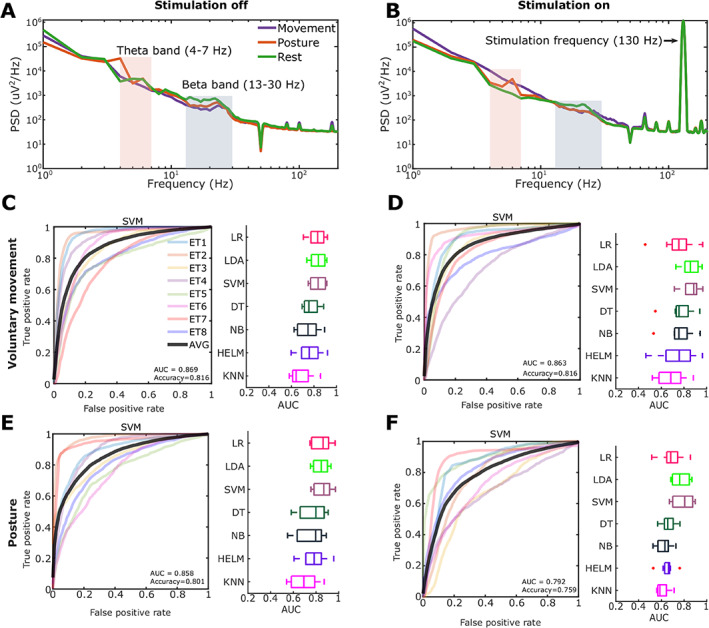
Methods: Eight patients with essential tremor participated in this study. Patient-specific support vector machine classifiers were first trained using data recorded while the patient performed tremor-provoking movements. Then, the trained models were applied in real-time to detect these movements and triggered the delivery of stimulation.

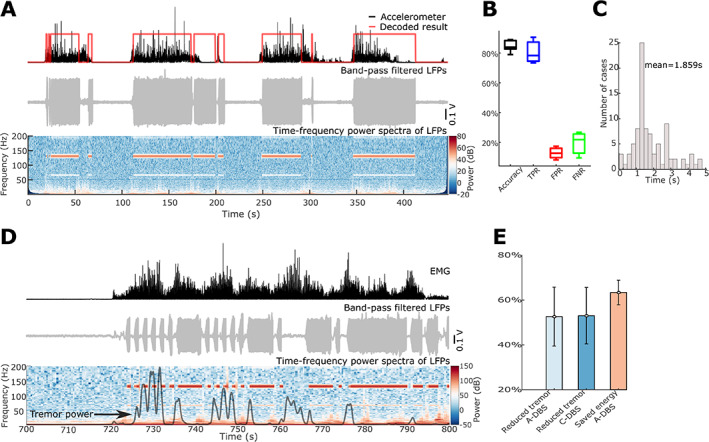
Results: Using the proposed method, stimulation was switched on for 80.37 ± 7.06% of the time when tremor-evoking movements were present. In comparison, the stimulation was switched on for 12.71 ± 7.06% of the time when the patients were at rest and tremor-free. Compared with continuous stimulation, a similar amount of tremor suppression was achieved while only delivering 36.62 ± 13.49% of the energy used in continuous stimulation.

Conclusions: The results suggest that responsive thalamic stimulation for essential tremor based on tremor-provoking movement detection can be achieved without any requirement for external sensors or additional electrocorticography strips. Further research is required to investigate whether the decoding model is stable across time and generalizable to the variety of activities patients may engage with in everyday life. © 2021 The Authors. Movement Disorders published by Wiley Periodicals LLC on behalf of International Parkinson and Movement Disorder Society.

Keywords: closed-loop deep brain stimulation; essential tremor; movement decoding; thalamic local field potential.


Figures

FIG. 1
FIG. 1
Deep brain stimulation (DBS) electrode localization and schematic of the real‐time closed‐loop DBS for essential tremor based on simultaneous measurements of ventral intermediate nucleus (VIM) and zona incerta (ZI) local field potentials (LFPs). (A) Three‐dimensional reconstruction in coronal view (upper image) and sagittal view (lower image) of all recorded DBS leads localized in standard space using Lead‐DBS software. Electrodes in the right hemisphere were mirrored and are shown from the left hemisphere. (B) Features in time and frequency domains are extracted from bipolar LFPs recorded from VIM‐ZI thalamus. If the current status of the stimulator is off and voluntary movement or tremor‐provoking posture is detected (i.e., output 1), the stimulator would be switched on. If the current status of the stimulator is on and no voluntary movement and tremor‐provoking posture is detected (i.e., output 0), the stimulator would be switched off. [Color figure can be viewed at wileyonlinelibrary.com]
FIG. 2
FIG. 2
Offline decoding results using single bipolar local field potentials (LFPs) measured from contacts neighbouring the contact used for stimulation. (A) Average power spectra density (PSD) of thalamic LFPs during movements, posture holding, and rest when there was no stimulation. (B) Average PSD of thalamic LFPs during movements, posture holding, and rest when there was continuous stimulation at 130 Hz. (C) Decoding results for voluntary movement when there was no stimulation. (D) Voluntary movement when high‐frequency stimulation was switched on. (E) Tremor‐provoking posture when there was no stimulation. (F) Tremor‐provoking posture decoding when high‐frequency stimulation was switched on. Plots on the left show the receiver operating characteristic (ROC) curves of the cross‐validation with support vector machine (SVM) in different patients (different colors show results from different participants). Plots on the right show the cross‐validation area under the ROC curves (AUCs) of different classification methods. LR, logistic regression; LDA, linear discriminant analysis; DT, decision tree; NB, naïve Bayes; HELM, hierarchical extreme learning machine; KNN, k‐nearest neighbors algorithm. [Color figure can be viewed at wileyonlinelibrary.com]
FIG. 3
FIG. 3
Online results of adaptive deep brain stimulation (DBS) triggered by detection of voluntary movements and/or tremor‐provoking posture. (A) An example of voluntary movement decoding results in patient ET4. The upper panel shows the acceleration signal with increased value indicating voluntary movements in black and the online decoding results in red with 1 and 0 for with and without movement, respectively. The middle panel shows the filtered local field potentials (LFPs) with prominent artefacts when the DBS was switched on. The bottom panel shows the power spectra of bipolar ventral intermediate nucleus‐zona incerta (VIM‐ZI) thalamic LFP signal. The red and white bands in the figure indicate stimulation artefacts at 130 Hz and subharmonic when stimulation was switched on. (B) Averaged accuracy, true‐positive rate (TPR), false‐positive rate (FPR), and false‐negative rate (FNR) of voluntary movement decoding during online adaptive DBS tests across six patients. (C) Duration distribution of all false‐negative responses (events when the voluntary movements were not detected and trigged the switching on of the DBS). (D) An example of tremor‐provoking posture decoding and DBS control in patient ET4. The upper panel shows the electromyography (EMG) signal in black with increased value indicating tremor‐provoking posture maintaining. The middle panel shows the filtered LFPs with prominent artefacts when the DBS was switched on. The lower panel shows the power spectra quantified using one bipolar VIM‐ZI thalamic LFP signal and the black curve shows the power of tremor frequency band activities in the accelerometer measurements. (E) The reduced tremor power by adaptive DBS (A‐DBS) and continuous DBS (C‐DBS) compared with no DBS, and the saved DBS energy by A‐DBS compared with C‐DBS. [Color figure can be viewed at wileyonlinelibrary.com]
FIG. 4
FIG. 4
Detecting tremor using local field potentials (LFPs) (patient ET3). (A) An example of tremor developing (shown as increased tremor frequency band activities in accelerometer measurements) at around 5 seconds after the patient raised both arms (at t = 0, detected based on increased electromyography [EMG] activities). (B) Averaged power spectra across all trials of one bipolar ventral intermediate nucleus‐zona incerta (VIM‐ZI) thalamic LFP signal during posture holding, where both arms are raised at t = 0. (C) The receiver operating curves (ROCs) for decoding movement (DM, the brown curve) and decoding tremor (DT, the green curve) using support vector machine (SVM). (D) and (E) How decoder output changes with time (zero indicates movement onset) for decoding movement in (D) and decoding tremor in (E). The averaged decoding probabilities are shown in grey. The average EMG activity and tremor frequency power in accelerometer measurements are shown in red. The blue horizontal dashed line indicates a threshold for triggering DBS selected so that true‐positive detection rates were matched. The green vertical line indicates the average time point when the DBS would switch on using this threshold. The black vertical line indicates movement onset. (F) Results of tremor intensity estimation averaged across trials using single‐channel LFPs. The red and purple solid curves indicate the tremor power quantified from accelerometer and the predicted tremor power using LFP, respectively. TPR, true‐positive rate; FPR, false‐positive rate; AUC, area under the curve; SVR, support vector regression. [Color figure can be viewed at wileyonlinelibrary.com]

Comment in

References

    1. Louis ED, Ottman R. Essential Tremor. The Lancet Neurology 2005;4(2):100–110. - PubMed
    1. Plaha P, Javed S, Agombar D, O'Farrell G, Khan S, Whone A, Gill S. Bilateral caudal zona incerta nucleus stimulation for essential tremor: outcome and quality of life. J Neurol Neurosurg Psychiatry 2011;82(8):899–904. - PubMed
    1. Baizabal‐Carvallo JF, Kagnoff MN, Jimenez‐Shahed J, Fekete R, Jankovic J. The safety and efficacy of thalamic deep brain stimulation in essential tremor: 10 years and beyond. J Neurol Neurosurg Psychiatry 2014;85(5):567–572. - PubMed
    1. Koller WC, Busenbark K, Miner K, Essential Tremor Study Group . The relationship of essential tremor to other movement disorders: report on 678 patients. Ann Neurol 1994;35(6):717–723. - PubMed
    1. Flora ED, Perera CL, Cameron AL, Maddern GJ. Deep brain stimulation for essential tremor: a systematic review. Mov Disord 2010;25(11):1550–1559. - PubMed

Publication types