. 2021 Mar 10;97(3):fiab022.
doi: 10.1093/femsec/fiab022.

Soil depth matters: shift in composition and inter-kingdom co-occurrence patterns of microorganisms in forest soils

Affiliations

Soil depth matters: shift in composition and inter-kingdom co-occurrence patterns of microorganisms in forest soils

Sunil Mundra et al. FEMS Microbiol Ecol. .

Abstract

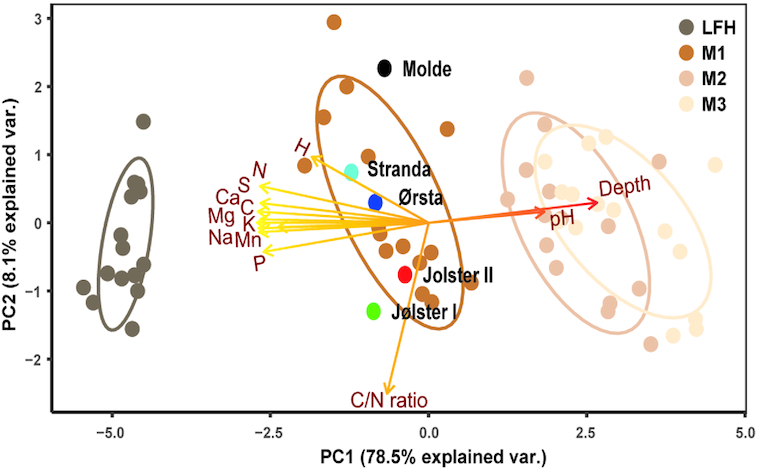
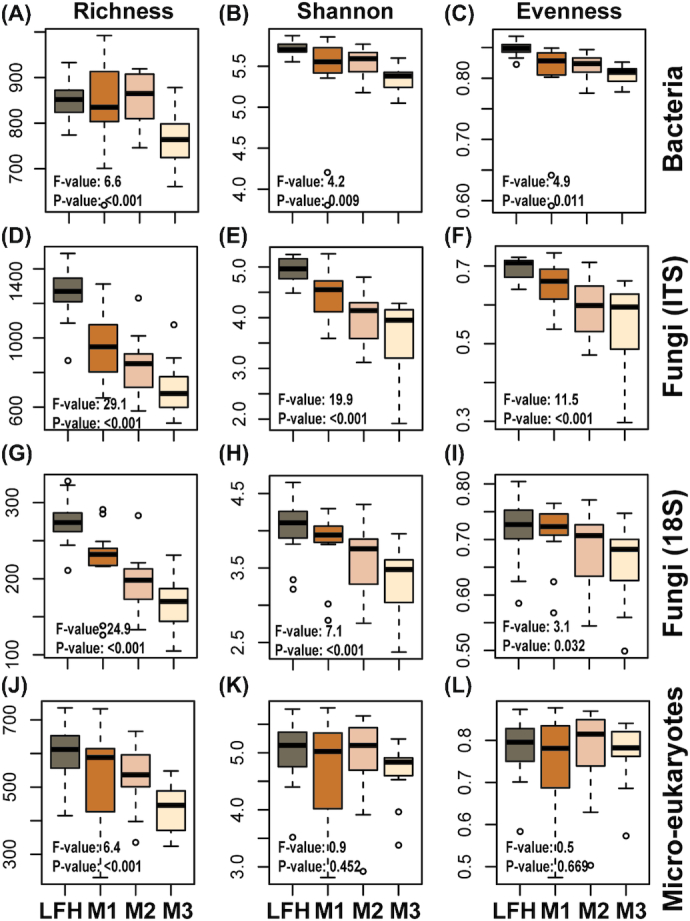
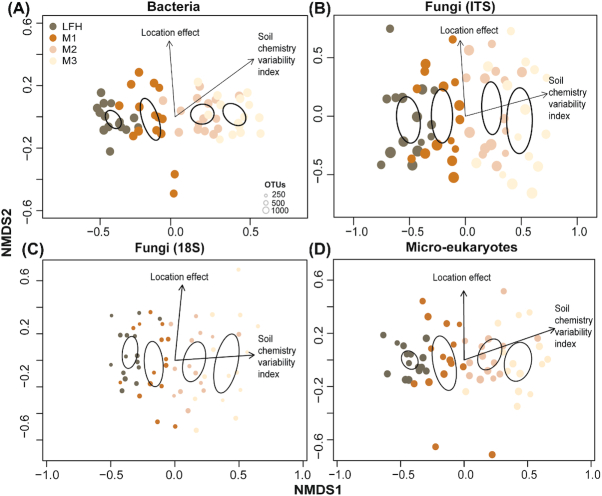
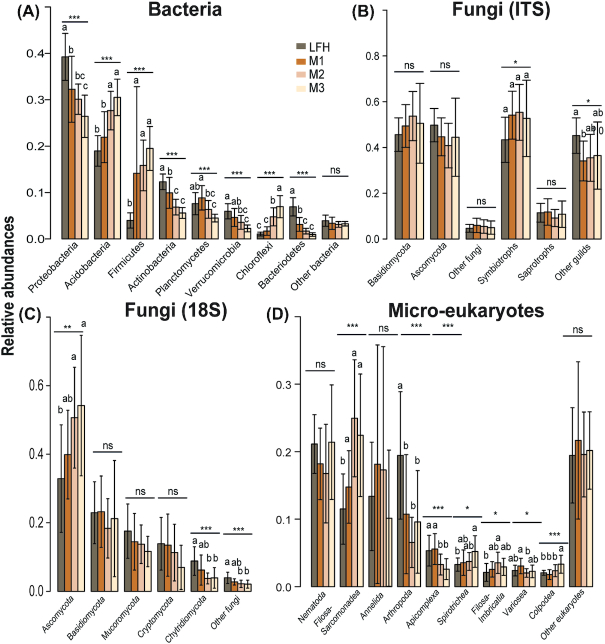
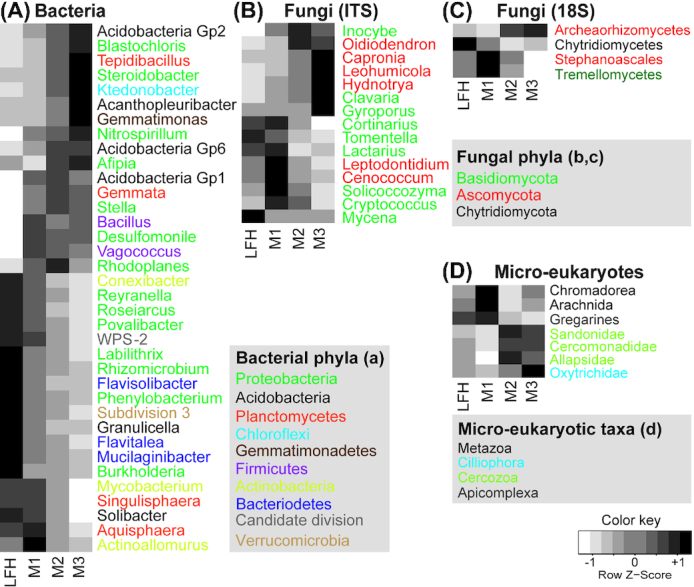
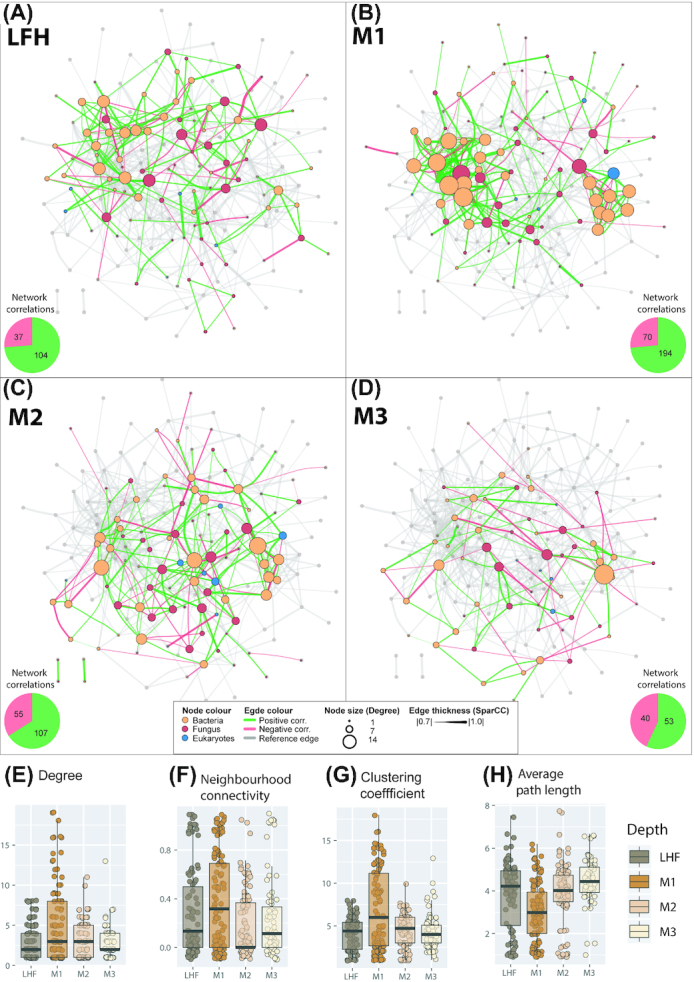
Soil depth represents a strong physiochemical gradient that greatly affects soil-dwelling microorganisms. Fungal communities are typically structured by soil depth, but how other microorganisms are structured is less known. Here, we tested whether depth-dependent variation in soil chemistry affects the distribution and co-occurrence patterns of soil microbial communities. This was investigated by DNA metabarcoding in conjunction with network analyses of bacteria, fungi, as well as other micro-eukaryotes, sampled in four different soil depths in Norwegian birch forests. Strong compositional turnover in microbial assemblages with soil depth was detected for all organismal groups. Significantly greater microbial diversity and fungal biomass appeared in the nutrient-rich organic layer, with sharp decrease towards the less nutrient-rich mineral zones. The proportions of copiotrophic bacteria, Arthropoda and Apicomplexa were markedly higher in the organic layer, while patterns were opposite for oligotrophic bacteria, Cercozoa, Ascomycota and ectomycorrhizal fungi. Network analyses indicated more intensive inter-kingdom co-occurrence patterns in the upper mineral layer (0-5 cm) compared to the above organic and the lower mineral soil, signifying substantial influence of soil depth on biotic interactions. This study supports the view that different microbial groups are adapted to different forest soil strata, with varying level of interactions along the depth gradient.

Keywords: Betula pubescens; boreal birch forest; co-occurrences patterns; metabarcoding; microbial communities; microbial interactions.


Figures

Figure 1.
Figure 1.
Principal component analysis (PCA) of soil chemistry data along depth gradient. Samples were collected from five different location (Molde, Stranda, Ørsta, Jølster I and Jølster II), along forest floor (LFH) and three mineral soil layers: 0–5 cm (M1), 5–15 cm (M2), 15–30 cm (M3)). The first PC axis (PC1) score of each plot (shown with dark brown to light brown colored circles) was used as a ‘soil chemistry variability index’, as it reflects variation related to the soil nutrients. The second PC axis (PC2) score of each plot was considered as ‘location effect’ (it reflects variation in C: N ratio, related to sampling locations). Ellipses indicate 95% confidence intervals around centroids for each soil depth and black, skyblue, darkblue, red and green colored circles indicate centroid for each sampling location. Following soil chemistry data was used in the analysis: total carbon (C%), total nitrogen (N%), C/N ratio, soil pH and exchangeable elements H, P, Mn, Ca, Mg, Na, S and K.
Figure 2.
Figure 2.
Boxplots showing soil depth related diversity patterns for different microbial groups. Diversity measure such as richness, Shannon index and evenness are shown for bacteria (16S; A–C), fungi (ITS: d-f; 18S: G–I), and micro-eukaryotes (18S: K–L) are shown. Samples were collected along a soil depth gradient (forest floor (LFH) and three mineral soil layers: 0–5 cm (M1), 5–15 cm (M2), 15–30 cm (M3)) from natural birch forest. Statistically significant differences among soil depth were analysed using ANOVA and Tukey's post-hoc test.
Figure 3.
Figure 3.
Nonmetric multidimensional scaling (NMDS) plots displaying the community structure of the different microbial groups. Bacterial (A), fungal (ITS: B; 18S: C) and micro-eukaryotic (D) community compositional patterns among samples from different soil depth (forest floor (LFH) and three mineral soil layers: 0–5 cm (M1), 5–15 cm (M2), and 15–30 cm (M3)), as revealed by NMDS ordination analysis. The ordination plots are based on all Operational Taxonomic Units (OTUs) present in the respective microbial groups. The stress value for NMDS ordination was 0.104 for bacteria, 0.166 for fungi (ITS), 0.193 for fungi (18S) and 0.135 for micro-eukaryotes. Ellipses indicate 95% confidence intervals around centroids for each soil depth. Arrows point in the direction of maximum increase of the variables and size of circle indicates number of OTUs richness. All variables and factor shown in the panels had significant effects (P < 0.05) on the ordination configuration.
Figure 4.
Figure 4.
Barplots displaying abundances distribution of the different microbial taxa (phyla). Plots for relative abundances of the bacterial (A), fungal (ITS: B; 18S: C), and micro-eukaryotic (D) taxa with soil depth (forest floor (LFH) and three mineral soil layers: 0–5 cm (M1), 5–15 cm (M2), and 15–30 cm (M3)) are shown here. Statistically significant differences among soil depth was analysed using ANOVA and Tukey´s post-hoc test. Note the significant difference in distribution of fungal groups (Ascomycota) as revealed by the 18S rRNA gene markers (C) but pattern absent while using ITS (B).
Figure 5.
Figure 5.
Hierarchical heatplots illustrating abundances distribution of the different microbial taxa (genus or class level). Plots for bacterial (A), fungal (ITS: B; 18S: C) and micro-eukaryotic (D) taxa with different soil depth (forest floor (LFH) and three mineral soil layers: 0–5 cm (M1), 5–15 cm (M2), and 15–30 cm (M3)) are shown here. All taxa shown in the plots are analysed using ANOVA and Tukey´s post-hoc test and differ significantly (P <<0.05i>) in abundances among soil depth. Colour gradients in the plots from white to grey to black indicates increasing dominance of the taxonomic groups in particular soil depth. Different color in bacterial and fungal genus name indicates respective phyla and in case of micro-eukaryotes color represent different taxa at higher taxonomic level. Different colors are used to indicate phyla for bacteria, fungi and micro-eukaryotes
Figure 6.
Figure 6.
Inter-kingdom correlation patterns of bacterial, fungal and eukaryotic genera. The network is based on a SparCC correlation analysis for the forest floor (LFH) (A) and mineral soil layers 0–5 cm (M1) (B), 5–15 cm (M2) (C) and 15–30 cm (M3) (D). Pie charts from each panel represents number of total correlations (positive as green and negative as red) in Network from each depth. Positive correlations (SparCC > 0.7, P < 0.05) are drawn as green edges and negative correlations (SparCC < 0.7, P < 0.05) are drawn as red edges. Nodes represents genera and are coloured according to taxonomic group: bacteria in orange, fungi in red and micro-eukaryotes in blue. The size of a node is proportional to connection it forms with other nodes. The thickness of the connection between two nodes is proportional to the value of correlation coefficients. The network in transparent grey is a reference network combining the correlations for all four depth layers. Boxplots (F–H) show the upper and lower quartile, and the average value for important network statistics for all four depths: degree (E), neighbourhood connectivity (F), clustering coefficient (G) and average path length (H). The degree of a genus is the number of co-occurrences it has with other genera (i.e. the number of connections (edges) formed by a node to other nodes). The neighbourhood connectivity is the average connectivity (correlations) of neighbours of a given node (i.e. nodes correlated to a given node can themselves be correlated to other nodes). The clustering coefficient describes whether the network can be sectioned into clusters of highly interconnected organisms. Highly clustered networks are those that contain groups of statistically associated organisms. A high clustering coefficient is an indication of a high degree of interactions and associations. The Average path length is the distance (counted as number of edges) between all pairs of associated genera (divided by the number of genera in the network. A low average path length indicates that most species in the network are connected through a few intermediates’ species.

References

    1. Anderson IC, Campbell CD, Prosser JI.. Potential bias of fungal 18S rDNA and internal transcribed spacer polymerase chain reaction primers for estimating fungal biodiversity in soil. Environ Microbiol. 2003;5:36–47. - PubMed
    1. Anderson IC, Genney DR, Alexander IJ.. Fine-scale diversity and distribution of ectomycorrhizal fungal mycelium in a Scots pine forest. New Phytol. 2014;201:1423–30. - PubMed
    1. Asplund J, Kauserud H, Ohlson Met al. . Spruce and beech as local determinants of forest fungal community structure in litter, humus and mineral soil. FEMS Microbiol Ecol. 2018;95:fiy232. - PubMed
    1. Bahram M, Hildebrand F, Forslund SKet al. . Structure and function of the global topsoil microbiome. Nature. 2018;560:233–7. - PubMed
    1. Baldrian P, Kolařík M, Štursová Met al. . Active and total microbial communities in forest soil are largely different and highly stratified during decomposition. ISME J. 2012;6:248–58. - PMC - PubMed

Publication types