. 2021 May;37(5):623-640.
doi: 10.1007/s12264-021-00632-9. Epub 2021 Feb 6.

Projections from D2 Neurons in Different Subregions of Nucleus Accumbens Shell to Ventral Pallidum Play Distinct Roles in Reward and Aversion

Affiliations

Projections from D2 Neurons in Different Subregions of Nucleus Accumbens Shell to Ventral Pallidum Play Distinct Roles in Reward and Aversion

Yun Yao et al. Neurosci Bull. 2021 May.

Abstract

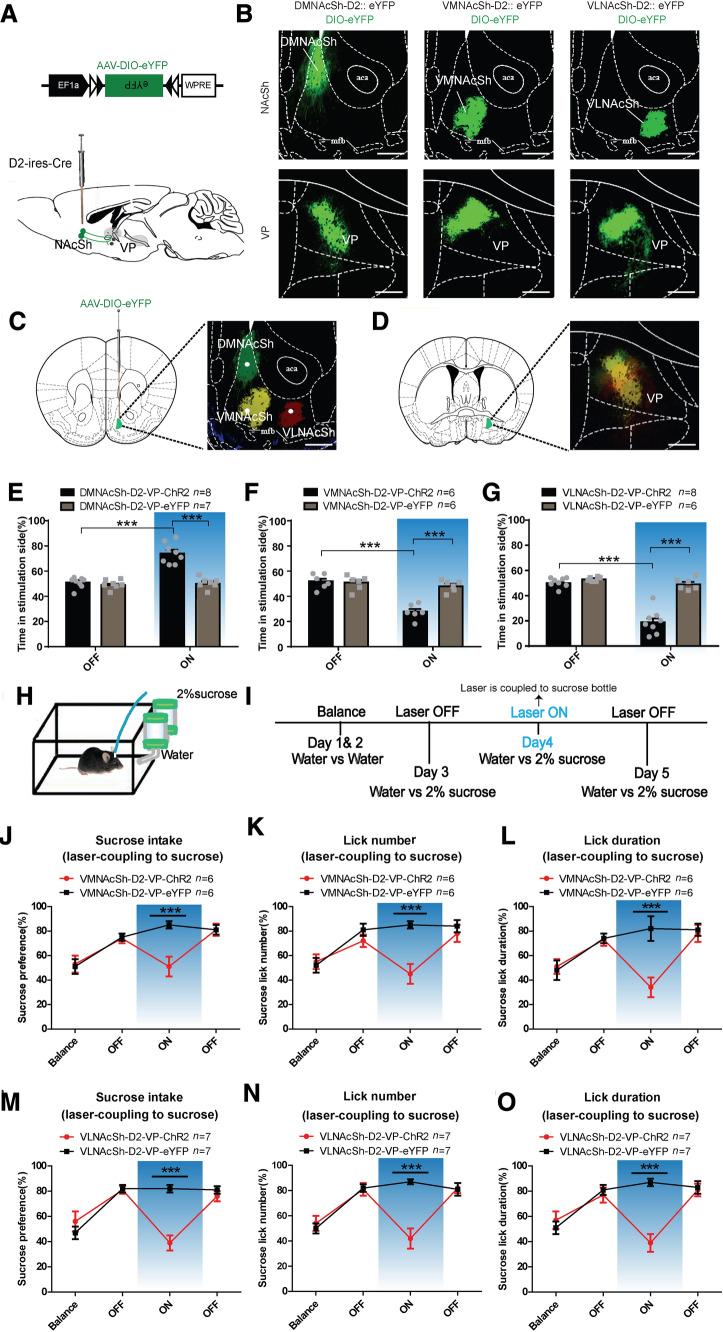
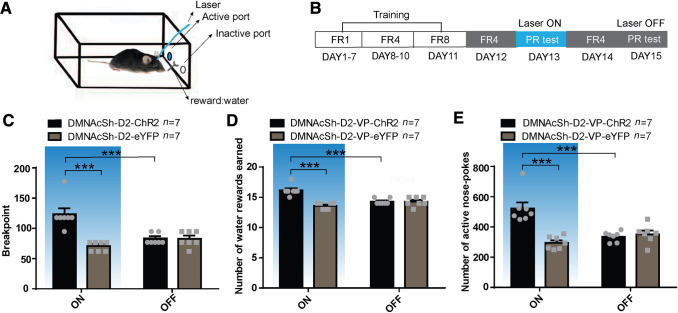
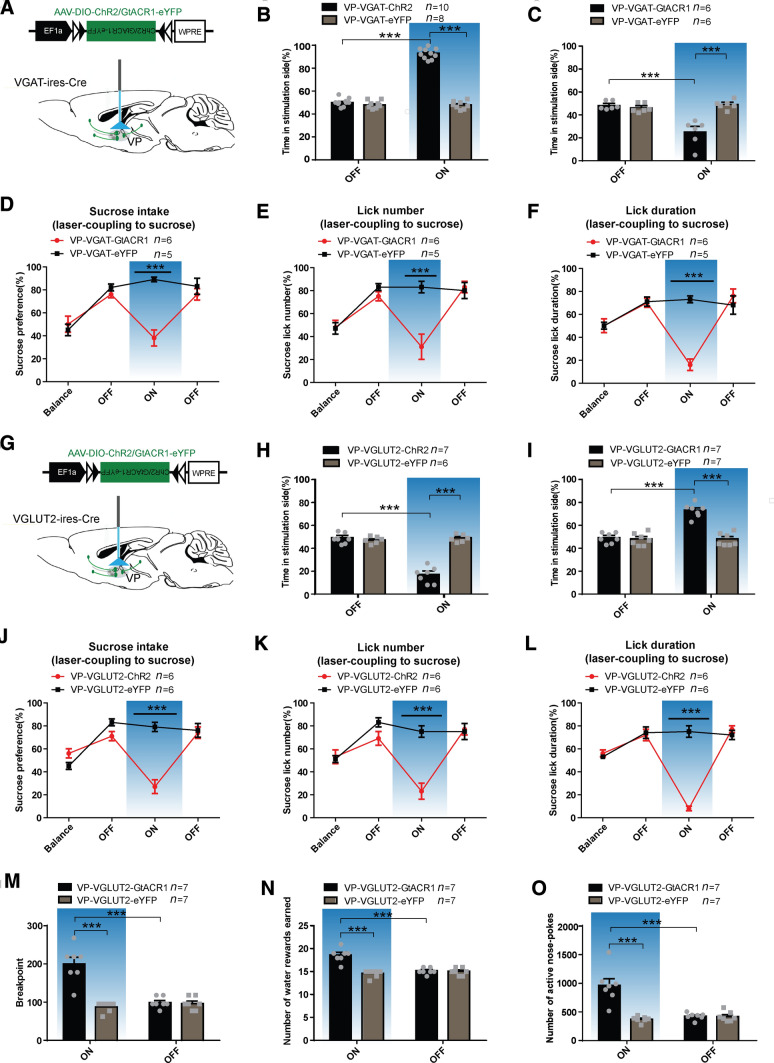
The nucleus accumbens shell (NAcSh) plays an important role in reward and aversion. Traditionally, NAc dopamine receptor 2-expressing (D2) neurons are assumed to function in aversion. However, this has been challenged by recent reports which attribute positive motivational roles to D2 neurons. Using optogenetics and multiple behavioral tasks, we found that activation of D2 neurons in the dorsomedial NAcSh drives preference and increases the motivation for rewards, whereas activation of ventral NAcSh D2 neurons induces aversion. Stimulation of D2 neurons in the ventromedial NAcSh increases movement speed and stimulation of D2 neurons in the ventrolateral NAcSh decreases movement speed. Combining retrograde tracing and in situ hybridization, we demonstrated that glutamatergic and GABAergic neurons in the ventral pallidum receive inputs differentially from the dorsomedial and ventral NAcSh. All together, these findings shed light on the controversy regarding the function of NAcSh D2 neurons, and provide new insights into understanding the heterogeneity of the NAcSh.

Keywords: Aversion; D2 neurons; Motivation; Nucleus accumbens shell; Reward; Ventral pallidum.


Conflict of interest statement

All authors claim that there are no conflict of interest.

Figures

Fig. 1
Fig. 1
Activation of D2 neuronal terminals from NAcSh subregions to the VP differentially induces preference and aversion. A Schematic of the design of the recombinant AAV-DIO-eYFP virus and injection sites to trace the projection targets of D2 neurons in different subregions of the NAcSh. B Images showing eYFP expression in DMNAcSh (upper left), VMNAcSh (upper middle) and VLNAcSh (upper right) and their projection targets in the VP (lower panels) in D2-Cre mice (scale bars, 200 μm). C, D Images showing eYFP expression in the DMNAcSh (green), VMNAcSh (yellow); and VLNAcSh (red) (C); NAcSh D2 neurons from different subregions all project to the VP with overlapping target areas (D). The green, yellow and red signals are pseudo-colors. Scale bars, 200 μm. The merged images are from multiple mice. E DMNAcSh-D2-ChR2 mice spend more time on the photostimulation-paired side (ChR2: P ON vs OFF < 0.0001; P ChR2 vs eYFP (ON) < 0.0001; n = 8). F VMNAcSh-D2-ChR2 mice spend less time on the photostimulation-paired side (ChR2: ON vs OFF P < 0.0001; ChR2 vs eYFP (ON) P < 0.0001; n = 6). G VLNAcSh-D2-ChR2 mice spend less time on the photostimulation-paired side (ChR2: ON vs OFF P < 0.0001; ChR2 vs eYFP (ON) P < 0.0001; n = 8). H, I Schematic (H) and the time line (I) of the optogenetic two-bottle preference test. JL Coupling photostimulation of VP-projecting VMNAcSh D2 neurons with sucrose decreases the probability of sucrose intake (J), lick number (K), and lick duration (L) (sucrose intake: P = 0.0002; lick number: P < 0.0001; lick duration: P < 0.0001; n = 6). MO Coupling photostimulation of VP-projecting VLNAcSh D2 neurons with sucrose decreases the probability of sucrose intake (M), lick number (N), and lick duration (O) (sucrose intake: P < 0.0001; lick number: P < 0.0001; lick duration: P < 0.0001; n = 7). Data represented as the mean ± SEM. All significance values were tested by two-way ANOVA with Sidak’s multiple comparisons test. ***P < 0.001.
Fig. 2
Fig. 2
Optogenetic activation of VP-projecting DMNAcSh D2 neurons enhances motivation for reward. A, B Schematic of progressive-ratio (PR) test. C DMNAcSh-D2-ChR2 mice show a higher breakpoint during photostimulation in the PR test (ChR2: ON vs OFF P = 0.0005; ChR2 vs eYFP (ON) P < 0.0001, n = 7). D DMNAcSh-D2-ChR2 mice earn more water rewards during photostimulation in the PR test (ChR2: ON vs OFF P = 0.0004; ChR2 vs eYFP (ON) P < 0.0001; n = 7). E DMNAcSh-D2-ChR2 mice show more nose-pokes on the active port during photostimulation in the PR test (ChR2: ON vs OFF P = 0.0002; ChR2 vs eYFP (ON) P < 0.0001; n = 7). Data represented as the mean ± SEM. All significance values were tested by two-way ANOVA with Sidak’s multiple comparisons test. ***P < 0.001.
Fig. 3
Fig. 3
VGAT and VGLUT2 neurons in the VP receive different inputs from different subregions of the NAcSh. A Schematics of the experimental design for cell-type-specific rabies-mediated retrograde tracing. B, C Images from a VGAT-Cre mouse showing AAV-DIO-EGFP-TVA and SADΔG-dsRed (Enva) expression in VP VGAT neurons (B), and SADΔG-dsRed (Enva) labeling of neurons as inputs to VP VGAT neurons in the NAcSh (C). Green, EGFP-TVA; orange, SADΔG-dsRed. Scale bars, 200 μm in B, 500 μm in C. D, E Images from a VGLUT2-Cre mouse showing AAV-DIO-EGFP-TVA and SADΔG-dsRed (Enva) expression in VP VGLUT2 neurons (D), and SADΔG-dsRed (Enva) labeling of neurons as inputs to VP VGLUT2 neurons in the NAcSh (E). Green, EGFP-TVA; orange, SADΔG-dsRed. Scale bars, 200 μm in D, 500 μm in E. F Proportions of neurons as inputs to VP VGAT neurons from distinct subregions within the NAcSh (proportion = number of neurons as inputs/DAPI+ in each zone in the NAcSh. DM vs VM P = 0.0404, DM vs VL P = 0.0035, VM vs VL P = 0.5518; one-way ANOVA; n = 9). G Proportions of neurons as inputs to VP VGLUT2 neurons from distinct subregions within the NAcSh (DM vs VM P = 0.0479, DM vs VL P = 0.0047, VM vs VL P = 0.0321; one-way ANOVA; n = 4). H Ratios of D1 to D2 neurons in NAcSh as inputs to VP VGAT and VGLUT2 neurons (n = 3). I, J Examples of RV virus-labeled neurons as inputs to VP VGAT and VGLUT2, and FISH for D1 and D2 markers in NAcSh. I Green, inputs to VP VGAT neurons; red, FISH for D1 markers in a VGAT-Cre mouse. J Green, inputs to VP VGLUT2 neurons; red, FISH for D2 markers in a VGLUT2-Cre mouse. Blue, green, and red arrows indicate cells that are DAPI, eYFP-positive, and in situ hybridization-positive, respectively; orange arrows show overlapping signals (blue, green, and red). Scale bars, 50 μm. Data represented as the mean ± SEM.
Fig. 4
Fig. 4
Optogenetic activation or inhibition of VGAT and VGLUT2 neurons in the VP induces preference and aversion. A Schematic of the design of the recombinant AAV-DIO-ChR2/GtACR1-eYFP virus and injection site to simulate/inhibit VP VGAT neurons in VGAT-cre mice. B VP-VGAT-ChR2 mice spend more time in the photostimulation-paired chamber (ChR2: ON vs OFF P < 0.0001; ChR2 vs eYFP (ON) P < 0.0001; n = 10). C VP-VGAT-GtACR1 mice spend less time in the photoinhibition-paired chamber (GtACR1: ON vs OFF P = 0.0002; ChR2 vs eYFP (ON) P = 0.0001; n = 6). D, F Coupling photoinhibition of VP VGAT neurons to sucrose decreases the probability of sucrose intake (D), lick number (E), and lick duration (F) (sucrose intake: P < 0.0001; lick number: P < 0.0001; lick duration: P < 0.0001; n = 6). G Schematic of the design of the recombinant AAV-DIO–ChR2/GtACR1-eYFP virus and injection site to stimulate/inhibit VP VGLUT2 neurons in VGLUT2-cre mice. H VGLUT2-ChR2 mice spend less time in the photostimulation-paired chamber (ChR2: ON vs OFF P < 0.0001; ChR2 vs eYFP (ON) P < 0.0001; n = 7). I VP-VGLUT2-GtACR1 mice spend more time in the photoinhibition-paired chamber (GtACR1: ON vs OFF P < 0.0001; ChR2 vs eYFP (ON) P < 0.0001; n = 7). J, L Coupling photostimulation of VP VGLUT2 neurons to sucrose decreases the probability of sucrose intake (J), lick number (K), and lick duration (L) (sucrose intake: P < 0.0001; lick number: P < 0.0001; lick duration: P < 0.0001; n = 6). M VGLUT2-GtACR1-VP mice show a higher breakpoint during photoinhibition in the progressive ratio (PR) test (GtACR1: ON vs OFF P < 0.0001; ChR2 vs eYFP (ON) P < 0.0001; n = 7). N VGLUT2-GtACR1-VP mice earn more water rewards during photoinhibition in the PR test (GtACR1: ON vs OFF P < 0.0001; ChR2 vs eYFP (ON) P < 0.0001; n = 7). O VGLUT2-GtACR1-VP mice show more nose-pokes on the active port during photoinhibition in the PR test (GtACR1: ON vs OFF P < 0.0001; ChR2 vs eYFP (ON) P < 0.0001; n = 7). Data represented as the mean ± SEM. All significance values were tested by two-way ANOVA with Sidak’s multiple comparisons test. ***P < 0.001.
Fig. 5
Fig. 5
Projections from D2 neurons in different NAcSh subregions to the VP differentially modulate movement speed. A Timeline of the open field test to assess movement speed. B Photostimulation of VP-projecting DMNAcSh D2 neurons has no effect on movement speed during the ON epoch in the open field test (ChR2: ON vs pre-OFF P = 0.9989, ON vs post-OFF P = 0.8554; ChR2 vs eYFP (ON) P = 0.9996; n = 6). C Photostimulation of VP-projecting VMNAcSh D2 neurons increases movement speed during the ON epoch in the open field test (ChR2: ON vs pre-OFF P = 0.0019, ON vs post-OFF P < 0.0001; ChR2 vs eYFP (ON) P < 0.0001; n = 6). D Photostimulation of VP-projecting VLNAcSh D2 neurons decreases movement speed during the ON epoch in the open field test (ChR2: ON vs pre-OFF P = 0.0131, ON vs post-OFF P = 0.0008; ChR2 vs eYFP P = 0.0063; n = 7). E Photostimulation of VGLUT2 neurons in the VP increases movement speed during the ON epoch in the open field test (ChR2: ON vs pre-OFF P < 0.0001, ON vs post-OFF P < 0.0001; ChR2 vs eYFP (ON) P < 0.0001; n = 6). F Photostimulation of VGAT neurons in VP has no effect on movement speed during the ON epoch in the open field test (ChR2: ON vs pre-OFF P > 0.9999, ON vs post-OFF P = 0.9998, n = 6; ChR2 vs eYFP (ON) P = 0.2218; n = 6). G Photoinhibition of VGLUT2 neurons in VP has no effect on movement speed during the ON epoch in the open field test (GtACR1: on vs pre-OFF P = 0. 9894, ON vs post-OFF P > 0.9999; ChR2 vs eYFP(ON) P = 0.9938; n = 7). H Photoinhibition of VGAT neurons in VP shows an increase in movement speed during the ON epoch in the open field test. (GtACR1: ON vs pre-OFF P < 0.0001, ON vs post-OFF P < 0.0001; ChR2 vs eYFP (ON) P < 0.0001; n = 6). Data are presented as the mean ± SEM. All significance values were tested by two-way ANOVA with Sidak’s multiple comparisons test. *P < 0.05; **P < 0.01; ***P < 0.001; ns, P > 0.05, not significant.
Fig. 6
Fig. 6
D2 neurons from distinct subregions of the NAcSh receive different inputs from the whole brain. For all the graphs, proportion of total inputs is defined as the percentage of the number of labeled neurons in designated brain areas to the total number of labeled neurons in the whole brain. All abbreviations refer to the standard mouse brain atlas [43]. A Percentages of inputs to D2 neurons in different NAcSh subregions from major brain structures. B Percentages of inputs to D2 neurons in different NAcSh subregions from the anterior cortex. C Percentages of inputs to D2 neurons in different NAcSh subregions from thalamic nuclei. D Percentages of inputs to D2 neurons in different NAcSh subregions from the amygdala and adjacent nuclei. E Percentages of inputs to D2 neurons in different NAcSh subregions from olfactory areas. F Percentages of inputs to D2 neurons in different NAcSh subregions from the hippocampus and posterior cortex. G Representative coronal sections showing labeling of monosynaptic inputs to the DMNAcSh, VMNAcSh, and VLNAcSh. Only the side ipsilateral to the injection site is shown. Scale bar, 1000 μm. Data are presented as the mean ± SEM. All significance values were tested by a mixed model. n = 4 mice for DMNAcSh; n = 5 for VMNAcSh; n = 4 for VLNAcSh, *P < 0.05; **P < 0.01; ***P < 0.001.

References

    1. Everitt BJ, Robbins TW. Neural systems of reinforcement for drug addiction: from actions to habits to compulsion. Nat Neurosci. 2005;8:1481. doi: 10.1038/nn1579. - DOI - PubMed
    1. Castro DC, Berridge KC. Opioid hedonic hotspot in nucleus accumbens shell: mu, delta, and kappa maps for enhancement of sweetness “liking” and “wanting”. J Neurosci. 2014;34:4239–4250. doi: 10.1523/JNEUROSCI.4458-13.2014. - DOI - PMC - PubMed
    1. Kravitz AV, Tye LD, Kreitzer AC. Distinct roles for direct and indirect pathway striatal neurons in reinforcement. Nat Neurosci. 2012;15:816. doi: 10.1038/nn.3100. - DOI - PMC - PubMed
    1. Gerfen CR, Surmeier DJ. Modulation of striatal projection systems by dopamine. Annu Rev Neurosci. 2011;34:441–466. doi: 10.1146/annurev-neuro-061010-113641. - DOI - PMC - PubMed
    1. Kupchik YM, Robyn MB, Jasper AH, Mary KL, Danielle JS, Peter WK. Coding the direct/indirect pathways by D1 and D2 receptors is not valid for accumbens projections. Nat Neurosci. 2015;18:1230. doi: 10.1038/nn.4068. - DOI - PMC - PubMed