Review
. 2021 Jun;24(2):131-142.
doi: 10.1007/s40477-021-00563-1. Epub 2021 Feb 6.

Gallbladder polyps ultrasound: what the sonographer needs to know

Affiliations
Review

Gallbladder polyps ultrasound: what the sonographer needs to know

G Cocco et al. J Ultrasound. 2021 Jun.

Abstract

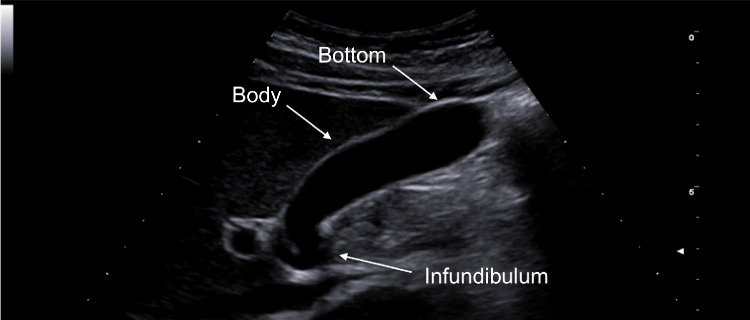
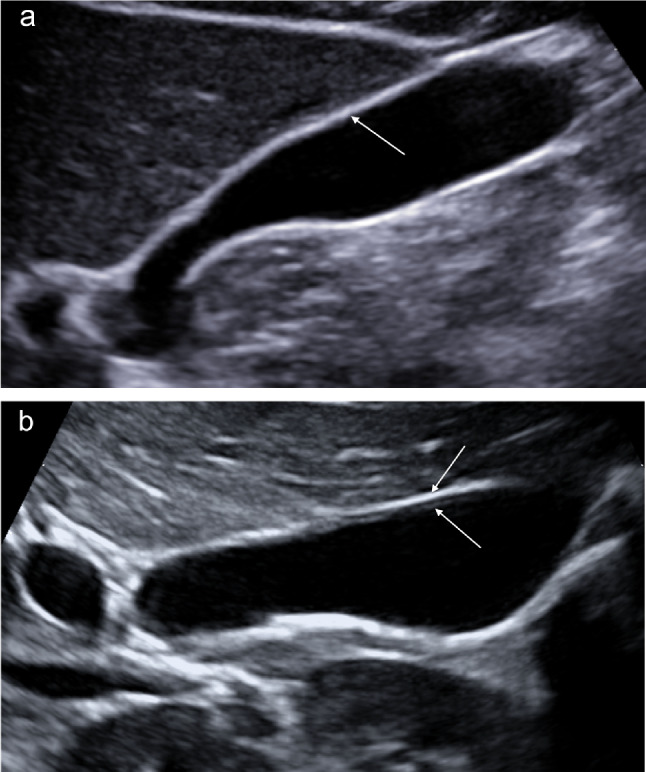
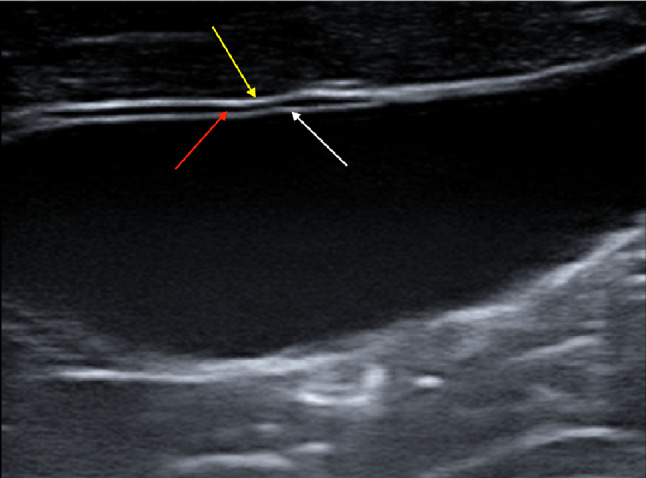
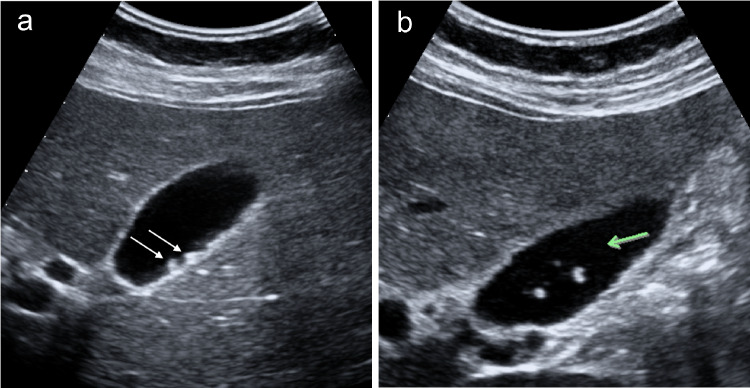
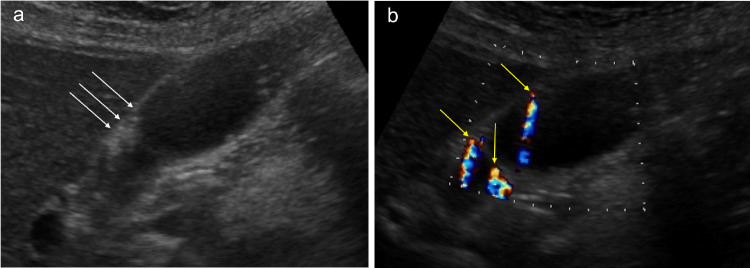
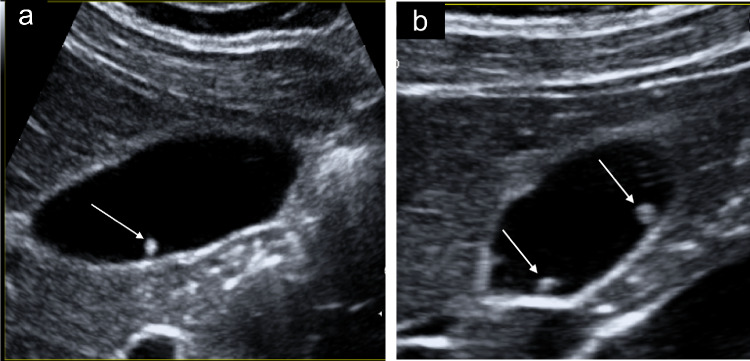
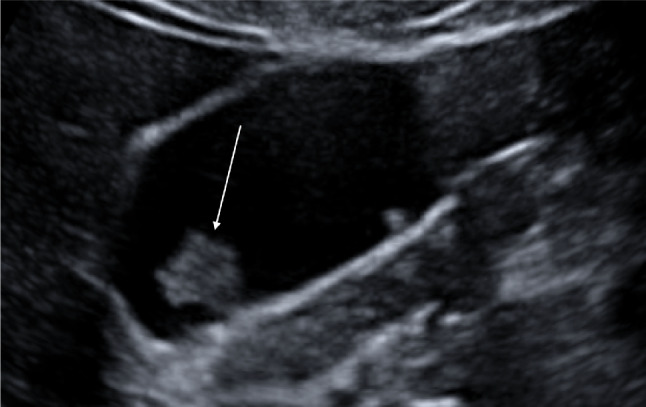
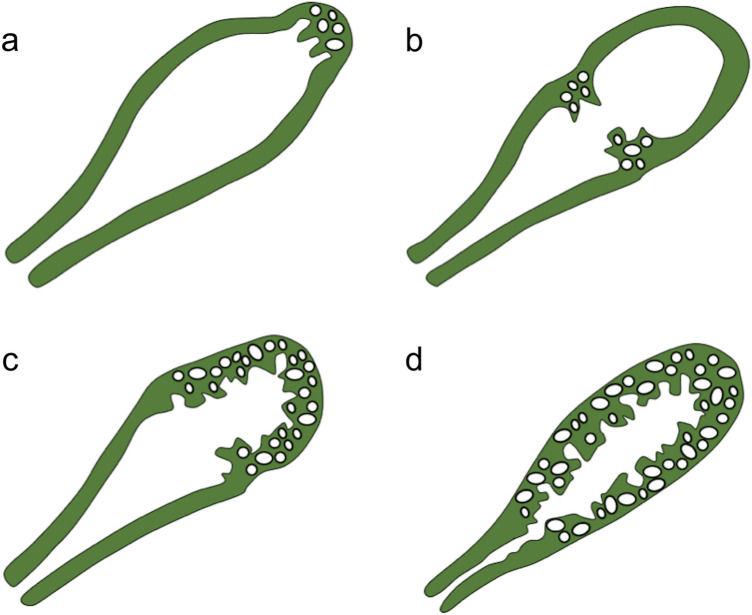
Gallbladder polyps are protuberances of the gallbladder wall projecting into the lumen. They are usually incidentally found during abdominal sonography or diagnosed on histopathology of a surgery specimen, with an estimated prevalence of up to 9.5% of patients. Gallbladder polyps are not mobile and do not demonstrate posterior acoustic shadowing; they may be sessile or pedunculated. Gallbladder polyps may be divided into pseudopolyps and true polyps. Pseudopolyps are benign and include cholesterolosis, cholesterinic polyps, inflammatory polyps, and localised adenomyomatosis. True gallbladder polyps can be benign or malignant. Benign polyps are most commonly adenomas, while malignant polyps are adenocarcinomas and metastases. There are also rare types of benign and malignant true gallbladder polyps, including mesenchymal tumours and lymphomas. Ultrasound is the first-choice imaging method for the diagnosis of gallbladder polyps, representing an indispensable tool for ensuring appropriate management. It enables limitation of secondary level investigations and avoidance of unnecessary cholecystectomies.

Keywords: Gallbladder; Polyps; Ultrasound.


Conflict of interest statement

The authors declare that they have no conflict of interest.

Figures

Fig. 1
Fig. 1
Sonography image depicts a representation of the gallbladder: infundibulum, body, and bottom (white arrows)
Fig. 2
Fig. 2
a Conventional transabdominal sonography image using a convex probe (1–5 MHz) shows a single layer (white arrow). b Conventional transabdominal sonography image using a convex probe (1–5 MHz) shows two layers of the gallbladder wall (white arrows)
Fig. 3
Fig. 3
Linear probe using high-frequency transducers can better visualise the gallbladder wall layers. The image depicts three layers of the gallbladder wall including the innermost hyperechoic layer (white arrow), the middle thin hypoechoic layer (red arrow), and the outermost hyperechoic layer (yellow arrow)
Fig. 4
Fig. 4
a The ultrasound images show fine deposits of biliary sludge that may simulate gallbladder wall polyps (white arrows). b It is useful to carry out a dynamic ultrasound of the gallbladder by changing the patient's decubitus (green arrow)
Fig. 5
Fig. 5
a Sonography image depicts parietal hyperechoic multiple foci on the gallbladder body and the infundibulum wall, generating comet-tail artifacts on B-mode (white arrows). b Sonography image depicts parietal hyperechoic multiple foci on the gallbladder body generating twinkling artifacts on the colour Doppler exam (yellow arrows)
Fig. 6
Fig. 6
a The sonographic image shows solitary cholesterol polyps, homogeneous, pedunculated, without posterior acoustic shadowing, smaller than 1 cm, more hyperechoic than the liver parenchyma (white arrow). b The sonographic image shows two cholesterol polyps, homogeneous, pedunculated, without posterior acoustic shadowing, smaller than 1 cm, more hyperechoic than the liver parenchyma (white arrows)
Fig. 7
Fig. 7
The sonographic image shows an inflammatory polyp (white arrow) that appears with a higher echogenicity than the liver parenchyma, homogeneous, pedunculated, and less than 10 mm in diameter
Fig. 8
Fig. 8
Gallbladder adenomyomatosis patterns: a localised, b annular, c segmental, and d diffuse
Fig. 9
Fig. 9
a The sonographic images show the localised type of GA as a focal thickening localised in the fundus. The thickening projects into the lumen and appears hypoanechoic with hyperechoic cholesterol crystals generating comet-tail reverberation artifacts (white arrows). b The sonographic images show the localised type of GA as a focal thickening localised in the fundus. The thickening projects into the lumen and appears hypoanechoic with hyperechoic cholesterol crystals generating twinkling artifacts on the colour Doppler exam (yellow arrow)
Fig. 10
Fig. 10
a Ultrasound image shows a segmental type of GA that involves a larger portion of the gallbladder wall, the bottom, and the distal third of the body. The affected part appears hypoechoic (white arrows), with hyperechoic cholesterol crystals (yellow arrows). b The hyperechoic cholesterol crystal of the segmental type of GA generating twinkling artifacts on the colour Doppler exam (red arrow). c The segmental type of GA visualised with a multifrequency linear probe (white arrow)
Fig. 11
Fig. 11
Sonography image depicts annular GA characterised by a ring-shaped (white arrow) circumferential thickening of the gallbladder wall, which usually involves the central part that divides the lumen of the gallbladder into two separate compartments and biliary sludge in the affected area (yellow arrow)
Fig. 12
Fig. 12
a The sonographic images of the diffuse adenomyomatosis type show thickening and irregularity with cholesterol crystals or calcifications along the whole gallbladder wall generating comet-tail reverberation artifacts (white arrows). b The sonographic images of the diffuse adenomyomatosis type show thickening and irregularity with cholesterol crystals or calcification along the whole gallbladder wall generating twinkling artifacts on the colour Doppler exam (yellow arrow). c The sonographic images of the diffuse adenomyomatosis type show thickening and irregularity (red arrows)
Fig. 13
Fig. 13
The ultrasound image of the adenoma of the gallbladder appears as a singular homogeneous polyp, isoechoic with the liver parenchyma and sessile
Fig. 14
Fig. 14
a Parietal fundus lesion projecting towards the lumen with a heterogeneous echostructure. b The image shows a hyper-enhanced lesion in the arterial phase. c The image shows hypo-enhancing in the venous phase
Fig. 15
Fig. 15
a The ultrasound image shows tumefactive biliary sludge that may simulate a gallbladder wall lesion. b The CEUS shows the absence of the enhancement of the tumefactive biliary sludge in the early phase

References

    1. Persley KM. Gallbladder Polyps. Curr Treat Options Gastro. 2005;8:105–108. doi: 10.1007/s11938-005-0002-3. - DOI - PubMed
    1. Wiles R, Thoeni RF, Barbu ST, et al. Management and follow-up of gallbladder polyps. Eur Radiol. 2017;27:3856–3866. doi: 10.1007/s00330-017-4742-y. - DOI - PMC - PubMed
    1. Elmasry M, Lindop D, Dunne DF, Malik H, Poston GJ, Fenwick SW. The risk of malignancy in ultrasound detected gallbladder polyps: a systematic review. Int J Surg. 2016;33:28–35. doi: 10.1016/j.ijsu.2016.07.061. - DOI - PubMed
    1. Van Breda Vriesman AC, Engelbrecht MR, Smithuis RH, et al. Diffuse gallbladder wall thickening: differential diagnosis. AJR Am J Roentgenol. 2007;188:495–501. doi: 10.2214/AJR.05.1712. - DOI - PubMed
    1. Watanabe Y, Nagayama M, Okumura A, et al. MR imaging of acute biliary disorders. Radiographics. 2007;27:477–495. doi: 10.1148/rg.272055148. - DOI - PubMed

LinkOut - more resources