. 2021 May;51(5):1262-1277.
doi: 10.1002/eji.202048891. Epub 2021 Mar 10.

Highly multiplexed tissue imaging using repeated oligonucleotide exchange reaction

Affiliations

Highly multiplexed tissue imaging using repeated oligonucleotide exchange reaction

Julia Kennedy-Darling et al. Eur J Immunol. 2021 May.

Abstract

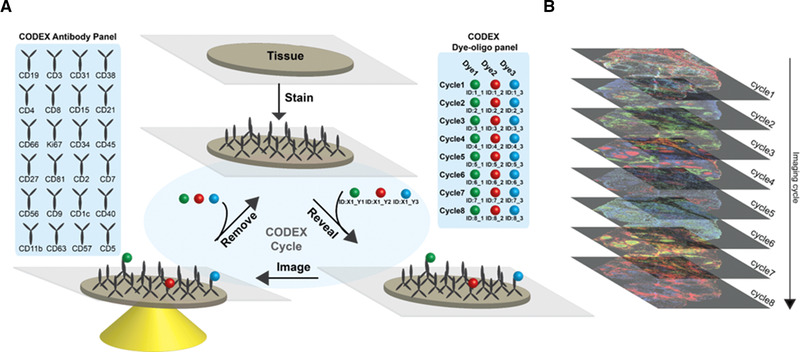
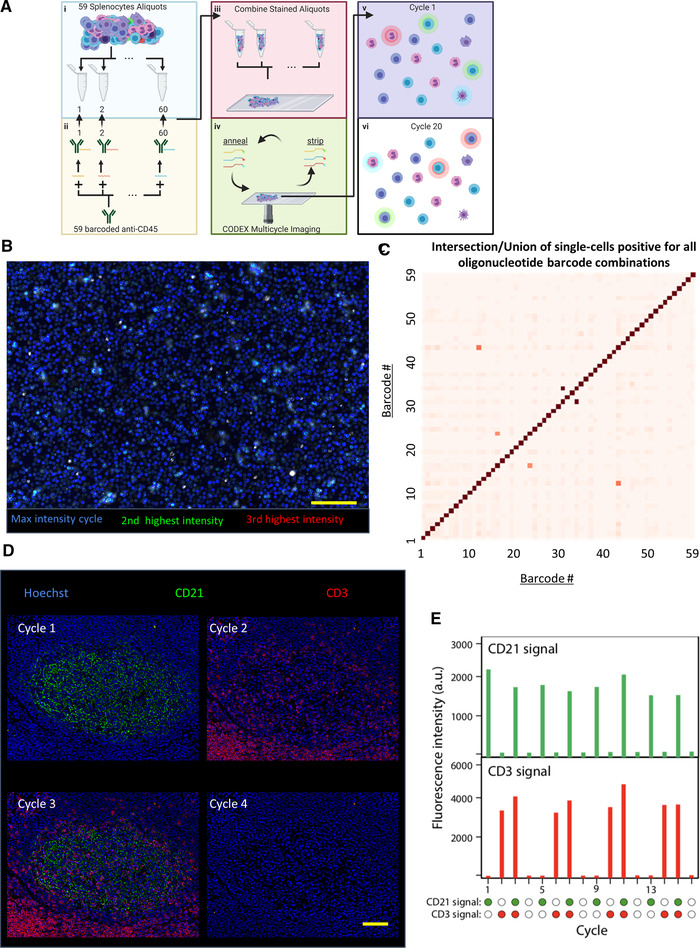
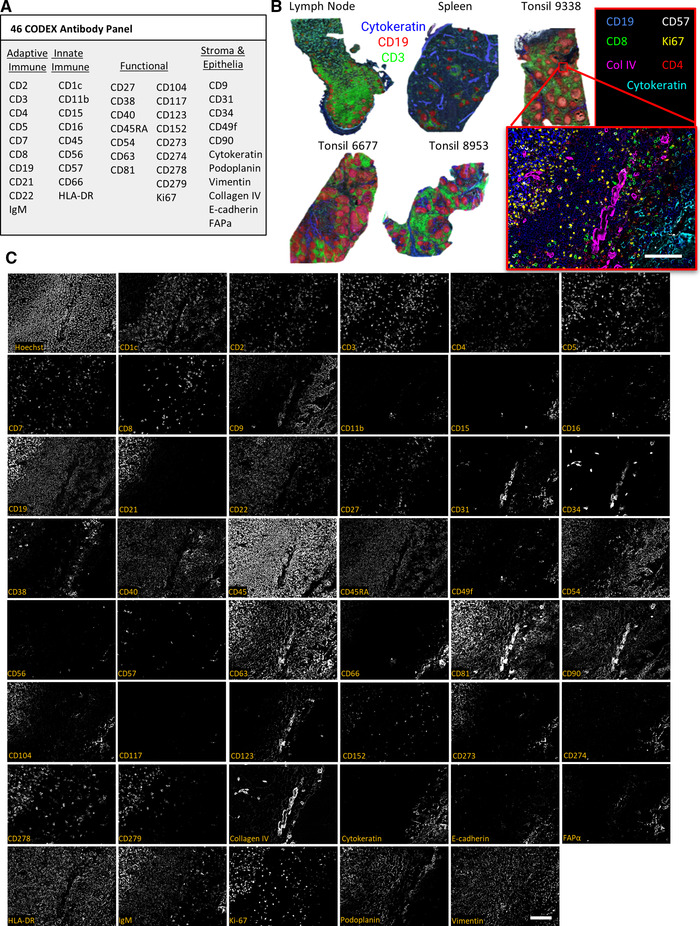
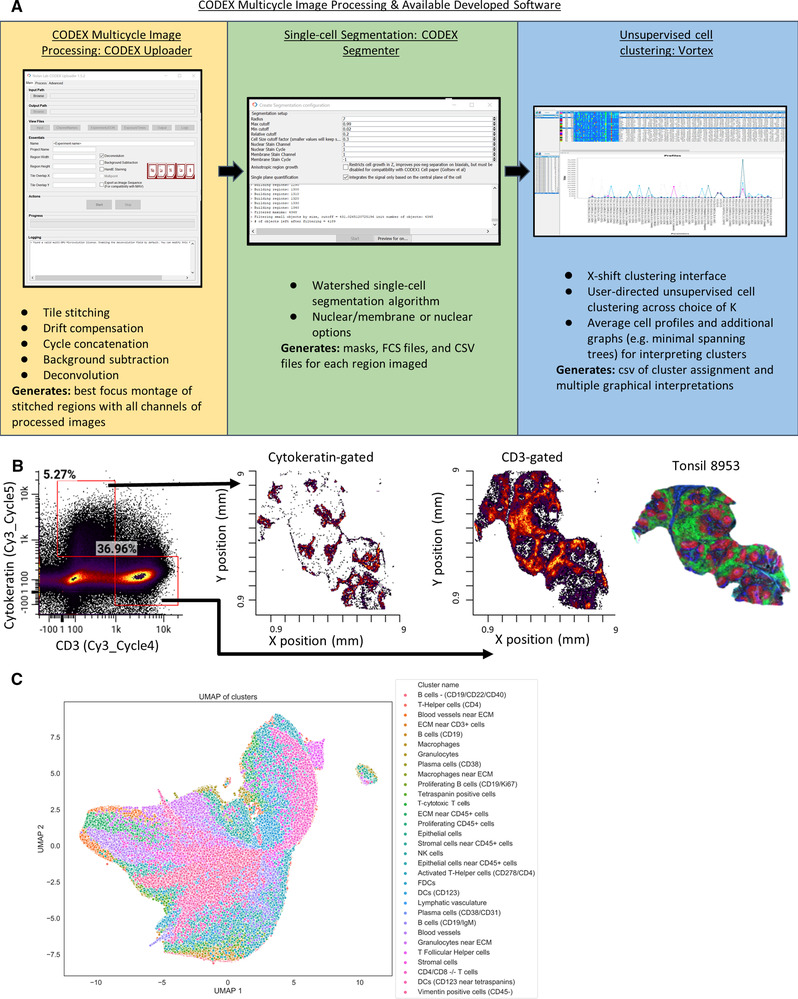
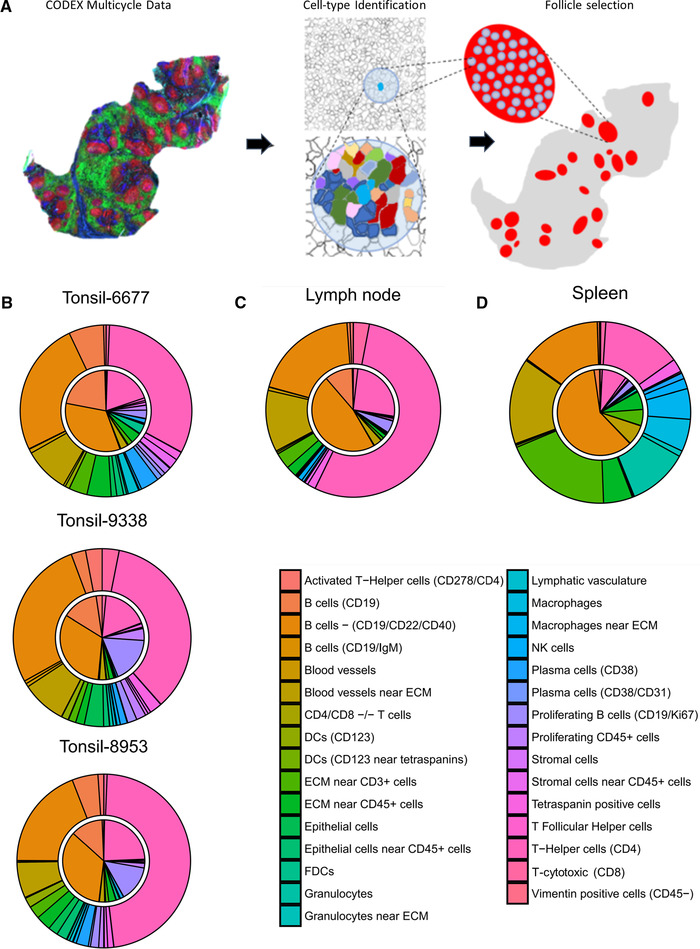
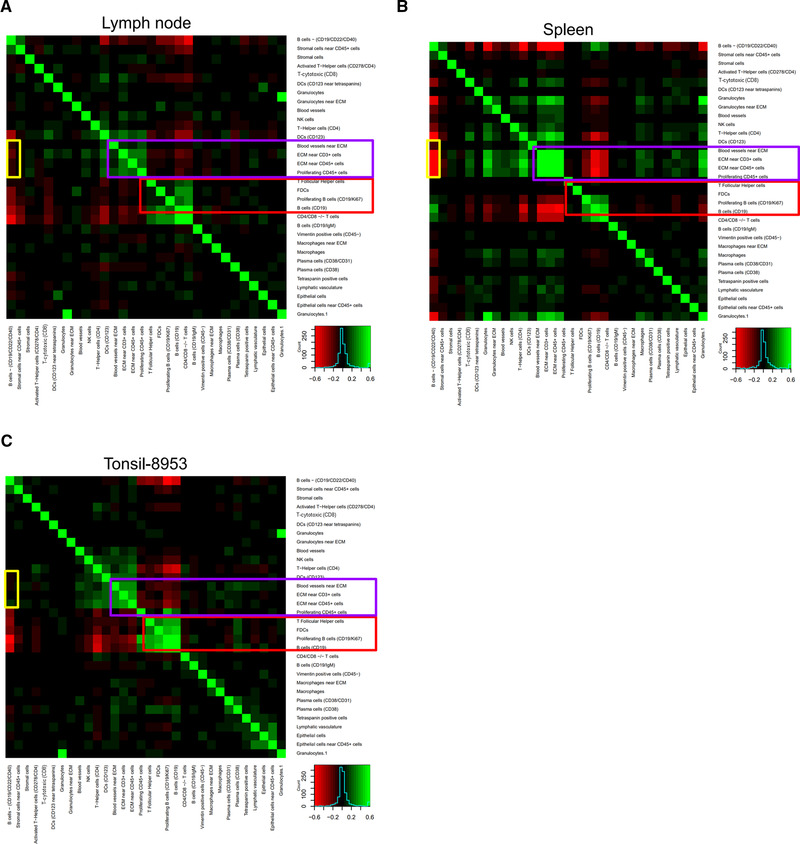
Multiparameter tissue imaging enables analysis of cell-cell interactions in situ, the cellular basis for tissue structure, and novel cell types that are spatially restricted, giving clues to biological mechanisms behind tissue homeostasis and disease. Here, we streamlined and simplified the multiplexed imaging method CO-Detection by indEXing (CODEX) by validating 58 unique oligonucleotide barcodes that can be conjugated to antibodies. We showed that barcoded antibodies retained their specificity for staining cognate targets in human tissue. Antibodies were visualized one at a time by adding a fluorescently labeled oligonucleotide complementary to oligonucleotide barcode, imaging, stripping, and repeating this cycle. With this we developed a panel of 46 antibodies that was used to stain five human lymphoid tissues: three tonsils, a spleen, and a LN. To analyze the data produced, an image processing and analysis pipeline was developed that enabled single-cell analysis on the data, including unsupervised clustering, that revealed 31 cell types across all tissues. We compared cell-type compositions within and directly surrounding follicles from the different lymphoid organs and evaluated cell-cell density correlations. This sequential oligonucleotide exchange technique enables a facile imaging of tissues that leverages pre-existing imaging infrastructure to decrease the barriers to broad use of multiplexed imaging.

Keywords: CODEX; DNA-conjugated antibodies; Multiplexed tissue imaging; Single-cell analysis; Spatial single-cell biology.


Conflict of interest statement

J.K.D. is an employee of Akoya Biosciences, Inc. G.P.N. received research grants from Pfizer, Inc., Vaxart, Inc., Celgene, Inc., and Juno Therapeutics, Inc. during the course of this work. N.S., Y.G., and G.P.N. are inventors on US patent 9909167, granted to Stanford University that covers some aspects of the technology described in this article. J.K.D., N.S., Y.G., and G.P.N. have equity in and/or are scientific advisory board members of Akoya Biosciences, Inc. C.M.S. is a scientific advisor to Enable Medicine, LLC. The other authors declare no commercial or financial conflict of interests.

Figures

Figure 1
Figure 1
CODEX is a multiplexed tissue imaging technique that relies on antibodies conjugated to unique oligonucleotides. (A) Schematic of repeated oligonucleotide exchange workflow for CODEX imaging. Briefly, antibodies conjugated with unique oligonucleotide barcodes are used to stain a tissue section. Three antibodies bound to the tissue are then rendered visible by adding different complementary fluorescent oligonucleotides. After imaging, the reporter oligonucleotides are stripped through the use of a chaotropic solvent. The cycle is repeated until all antibodies within the panel have been revealed and imaged. (B) Data acquired are then concatenated and processed. The method enables evaluation of up to 60 markers simultaneously.
Figure 2
Figure 2
Validation of unique oligonucleotide barcode library. (A) Overall schematic for testing oligonucleotide orthogonality. (i) Fifty‐nine splenocyte aliquots were made, and (ii) each one was stained with anti‐mouse CD45 antibody with a unique oligonucleotide barcode. (iii) All aliquots were pooled and fixed on a slide and rendered visible through CODEX multicycle imaging. In principle, (v) cells should only display one fluorophore and (vi) an individual cell should only be stained in one cycle. (B) Image generated by evaluating each pixel and displaying the highest intensity pixel from all of the cycles with the color blue, the second highest intensity pixel from all of the cycles with the color green, and the third highest intensity pixel from all of the cycles with red (n = 1 experimental replicate, 15 × 106 splenocytes quantified across 59 barcodes). (C) Heatmap of quantified intersection over union of each oligonucleotide pair from single‐cell segmented image data of the anti‐CD45 stained splenocytes for all 59 oligonucleotides. (D) Representative images from CODEX 16‐cycle experiment where oligonucleotide‐conjugated anti‐CD21 (green) was rendered visible in the first cycle, anti‐CD3 (red) in the second cycle, both in the third cycle, and neither in the fourth cycle; the four cycles were repeated three times (n = 1 experimental replicate over 16 channels). (E) Quantification of fluorescent intensities for the two channels across all 16 cycles. Scale bars: 100 μm, 20x magnification.
Figure 3
Figure 3
Use of the CODEX protocol to stain cellularly dense human lymphoid tissues with a panel of 46 antibodies (n = 1 CODEX multicycle imaging of each tissue with stated antibody panel: 3 tonsils, each from a different donor, 1 spleen from another donor, and 1 lymph node from another donor). (A) The 46‐antibody panel contains antibodies to key adaptive and innate immune, functional, and stromal, and epithelial markers. (B) Overview images of five lymphoid tissue samples with Cytokeratin (blue), CD19 (red), and CD3 (green) shown. The higher magnification tile image shows tonsil 9338 with CD19 (blue), CD57 (grey), CD8 (green), Ki67 (yellow), Collagen IV (magenta), CD4 (red), and Cytokeratin (cyan). (C) Representative images of a zoomed in tile from tonsil 9338 of all markers and Hoechst staining. Scale bars: 100 μm, 20× magnification.
Figure 4
Figure 4
Processing of CODEX multiparameter imaging data. (A) The image analysis was performed using our “CODEX Uploader” for image processing, “CODEX segmenter” for cell segmentation, and “VORTEX” for unsupervised single‐cell clustering. (B) Example of segmented data from tonsil 8953 as an fcs file with populations gated on fluorescent intensity of CD3 or Cytokeratin (no prior gating). These gated CD3+ and Cytokeratin+ populations are plotted with × (mm), y (mm) coordinates to reveal spatial locations of the populations in the tissue. (C) UMAP plot of all data with the 31 cell types identified by unsupervised clustering indicated by color (total number of cells quantified from single‐cell segmentation from all tissues imaged = 2.3 × 10⁶ cells).
Figure 5
Figure 5
Cell‐type compositions within and surrounding lymphoid tissue follicle structures. (A) CODEX multiparameter imaging data were used to perform unsupervised clustering to identify key subtypes. CD19 expression data were used to manually identify follicles within tissues. Cell‐type compositions of follicle areas and of cells directly surrounding the follicles were analyzed using these masks. (B‐D) Average cell‐type compositions of follicles from (B) three tonsil tissues, (C) a lymph node, and (D) a spleen; the inner pie circle corresponds to the area within each identified follicle and the outer rim corresponds to the cells directly surrounding the follicle (a diameter of 1.2 times the size of a cell).
Figure 6
Figure 6
Cell‐cell density correlation analysis for (A) lymph node, (B) spleen, and (C) tonsil determined by evaluating 100 × 100 pixel regions. The heat map scale is from red (anticorrelated) to green (correlated). Correlated modules present in all three tissues are indicated by purple and red boxes; an anticorrelated module present in spleen but not lymph node or tonsil is indicated by the yellow boxes.

References

    1. Thommen, D. S. , Koelzer, V. H. , Herzig, P. , Roller, A. , Trefny, M. , Dimeloe, S. , Kiialainen, A. et al., A transcriptionally and functionally distinct PD‐1+ CD8+ T cell pool with predictive potential in non‐small‐cell lung cancer treated with PD‐1 blockade. Nat. Med. 2018. 24: 994–1004. - PMC - PubMed
    1. Dieu‐Nosjean, M. ‐C. , Goc, J. , Giraldo, N. A. , Sautès‐Fridman, C. and Fridman, W. H. , Tertiary lymphoid structures in cancer and beyond. Trends Immunol. 2014. 35: 571–580. - PubMed
    1. Sautès‐Fridman, C. , Petitprez, F. , Calderaro, J. and Fridman, W. H. , Tertiary lymphoid structures in the era of cancer immunotherapy. Nat. Rev. Cancer 2019. 19: 307–325. - PubMed
    1. Bruno, T. C. , B cells to the forefront of immunotherapy. Nature 2020. 577: 474–476. - PMC - PubMed
    1. Helmink, B. A. , Reddy, S. M. , Gao, J. , Zhang, S. , Basar, R. , Thakur, R. , Yizhak, K. et al., B cells and tertiary lymphoid structures promote immunotherapy response. Nature 2020. 577: 549–555. - PMC - PubMed

Publication types