. 2021 Mar 17;109(6):1013-1028.e9.
doi: 10.1016/j.neuron.2021.01.014. Epub 2021 Feb 5.

Gating of hippocampal rhythms and memory by synaptic plasticity in inhibitory interneurons

Affiliations

Gating of hippocampal rhythms and memory by synaptic plasticity in inhibitory interneurons

Xingzhi He et al. Neuron. .

Abstract

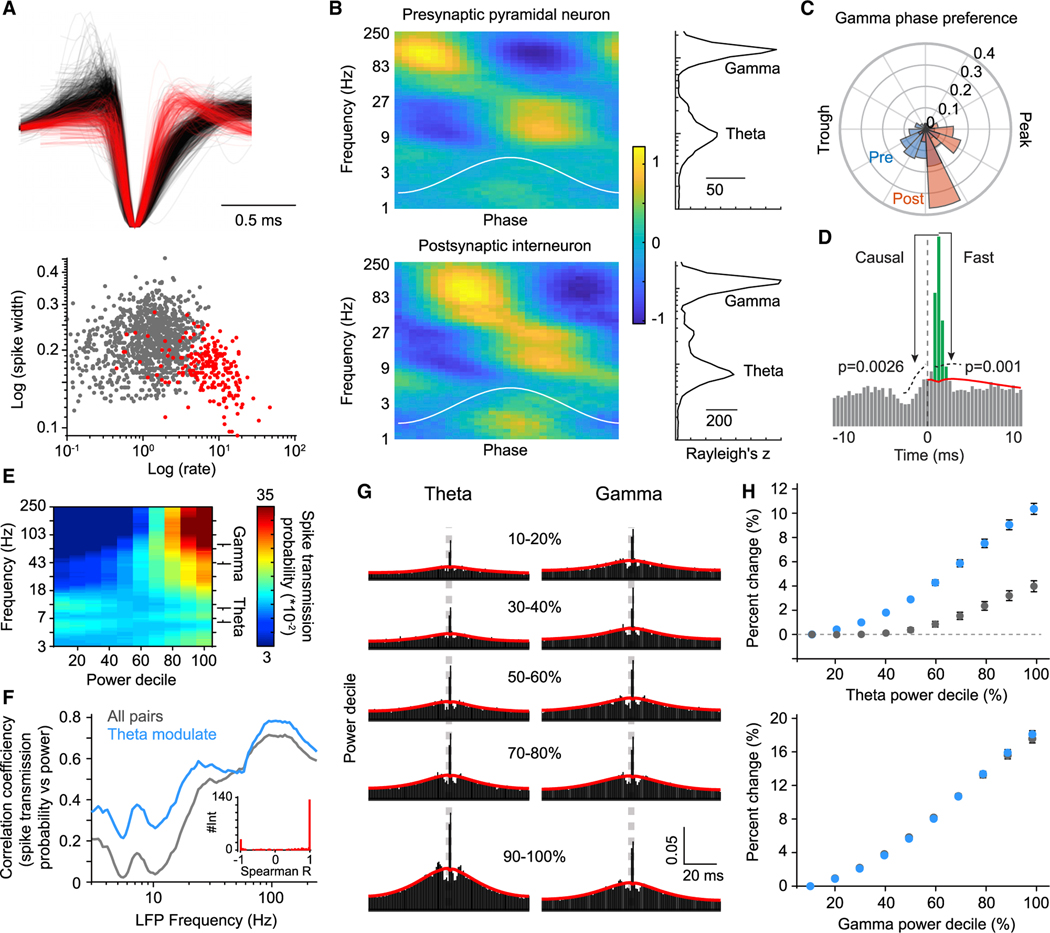
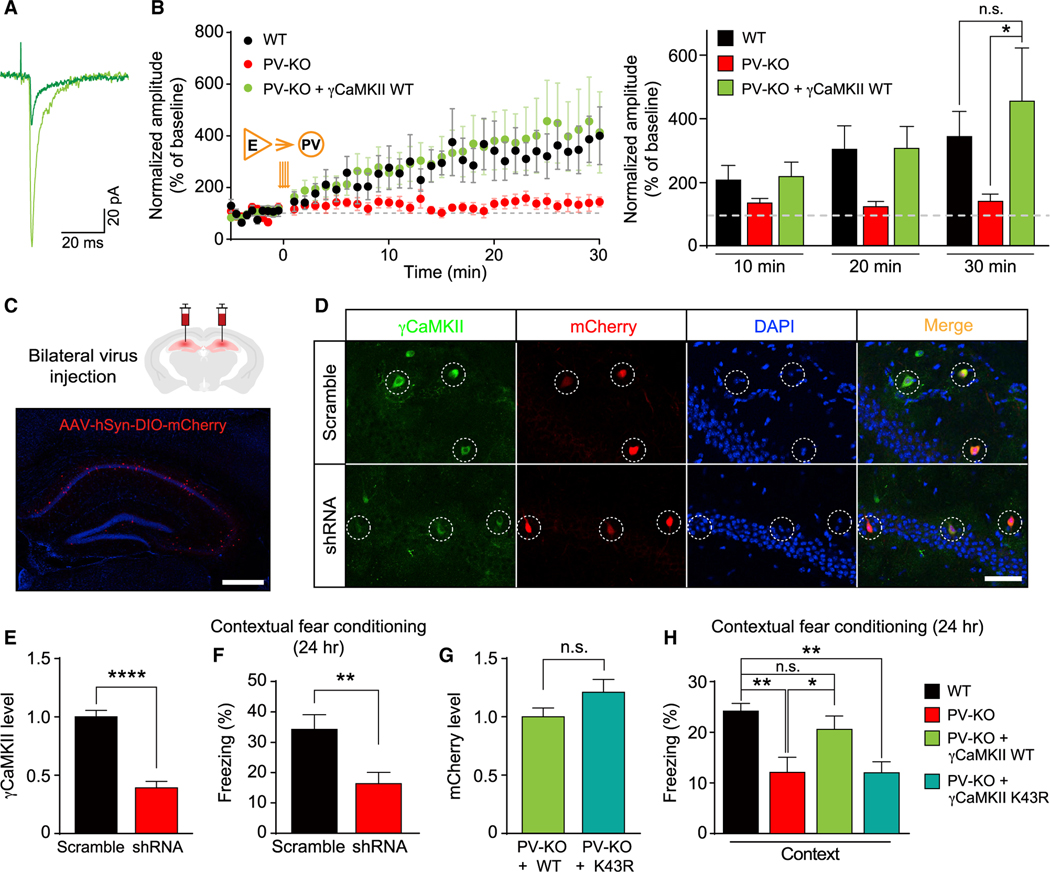
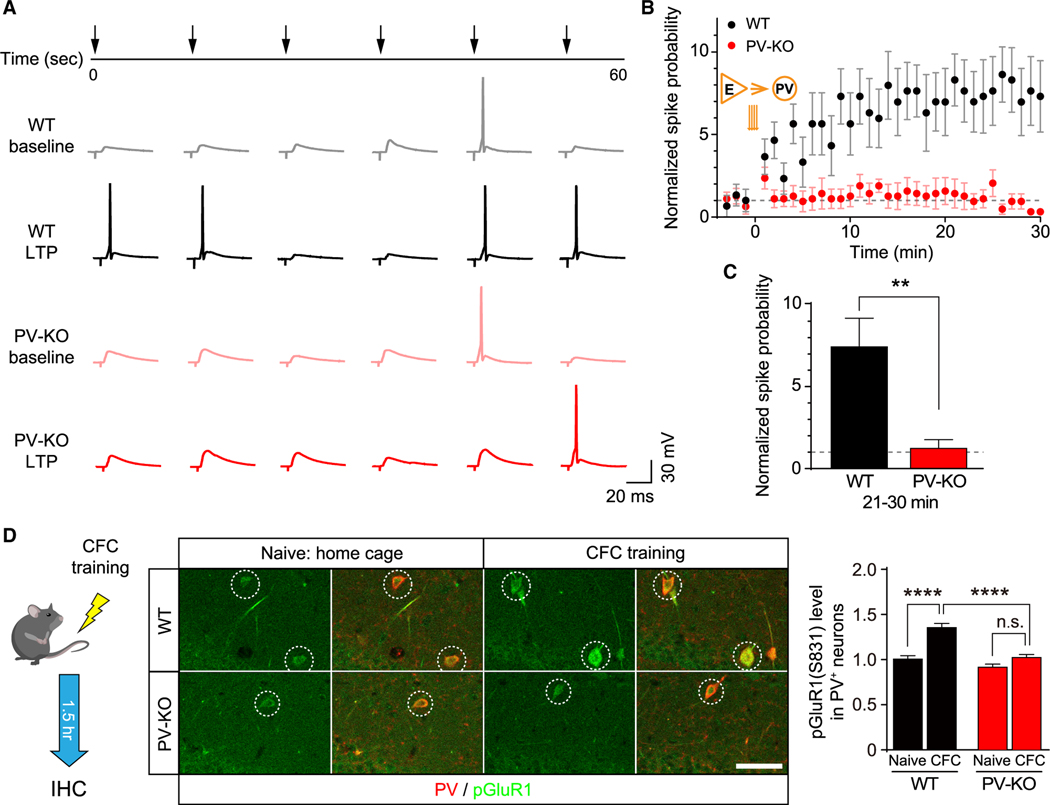
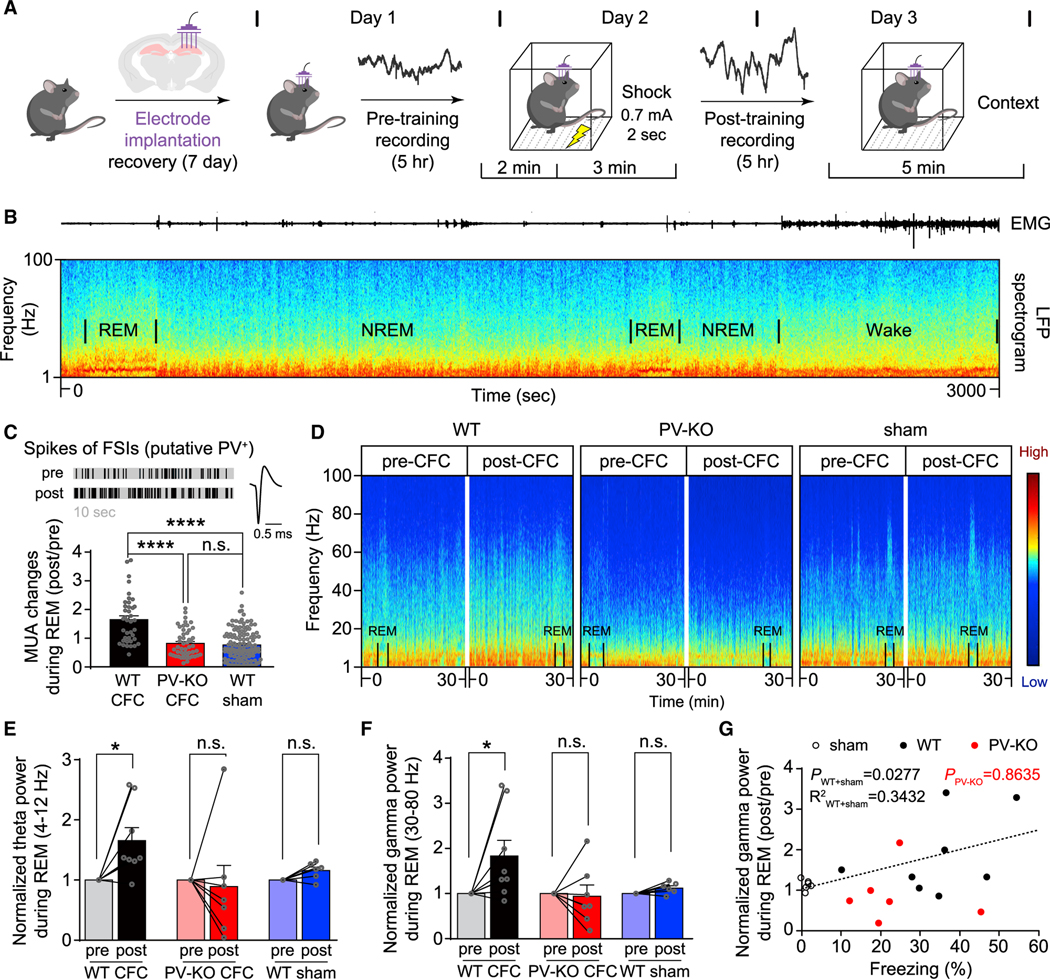
Mental experiences can become long-term memories if the hippocampal activity patterns that encode them are broadcast during network oscillations. The activity of inhibitory neurons is essential for generating these neural oscillations, but molecular control of this dynamic process during learning remains unknown. Here, we show that hippocampal oscillatory strength positively correlates with excitatory monosynaptic drive onto inhibitory neurons (E→I) in freely behaving mice. To establish a causal relationship between them, we identified γCaMKII as the long-sought mediator of long-term potentiation for E→I synapses (LTPE→I), which enabled the genetic manipulation of experience-dependent E→I synaptic input/plasticity. Deleting γCaMKII in parvalbumin interneurons selectively eliminated LTPE→I and disrupted experience-driven strengthening in theta and gamma rhythmicity. Behaviorally, this manipulation impaired long-term memory, for which the kinase activity of γCaMKII was required. Taken together, our data suggest that E→I synaptic plasticity, exemplified by LTPE→I, plays a gatekeeping role in tuning experience-dependent brain rhythms and mnemonic function.

Keywords: CaMKII; LTP; inhibitory interneurons; learning and memory; network oscillations; network plasticity; synaptic plasticity.


Conflict of interest statement

Declaration of interests H.H. and S.D. are members of advisory boards for the journal Neuron.

Figures

Figure 1.
Figure 1.. LFP power is positively associated with E→I monosynaptic drive
(A) Top, the waveform of each pyramidal cell (black, n = 1,129) and inhibitory (red, n = 240) interneuron for which putative synaptic interactions were detected. Bottom, spike half-width and mean firing rate differentiate cell type. (B) The spike phase modulation of pyramidal cells (top) and interneurons (bottom) as a function of instantaneous LFP frequency. Color bar shows Z-scored firing rate. Plots to the right show the median Raleigh Z statistic for each population as a function of LFP frequency. (C) The distribution of the gamma phase preference of pyramidal cells and interneurons (D) Method for estimating spike transmission probability. Putative synaptic pairs showed peaks in the CCG in the forward direction (causal test) and above a baseline defined by lower frequency co-modulation (fast test). The area of the CCG (green) above this slow baseline (red) defines the spike transmission probability. (E) The LFP was filtered using wavelet kernels (100 logarithmically spaced Gabor wavelets from 1 to 250 Hz), and, for each frequency band, the entire recording was binned into deciles of the logarithm of the power spectrum. Each pyramidal spike was assigned to a decile bin for each frequency band, and cross-correlations CCGs (pyramidal cells → inhibitory interneurons) were conditioned upon wavelet power. The heat plot shows the spike transmission probability for each decile of each frequency band. (F) The spike transition probability was correlated (Spearman R) with the decile for each frequency band and averaged across all pairs (gray) and separately for pairs in which the rate of the post-synaptic INT positively correlated with theta power (theta mod., blue). Inset, the distribution of correlation coefficients (Spearman R) of the interneuron firing rate versus theta power, as calculated per theta power decile. (G) Example CCGs between a pyramidal cell and interneuron showing the probability of observing an interneuron spike immediately following a pyramidal spike as a function of theta and gamma power. Synaptic connectivity is inferred by sharp peaks at monosynaptic lags (1–4 ms) above the expected degree of synchrony given slower-timescale (15 ms) rate fluctuations (red line). CCGs were conditioned upon theta/gamma power and split into deciles. (H) The percentage of increase in spike transition probability relative to the lowest decile bin for all pairs (gray) and for theta mod. pairs (blue) for both theta and gamma. N = 6 mice.
Figure 2.
Figure 2.. γCaMKII is enriched in GABAergic interneurons in the mouse hippocampus and cortex
(A) γCaMKII mRNA levels are high in αCaMKII-negative/GAD2-positive neurons (dashed circles) in the hippocampus. (B) γCaMKII protein levels are high in GAD67+ interneurons (dashed circles) in the hippocampus. (C and D) Hippocampal sections obtained from GAD2::Ai14 (tdT) and PV::Ai14 (tdT) mice reveal high γCaMKII expression in GAD2+ and PV+ interneurons (dashed circles). (E) Top, schematic illustration of the γCaMKII mRNA and proteins, showing the regions recognized by the ISH probe (nucleotides 2266–3365) and the antibodies ab01 (amino acids 441–458) and ab02 (amino acids 369–386). Bottom, representative images showing γCaMKII ab01 (left) and ab02 (right) immunostaining in PV+ interneurons (dashed circles) in the hippocampus. For (A)–(E), see Figures S1 and S3 for the distribution in the cortex. (F) γCaMKII PV-KO mice were generated by crossing γCaMKIILoxP/LoxP mice with PV-Cre mice. (G) Example western blot analysis and summary of γCaMKII in the hippocampus of wild-type (WT), PV-KO, and KO mice (n = 4–7 mice/group). In this and subsequent figures, summary data are presented as the mean ± SEM. *p < 0.05 and ****p < 0.0001 (one-way ANOVA followed by Tukey’s test). Scale bar: 50 μm (A and C–E) and 100 μm (B). See also Figures S1–S3.
Figure 3.
Figure 3.. γCaMKII PV-KO mice have normal LTPE→E but impaired LTPE→I
(A) Schematic illustration of recordings in PV+ interneurons. PV+ interneurons were identified by the virus-mediated expression of Cre-dependent fluorescent proteins, and pyramidal cells were identified by morphology. (B) Left, example spike traces evoked by twice-threshold current injection in hippocampal PV+ interneurons. Right, spike frequency measured for the 1st–10th spikes (n = 5–6 cells from 2–3 mice/group). (C) Example paired-pulse traces measured in hippocampal PV+ interneurons (left) and summary of paired-pulse ratio (right) at the indicated interstimulus intervals (n = 5–6 cells from 3–4 mice/group). (D and E) Top, example traces of mEPSCs (D) and sEPSCs (E) measured in hippocampal PV+ interneurons of WT and PV-KO mice. Bottom, cumulative distribution plots and summary of mEPSC and sEPSC frequency and amplitude in WT and PV-KO mice (n = 5–22 cells from 2–5 mice/group). (F) LTP in PV+ interneurons is impaired in γCaMKII PV-KO mice. Top, the stimulation pairing protocol for inducing LTP and the control protocol (no pairing) are shown schematically. Also shown are superimposed representative averaged EPSCs recorded 5 min before (dark traces) and 25 min after (light traces) LTP induction. The bottom panels show normalized amplitude before and after the TBS stimulation protocol (orange arrows) and the summary data measured 1–10, 11–20, and 21–30 min after LTP induction. There was no difference among the groups of WT (no pairing), WT (D-AP5), and γCaMKII PV-KO (n = 8–10 cells from 3–8 mice/group). (G) LTP induced using a TBS pairing protocol in WT (black) and γCaMKII PV-KO (red) pyramidal neurons showed no difference (n = 6–8 cells from 5 mice/group). All recordings were performed with the GABAA receptor antagonist picrotoxin (100 μM) in the bath solution. PV+ interneurons were identified by the virus-mediated expression of Cre-dependent fluorescent proteins, and pyramidal cells were identified by morphology. Data were analyzed using an unpaired Student’s t test or a two-way ANOVA followed by Tukey’s multiple comparison test, *p < 0.05 and **p < 0.01. See also Figures S4–S7.
Figure 4.
Figure 4.. Impaired hippocampus-dependent long-term memory in γCaMKII PV-KO mice
(A) Left, schematic illustration of inhibitory avoidance test. Right, latency to enter the dark compartment before conditioning (training) and 1 or 24 h after conditioning (testing) was measured using the inhibitory avoidance test (n = 8–16 mice/group). (B) Left, schematic illustration of contextual fear conditioning test. Right, the percentage of freezing among WT and PV-KO mice was measured 1 or 24 h after conditioning (context) in the one-trial contextual fear conditioning test and sham conditioning (walk through) (n = 7–15 mice/group). (C) Left, schematic illustration of cued fear conditioning test. Right, the freezing response was measured 24 h after training in WT and PV-KO mice (n = 8–10 mice/group). (D and E) Summary of the results of the novel object recognition test (D) and the Y maze test (E) (n = 8–13 mice/group). In (A) and (B), **p < 0.01 and ****p < 0.0001 (one-way ANOVA followed by Tukey’s test). In (C), two-way ANOVA followed by Sidak’s test. In (D) and (E), **p < 0.01 and ****p < 0.0001 (unpaired or paired Student’s t test). See also Figure S8.
Figure 5.
Figure 5.. The functional role of γCaMKII in hippocampal PV+ interneurons in LTPE→I and hippocampus-dependent long-term memory
(A and B) LTP of PV+ interneurons was rescued by virus-mediated re-expressing γCaMKII in the hippocampal PV+ interneurons of PV-KO mice (B) and superimposed representative averaged EPSCs recorded 5 min before (dark traces) and 25 min after (light traces) LTP induction in PV-KO mice (A). Note that the WT group and PV-KO data are also shown in Figure 3F (n = 8–19 cells from 6–15 mice/group), in which PV+ interneurons were identified by the virus-mediated expression of Cre-dependent fluorescent proteins. (C) Top, schematic illustration of AAV-mediated expression of target genes in the mature hippocampus through bilateral stereotactic injection. Bottom, the representative image showing specific delivery and expression of AAV2/9-hSyn-DIO-mCherry-P2A-HA-HsγCaMKII (red) in the hippocampus. The nuclei were counterstained with DAPI (blue). (D and E) Representative images (D) and summary data (E) showing that γCaMKII shRNA effectively knocked down the expression of γCaMKII in hippocampal PV+ interneurons in WT (PV-Cre) mice (n = 20–83 cells from 2–3 mice/group). (F) Memory performance measured 24 h after CFC training in mice (WT, PV-Cre) that bilaterally express AAV-DIO-scramble shRNA or -γCaMKII shRNA in hippocampal PV+ interneurons (n = 9 mice/group). (G) To compare levels of expressed γCaMKII, we measured mCherry intensity in hippocampal PV+ interneurons of PV-KO mice injected with the AAV2/9-hSyn-DIO-mCherry-P2A-HA-HsγCaMKII WT (+WT) virus or the AAV2/9-hSyn-DIO-mCherry-P2A-HA-HsγCaMKII K43R (+K43R) virus (n = 33–34 cells from 3 mice/group). (H) The reduced contextual fear response in PV-KO mice is rescued by overexpressing WT γCaMKII but not the kinase-dead mutant form of γCaMKII (K43R) in the hippocampus (n = 7–26 mice/group). The virus-mediated expression of Cre-dependent fluorescent protein was used as the control in the black and red groups. The data in (B) were analyzed using a two-way ANOVA followed by Sidak’s test; the data in (E)–(G) were analyzed using an unpaired Student’s t test; the data in (H) were analyzed using a one-way ANOVA followed by Sidak’s test. *p < 0.05, **p < 0.01, and ****p < 0.0001. Scale bar: 500 μm (C) and 50 μm (D). See also Figure S9.
Figure 6.
Figure 6.. Impaired activity-dependent spike transmission coupling and phosphorylation of GluR1 in the hippocampus of γCaMKII PV-KO mice
(A) Example traces before (light traces) and 25 min after (dark traces) the TBS stimulation. (B) Normalized spike transmission probability before and after the TBS stimulation in WT (black) and γCaMKII PV-KO (red) mice. Note that the spike transmission probability before the TBS stimulation between these two groups was adjusted to a similar level (see STAR Methods). (C) The summary data measured 21–30 min after the TBS stimulation (n = 5–6 cells from 3–4 mice/group). (D) Immunostaining of pGluR1 (S831) in the PV-positive neurons (dashed circles) in the CA1 region of WT and PV-KO mice 1.5 h after the contextual fear conditioning (CFC) training or naive conditioning. Summary data are shown at the right (n = 118–152 cells from 5 mice/group). **p < 0.01 and ****p < 0.0001 (unpaired Student’s t test or one-way ANOVA followed by Turkey’s test). Scale bar: 50 μm. See also Figure S9.
Figure 7.
Figure 7.. Impaired experience-dependent oscillations in the hippocampus of γCaMKII PV-KO mice
(A) The hippocampal CA1 region was recorded for 5 h pre-CFC and then recorded for 5 h post-CFC (the recordings were performed at the same time of day, see STAR Methods). (B) Representative local field potential (LFP) spectrogram (bottom) and corresponding EMG trace (top) measured during a typical 50-min sleep-wake period in a WT mouse; REM and non-REM (NREM) periods are indicated. (C) Top left, representative MUA of the fast-spiking interneurons (FSIs, putative PV+ interneurons) during REM (10 s) in a WT mouse (pre-and post-CFC training); top right, representative trace of a spike of FSIs in WT mice. Bottom, summary of MUA changes (post/pre) for FSIs during REM (the first 30 s for each REM); compared to the groups of PV-KO and sham-treated WT mice, MUA of FSIs increased significantly in the WT group following CFC. n = 39–122 REMs from 2–4 mice/group, ****p < 0.0001 (one-way ANOVA test). (D) Representative spectrograms waves measured in 30 min epochs pre- (left) and post-training (right) in WT, PV-KO, and sham-treated WT mice; the color represents relative power intensity (dB). (E and F) Normalized theta wave (E) and gamma wave (F) power was measured before and after training in WT, PV-KO, and sham-treated WT mice. n = 6–8 mice/group, *p < 0.05 (Wilcoxon matched-pairs signed-rank test). (G) Changes of gamma band power (post/pre) during REM are plotted against freezing (%) for each WT, PV-KO, and sham-treated WT mouse, note that one recorded mouse (PV-KO) was not followed by the retrieval test. Black circles: the WT sham group (n = 6 mice), black dots: the WT group (n = 8 mice), red dots: PV-KO group (n = 6 mice). PWT+sham = 0.0277, R2WT+sham = 0.3432; PPV-KO = 0.8635, and the Bonferroni-corrected p values indicate the results of a Spearman rank-order test. See also Figures S10–S12.

Similar articles

Cited by

References

    1. Abel T, Havekes R, Saletin JM, and Walker MP (2013). Sleep, plasticity and memory from molecules to whole-brain networks. Curr. Biol. 23, R774–R788. - PMC - PubMed
    1. Akgül G, and McBain CJ (2016). Diverse roles for ionotropic glutamate receptors on inhibitory interneurons in developing and adult brain. J. Physiol. 594, 5471–5490. - PMC - PubMed
    1. Allen K, and Monyer H. (2015). Interneuron control of hippocampal oscillations. Curr. Opin. Neurobiol. 31, 81–87. - PubMed
    1. Bartos M, Vida I, and Jonas P. (2007). Synaptic mechanisms of synchronized gamma oscillations in inhibitory interneuron networks. Nat. Rev. Neurosci. 8, 45–56. - PubMed
    1. Bliss TV, and Collingridge GL (1993). A synaptic model of memory: long-term potentiation in the hippocampus. Nature 361, 31–39. - PubMed

Publication types

Substances