. 2021 Mar 10;29(3):489-502.e8.
doi: 10.1016/j.chom.2021.01.015. Epub 2021 Jan 29.

Genomic monitoring of SARS-CoV-2 uncovers an Nsp1 deletion variant that modulates type I interferon response

Affiliations

Genomic monitoring of SARS-CoV-2 uncovers an Nsp1 deletion variant that modulates type I interferon response

Jing-Wen Lin et al. Cell Host Microbe. .

Abstract

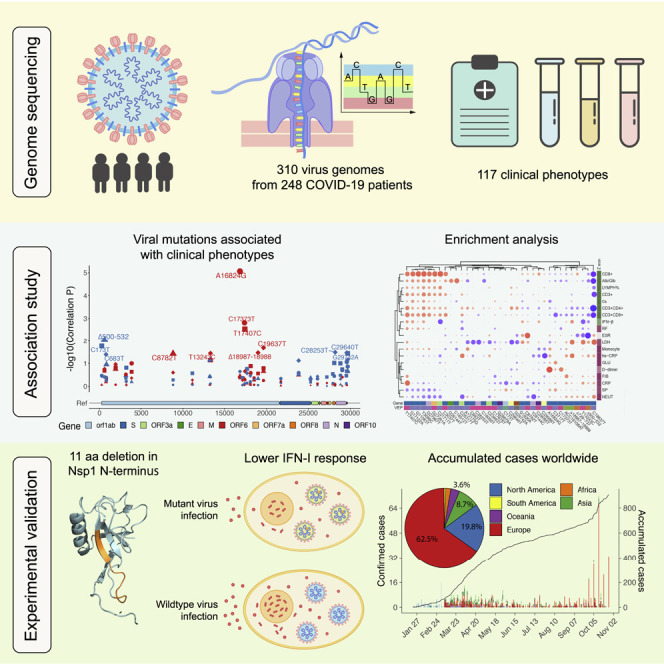
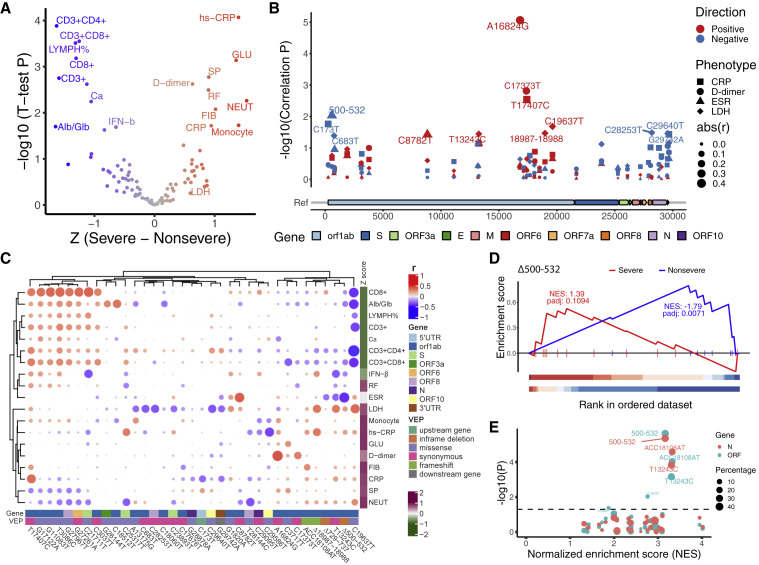
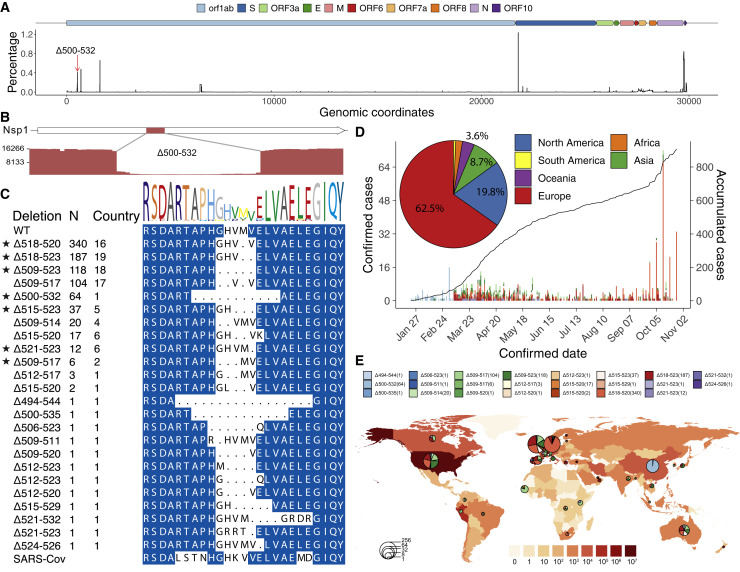
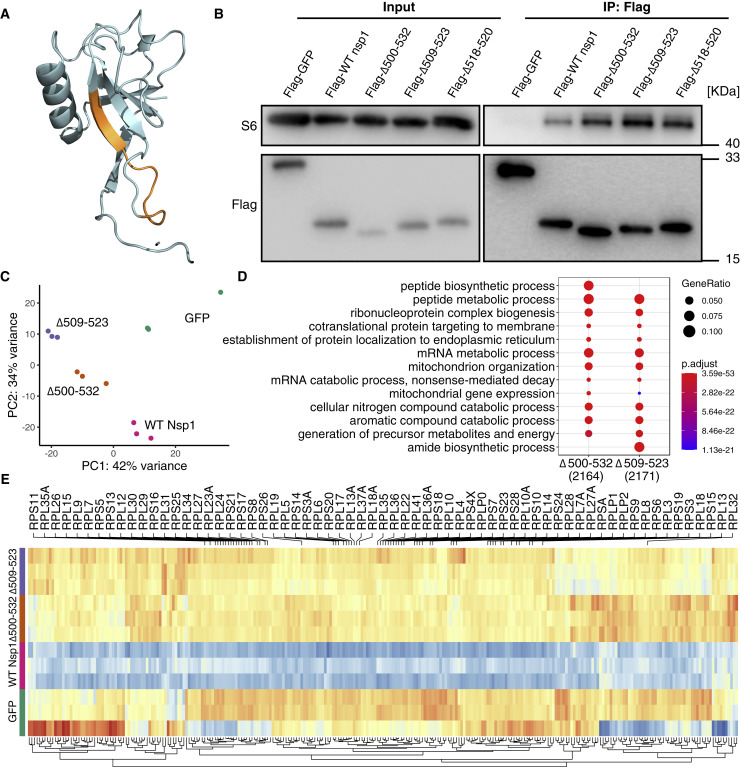
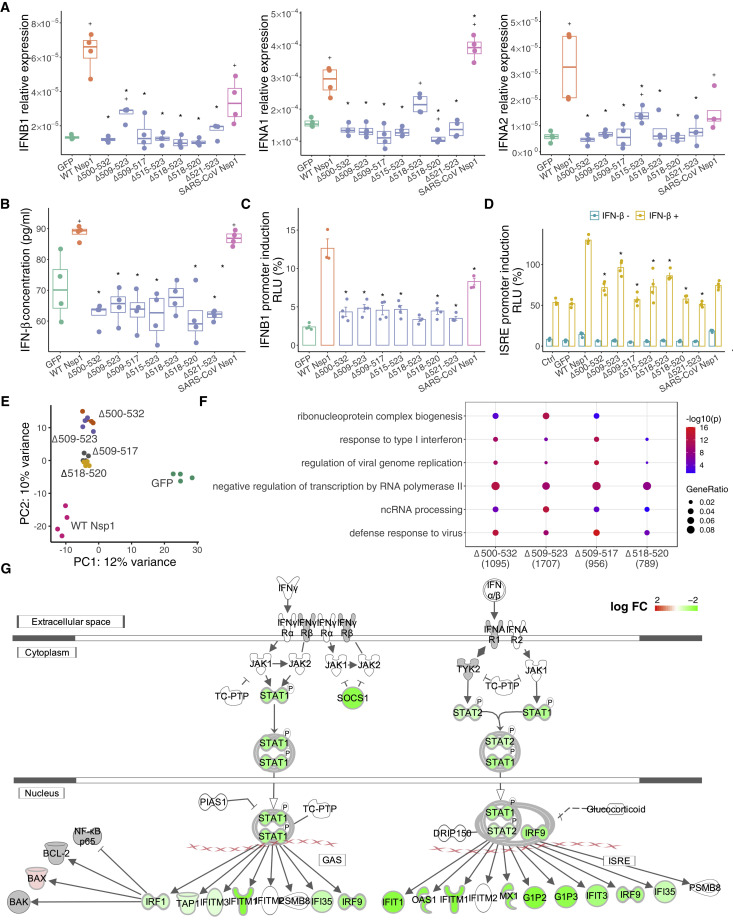
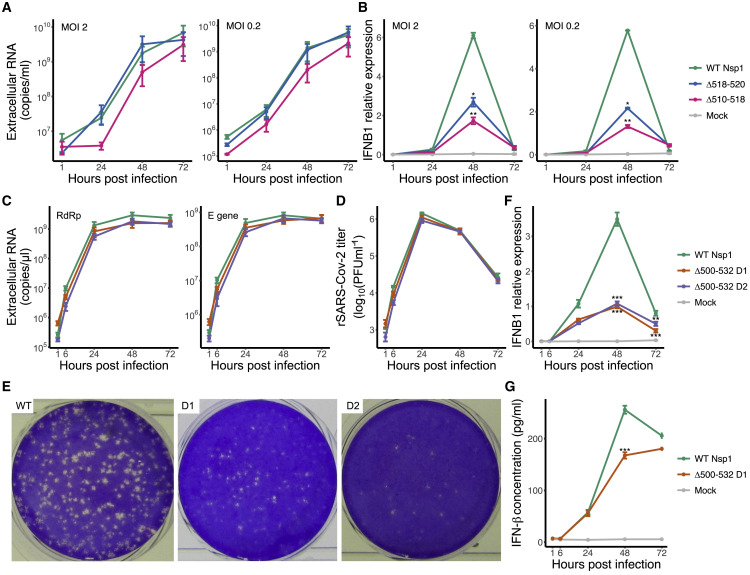
The SARS-CoV-2 virus, the causative agent of COVID-19, is undergoing constant mutation. Here, we utilized an integrative approach combining epidemiology, virus genome sequencing, clinical phenotyping, and experimental validation to locate mutations of clinical importance. We identified 35 recurrent variants, some of which are associated with clinical phenotypes related to severity. One variant, containing a deletion in the Nsp1-coding region (Δ500-532), was found in more than 20% of our sequenced samples and associates with higher RT-PCR cycle thresholds and lower serum IFN-β levels of infected patients. Deletion variants in this locus were found in 37 countries worldwide, and viruses isolated from clinical samples or engineered by reverse genetics with related deletions in Nsp1 also induce lower IFN-β responses in infected Calu-3 cells. Taken together, our virologic surveillance characterizes recurrent genetic diversity and identified mutations in Nsp1 of biological and clinical importance, which collectively may aid molecular diagnostics and drug design.

Keywords: COVID-19; Nsp1; SARS-CoV-2; association; clinical phenotype; deletion; genetic variants; genomic epidemiology; interferon; reverse genetics.


Conflict of interest statement

Declaration of interests The authors declare no competing interests.

Figures

None
Graphical abstract
Figure 1
Figure 1
Spatial and temporal epidemiology of SARS-CoV-2 in Sichuan province (A) Geographic distribution of confirmed and sequenced COVID-19 cases in Sichuan province, China. Confirmed case numbers were colored on the map and the size of the circles is proportional to the number of sequenced cases. (B) Time series of the PCR-confirmed COVID-19 cases in Sichuan by the date of symptom onset. Cases are classified according to whether they were sequenced in this study. The dashed line indicates the cumulative number of the cases. The right panel shows the age and gender distribution of reported COVID-19 cases. (C) The relationship between the number of confirmed cases and the population size of 21 cities in Sichuan province. Pearson correlation was applied and the gray area around the regression line indicates the 95% confidence interval. Color scale indicates cases per million population. (D) The frequency of each SNP (blue) and indel (red) in the SARS-CoV-2 genome that was identified in the Sichuan cohort. The y axis indicates positions in the SARS-CoV-2 genome.
Figure 2
Figure 2
Recurrent genetic variants and phylogenetic analysis in the SARS-CoV-2 genomes (A) Percentage of samples with the 35 recurrent genetic variants we studied in different continents or regions. The effect of the variants was predicted by VEP (Ensembl Variant Effect Predictor). (B) Visualization of the corresponding time-scaled maximum clade credibility tree based on estimated maximum likelihood phylogeny of SARS-CoV-2 genome sequences from Sichuan (colored dots) and genomes from other countries or Chinese provinces (gray dots). The clusters (A–D) are highlighted in colors corresponding to that in Figure S2B, and samples with Δ500-532 are colored in red. All nodes with posterior probabilities lower than 0.5 have been collapsed into polytomies and their range of divergence dates are shaded in gray. (C) The daily number of locally transmitted (red) and imported (gray) COVID-19 cases in Sichuan province. The accumulated locally transmitted case number was shown in the red line. (D) Posterior distributions of the tMRCAs (time to most recent common ancestry) of the five phylogenetic clusters (A–D) from the molecular clock analysis. Distributions (orange) are truncated at the upper and lower limits of the 95% HPD (highest posterior density) intervals; the vertical red lines indicate the median estimates. Blue shading and horizontal red lines indicate the sampling period over which genomes in each cluster were collected. Dots indicate the collection dates of the genomes, colored by sampling location from Sichuan (red) and other regions (gray).
Figure 3
Figure 3
Associations of 35 recurrent genetic variants with clinical phenotypes (A) Volcano plot of the significant traits that are associated with COVID-19 severity. The x axis shows the difference of Z score between patients that developed severe or non-severe symptoms. The y axis shows –log10(p value) of t test between these two groups. Red indicates indicating severe related traits, and blue, non-severe related traits. Severe related traits include CRP (C-reactive protein), hs-CRP (high-sensitivity CRP), GLU (serum glucose), SP (systolic pressure), D-dimer, RF (respiratory frequency), FIB (fibrinogen), NEUT (neutrophils counts), Monocyte (monocyte counts), and LDH (lactate dehydrogenase); and non-severe related include CD3+, CD3+CD4+, CD3+CD8+, CD8+ cell counts, LYMPH% (percentage of lymphocytes), Ca (serum calcium), Alb/Glb (albumin and globulin ratio), and IFN-b (serum IFN-β). The traits with p value less than 0.05 are shown. (B) Manhattan plot of 35 genetic variants that were associated with CRP, D-dimer, ESR (erythrocyte sedimentation rate), and LDH. Genome position and –log10 (correlation p value) were shown. Different symbols indicate that correlated phenotypes and size of the symbols is in proportion to the absolute (abs) value of correlation efficient (r). Red or blue indicates a positive or negative correlation, respectively. (C) Heatmap of correlation coefficients between clinical phenotypes and genetic variants. The clustering was based on Pearson correlation coefficients. Intensity of red and blue indicates correlation efficient, red indicates positive correlation, and blue, negative correlation. Intensity of purple and green indicates higher or lower mean values in the severe group. (D) Δ500-532 is significantly enriched with non-severe traits but not with severe traits. p values were adjusted using permutation. (E) Dot plot shows summed normalized enrichment score (NES) and p values of t test between the group with or without a certain variant for Ct values in qPCR tests. The dots in the top right corner have more significant p values for Ct values of N (red) or ORF (blue) genes and a higher enrichment score.
Figure 4
Figure 4
Prevalence of deletion variants in the 500-532 locus in SARS-CoV-2 genome (A) Percentage of deletion in the SARS-CoV-2 genome. The red arrow indicates the 500-532 locus. (B) Sashimi plot indicates the sequencing reads that were mapped around the identified Δ500-532 region (see Figures S6B and S6C). (C) The alignment of amino acid residues of mutation neighboring 500-532 locus in Nsp1 coding region. Identified cases number (N) and the number of countries were shown. WT, wild-type SARS-CoV-2 Nsp1 sequence. Stars indicate the deletion mutants that were further tested experimentally (related to Figures 5, 6, and 7). (D) The confirmed (left y axis) or accumulated (right y axis) cases with Nsp1 deletion mutants. The pie chart shows the percentages of cases identified in each continent. (E) Geographic distribution of COVID-19 cases with the deletion variants worldwide. Color intensity on the map indicates confirmed cases in that region. The pie charts indicate the proportions of different deletion variants in each country, and the size of pie charts indicate the number of cases with the deletion mutants.
Figure 5
Figure 5
Nsp1 mutants retained ribosomal binding ability while affecting mRNA metabolic process (A) Mapping of 500-532 locus (A79PHGHVMVELV89, orange) onto the predicted 3D structure of N terminus of SARS-CoV-2 Nsp1 (Almeida et al., 2007; Wathelet et al., 2007). (B) SARS-CoV-2 Nsp1 mutant proteins bind to 40S ribosomal subunit. HEK293T cells were transfected with Nsp1-expressing (N-terminally tagged with FLAG) or control (FLAG-GFP) plasmid and immunoprecipitated with anti-FLAG antibody. Immunoblots were stained with anti-S6 or anti-FLAG antibodies. (C) PCA (principal-component analysis) on transcriptome of Nsp1-expressing compared to GFP-expressing HEK239T cells. (D) GO enrichment analysis of genes that were upregulated in the mutant compared to WT Nsp1-expressing cells. (E) Heatmap of differentially expressed genes enriched in mRNA metabolic process. Genes coding for ribosomal proteins (RPs) were shown.
Figure 6
Figure 6
Nsp1 mutants downregulate IFN-1 response (A) Relative mRNA expression level of IFNB1, IFNA1, and IFNA2 to GAPDH in SARS-Cov-2 wild-type (WT) or mutant Nsp1-expressing A549 cells. (B) Concentration of IFN-β in the supernatant of Nsp1-expressing A549 cells. GFP and SARS-CoV Nsp1 were used as negative and positive controls. Each dot represents a single biological replicate. Median and range of 75th percentile are also shown in the boxplots. indicates statistical significance between mutant and WT Nsp1, and + indicates significance between GFP controls. Mann-Whitney U test was performed. (C and D) IFNB1-promoter (C) and interferon-stimulated response element (ISRE)-mediated promoter (D) controlled luciferase reporter assays. HEK293T cells were transiently transfected with luciferase plasmid only (Ctrl) or along with GFP- or Nsp1-expressing plasmids, with (+) or without (–) IFN-β treatment in (D). Promoter activities were determined as the ratio between a firefly luciferase and internal control of Renilla luciferase. Mean and SEM are shown. indicates significance between mutant and WT Nsp1. Mann-Whitney U test was performed. (E) PCA on transcriptome of A549 cells transfected with Nsp1 variants or GFP control. (F) GO enrichment analysis of the genes that were significantly downregulated in mutant compared to WT Nsp1-expressing A549 cells. (G) Interferon signaling pathways were significantly downregulated in Δ500-532 mutant compared to WT Nsp1-expressing A549 cells. The pathway was generated in IPA (Ingenuity Pathway Analysis). Green indicates downregulation, red indicates upregulation, and gray indicates genes that were in the dataset but not differentially expressed. The intensity of red or green indicates the log2(fold-change) of each gene.
Figure 7
Figure 7
Growth kinetics and regulation of IFN-I response in wild-type and Nsp1 deletion virion (A) Extracellular viral RNA copy number produced by Calu-3 cells infected with virus isolates with wild-type (WT) Nsp1, Δ518-520 (Δ1aa), or Δ509-517 (Δ3aa), at MOI 2 (left) or MOI 0.2 (right). SARS-CoV-2 RdRp gene was quantified. (B) Relative expression level of IFNB1 (to ACTB) in Calu-3 cells infected with virus isolates at MOI 2 (left) or MOI 0.2 (right). (C) Extracellular viral RNA copy number produced by Calu-3 cells infected with WT or 2 independent clones of Δ500-532 (Δ11aa) recombinant SARS-CoV-2 mutants at MOI 2. SARS-CoV-2 RdRp (left) and E (right) genes were quantified. (D) Viral progeny determined by plaque assay in Vero E6 cells. (E) Comparison of plaque phenotypes of cell supernatant harvested at 48 h post infection (from the growth curve D in Vero E6 cells). (F) IFNB1 transcript level (normalized to GAPDH) in Calu-3 cells infected with WT, mutant rSARS-CoV-2 (Δ500-532 D1 or Δ500-532 D2), or mock infected. (G) Concentration of IFN-β in the supernatant of infected Calu-3 cells. Mean and SEM are shown. Significance between WT and mutant viruses was indicated; p < 0.05, ∗∗p < 0.01, and ∗∗∗p < 0.001. Multiple t tests were performed.

References

    1. Almeida M.S., Johnson M.A., Herrmann T., Geralt M., Wüthrich K. Novel beta-barrel fold in the nuclear magnetic resonance structure of the replicase nonstructural protein 1 from the severe acute respiratory syndrome coronavirus. J. Virol. 2007;81:3151–3161. - PMC - PubMed
    1. Anders S., Pyl P.T., Huber W. HTSeq--a Python framework to work with high-throughput sequencing data. Bioinformatics. 2015;31:166–169. - PMC - PubMed
    1. Ayres D.L., Darling A., Zwickl D.J., Beerli P., Holder M.T., Lewis P.O., Huelsenbeck J.P., Ronquist F., Swofford D.L., Cummings M.P. BEAGLE: an application programming interface and high-performance computing library for statistical phylogenetics. Syst. Biol. 2012;61:170–173. - PMC - PubMed
    1. Banerjee A.K., Blanco M.R., Bruce E.A., Honson D.D., Chen L.M., Chow A., Bhat P., Ollikainen N., Quinodoz S.A., Loney C. SARS-CoV-2 Disrupts Splicing, Translation, and Protein Trafficking to Suppress Host Defenses. Cell. 2020;183:1325–1339.e21. - PMC - PubMed
    1. Benedetti F., Snyder G.A., Giovanetti M., Angeletti S., Gallo R.C., Ciccozzi M., Zella D. Emerging of a SARS-CoV-2 viral strain with a deletion in nsp1. J. Transl. Med. 2020;18:329. - PMC - PubMed

MeSH terms