. 2021 Jan-Jun:296:100376.
doi: 10.1016/j.jbc.2021.100376. Epub 2021 Feb 4.

Lnc-ORA interacts with microRNA-532-3p and IGF2BP2 to inhibit skeletal muscle myogenesis

Affiliations

Lnc-ORA interacts with microRNA-532-3p and IGF2BP2 to inhibit skeletal muscle myogenesis

Rui Cai et al. J Biol Chem. 2021 Jan-Jun.

Abstract

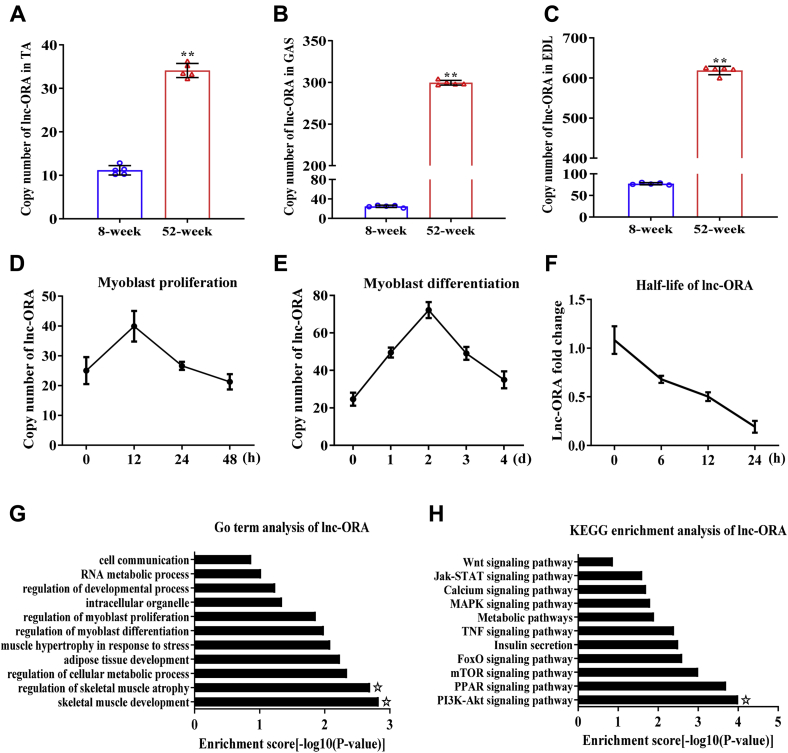
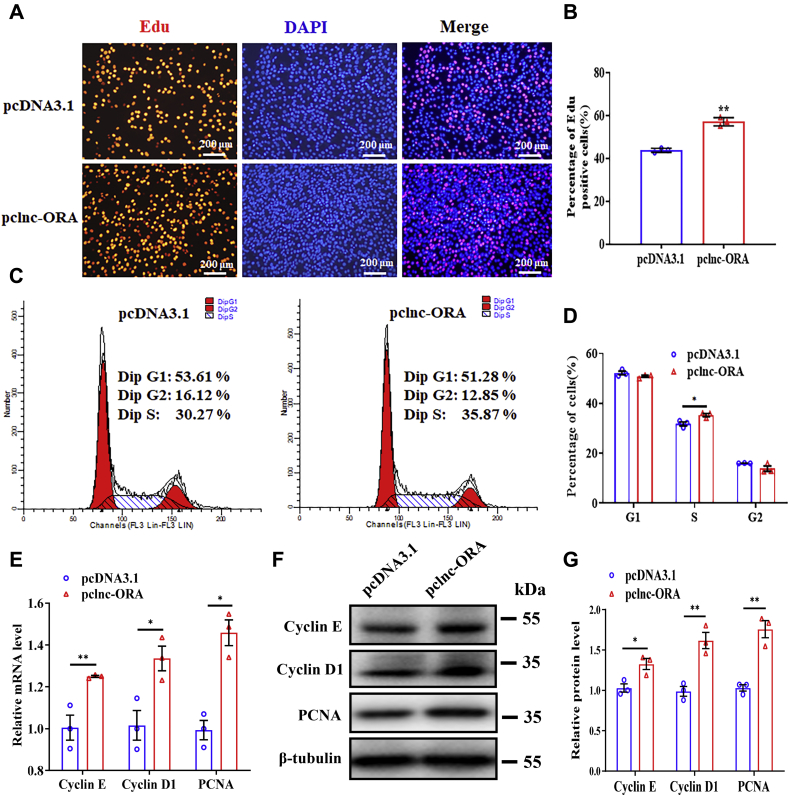
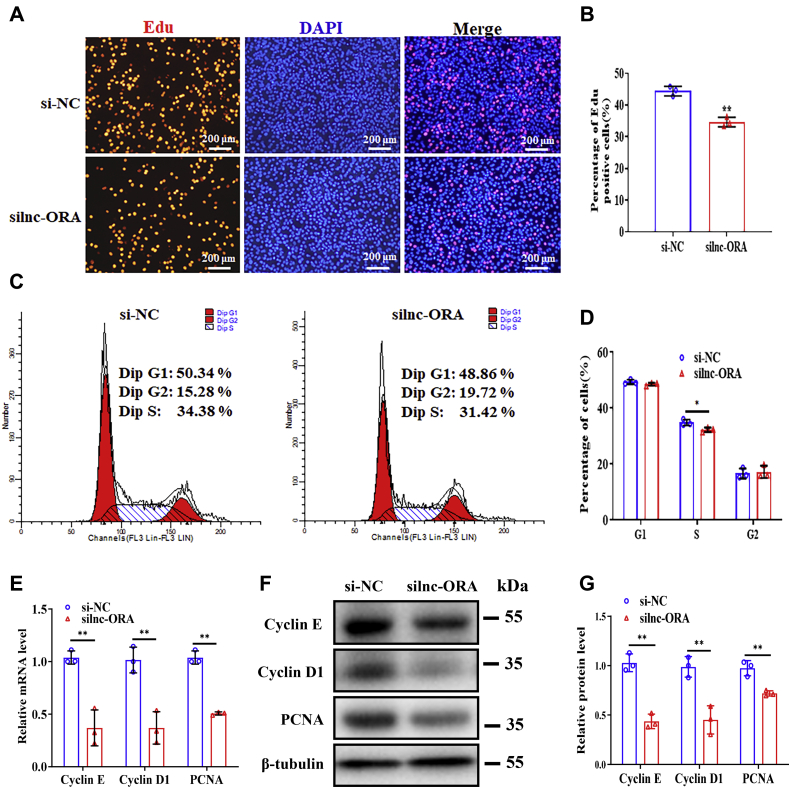
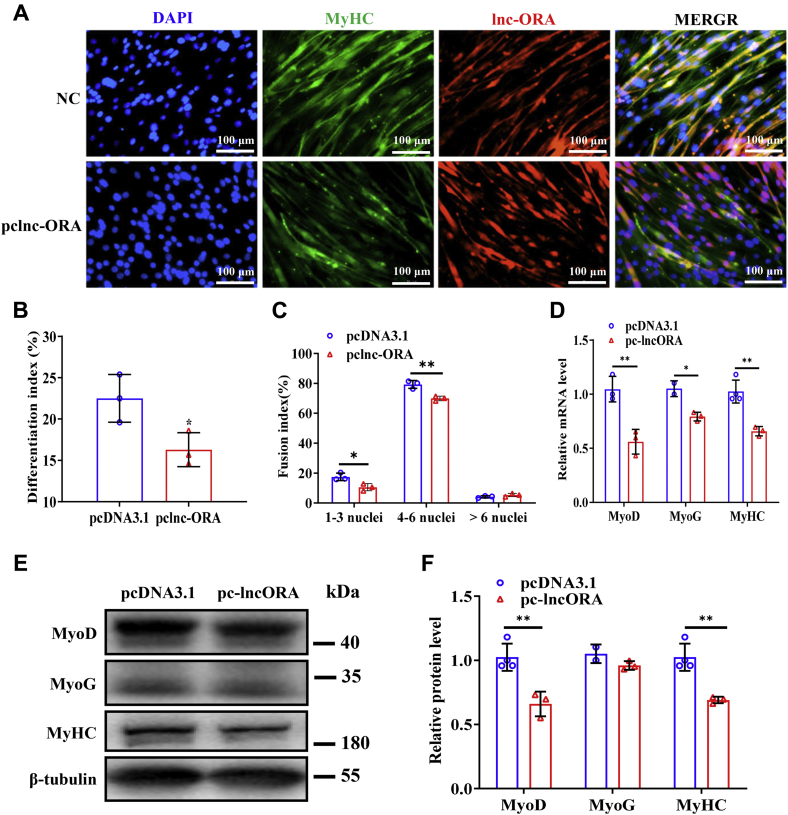
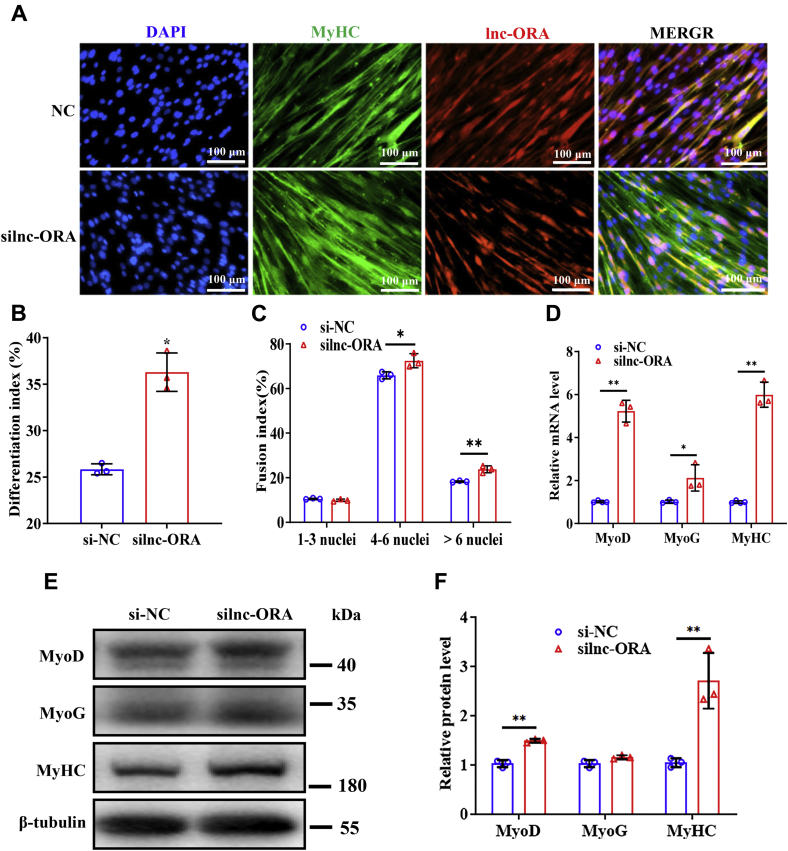
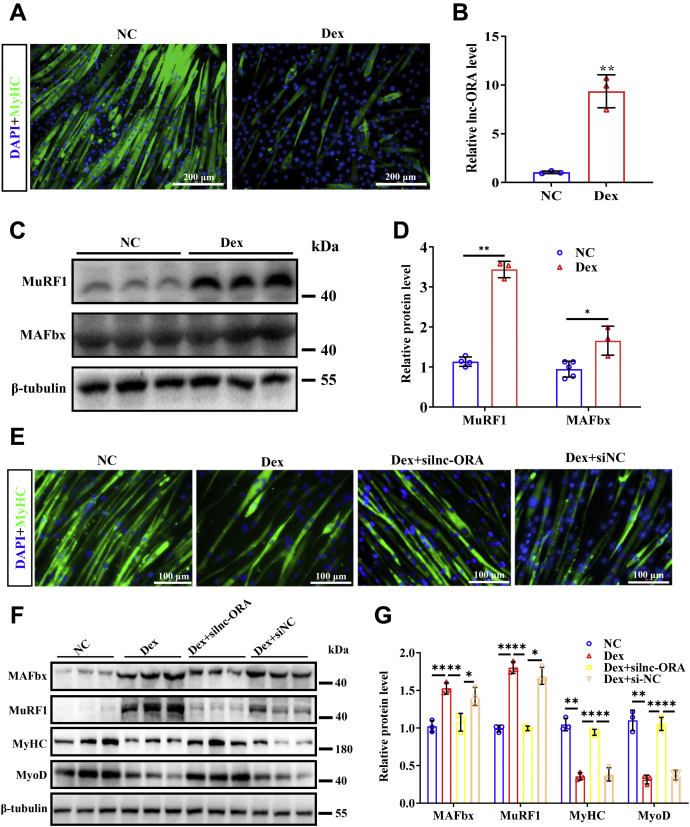
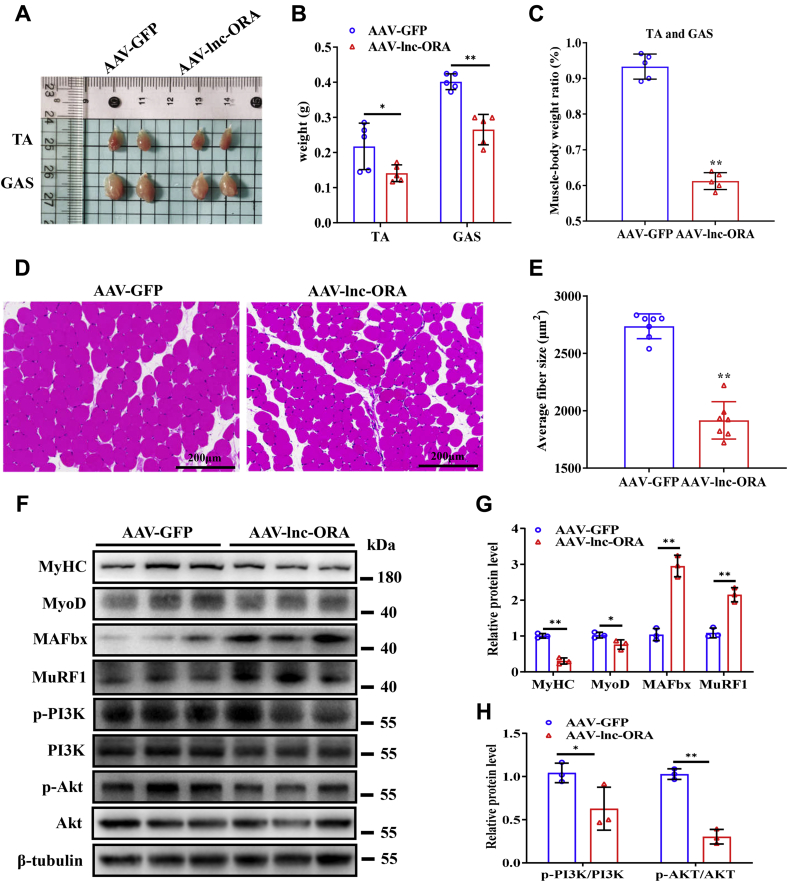
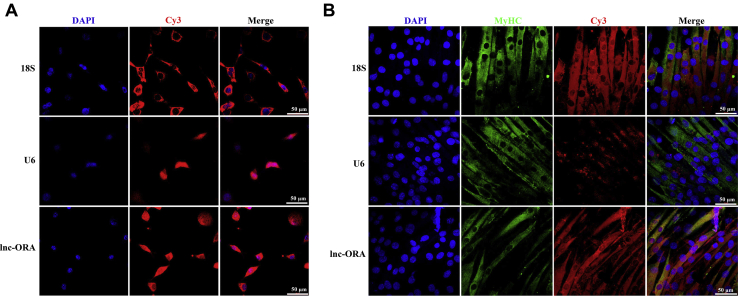
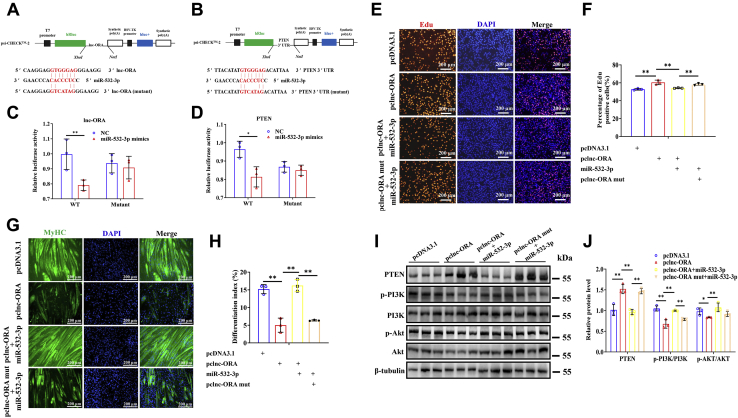
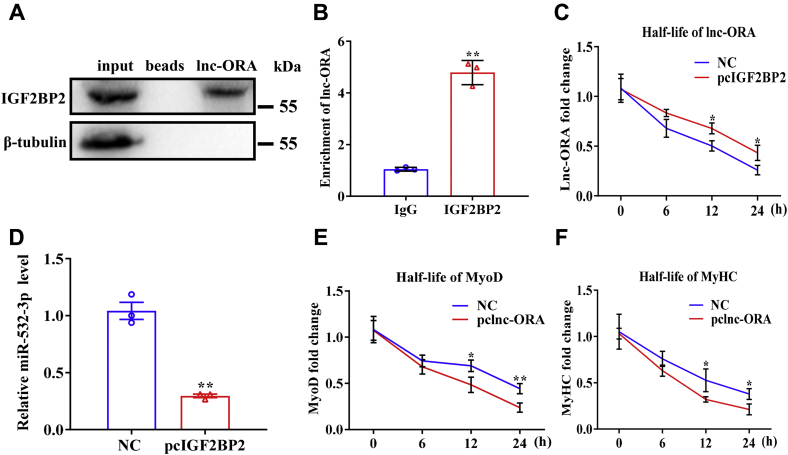
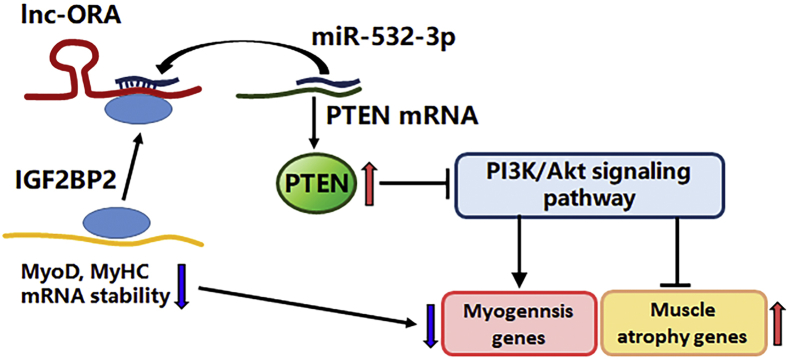
Skeletal muscle is one of the most important organs of the animal body. Long noncoding RNAs play a crucial role in the regulation of skeletal muscle development via several mechanisms. We recently identified obesity-related lncRNA (lnc-ORA) in a search for long noncoding RNAs that influence adipogenesis, finding it impacted adipocyte differentiation by regulating the PI3K/protein kinase B/mammalian target of rapamycin pathway. However, whether lnc-ORA has additional roles, specifically in skeletal muscle myogenesis, is not known. Here, we found that lnc-ORA was significantly differentially expressed with age in mouse skeletal muscle tissue and predominantly located in the cytoplasm. Overexpression of lnc-ORA promoted C2C12 myoblast proliferation and inhibited myoblast differentiation. In contrast, lnc-ORA knockdown repressed myoblast proliferation and facilitated myoblast differentiation. Interestingly, silencing of lnc-ORA rescued dexamethasone-induced muscle atrophy in vitro. Furthermore, adeno-associated virus 9-mediated overexpression of lnc-ORA decreased muscle mass and the cross-sectional area of muscle fiber by upregulating the levels of muscle atrophy-related genes and downregulating the levels of myogenic differentiation-related genes in vivo. Mechanistically, lnc-ORA inhibited skeletal muscle myogenesis by acting as a sponge of miR-532-3p, which targets the phosphatase and tensin homolog gene; the resultant changes in phosphatase and tensin homolog suppressed the PI3K/protein kinase B signaling pathway. In addition, lnc-ORA interacted with insulin-like growth factor 2 mRNA-binding protein 2 and reduced the stability of myogenesis genes, such as myogenic differentiation 1 and myosin heavy chain. Collectively, these findings indicate that lnc-ORA could be a novel underlying regulator of skeletal muscle development.

Keywords: PTEN/PI3K/AKT signaling pathway; insulin-like growth factor 2 mRNA-binding protein 2; lnc-ORA; miR-532-3p; myogenesis; skeletal muscle.


Conflict of interest statement

Conflict of interest The authors declare that they have no conflicts of interest with the contents of this article.

Figures

Figure 1
Figure 1
Lnc-ORA is a regulator of skeletal muscle development.A, copy number of lnc-ORA in the TA of 8-week-old and 52-week-old mice (n = 5). B, copy number of lnc-ORA in the GAS of 8-week-old and 52-week-old mice (n = 5). C, copy number of lnc-ORA in the EDL of 8-week-old and 52-week-old mice (n = 5). D, copy number of lnc-ORA during myoblast proliferation (n = 5). E, copy number of lnc-ORA during myoblast differentiation (n = 5). F, half-life of lnc-ORA in myoblasts (n = 5). G, GO term analysis of the lnc-ORA. H, KEGG enrichment analysis of lnc-ORA. Data represent the mean ± SD. ∗p < 0.05; ∗∗p < 0.01. EDL, extensor digitorum longus; GAS, gastrocnemius; GO, Gene Ontology; lnc, long noncoding; lnc-ORA, obesity-related lncRNA; KEGG, Kyoto Encyclopedia of Genes and Genomes; TA, tibialis anterior.
Figure 2
Figure 2
Overexpression of lnc-ORA promotes myoblast proliferation.A, EdU and DAPI (nuclei) staining analysis 24 h after transfection of pclnc-ORA and pcDNA3.1 empty plasmid in proliferating myoblasts (n = 3). The scale bar represents 200 μm. B, percentage of EdU-positive cells/total cells (n = 3). C, flow cytometry analysis 24 h after transfection of pclnc-ORA and pcDNA3.1 empty plasmid in proliferating myoblasts (n = 3). D, statistical results of flow cytometry (n = 3). E, mRNA levels of cyclin E, cyclin D1, and PCNA 24 h after overexpression of lnc-ORA (n = 3). F, Western blot detection of cyclin E, cyclin D1, and PCNA (n = 3). G, quantitation of the protein level in F (n = 3). Data represent the mean ± SD. ∗p < 0.05; ∗∗p < 0.01. DAPI, 4′,6-diamidino-2-phenylindole; EdU, 5-ethynyl-20-deoxyuridine; lnc, long noncoding; lnc-ORA, obesity-related lncRNA; pclnc-ORA, pcDNA3.1-lnc-ORA; PCNA, proliferating cell nuclear antigen.
Figure 3
Figure 3
Knockdown of lnc-ORA inhibits myoblast proliferation.A, EdU and DAPI (nuclei) staining analysis 24 h after transfection of silnc-ORA and si-NC in proliferating myoblasts (n = 3). The scale bar represents 200 μm. B, percentage of EdU-positive cells/total cells (n = 3). C, flow cytometry analysis 24 h after transfection of silnc-ORA and si-NC in proliferating myoblasts (n = 3). D, statistical results of flow cytometry (n = 3). E, mRNA levels of cyclin E, cyclin D1, and PCNA 24 h after knockdown of lnc-ORA (n = 3). F, Western blot detection of cyclin E, cyclin D1, and PCNA (n = 3). G, quantitation of protein level in F (n = 3). Data represent the mean ± SD. ∗p < 0.05; ∗∗p < 0.01. DAPI, 4′,6-diamidino-2-phenylindole; EdU, 5-ethynyl-20-deoxyuridine; lnc, long noncoding; lnc-ORA, obesity-related lncRNA; PCNA, proliferating cell nuclear antigen; silnc-ORA, siRNA-lnc-ORA.
Figure 4
Figure 4
Overexpression of lnc-ORA inhibits myogenic differentiation.A, immunofluorescent staining of MyHC and DAPI (nuclei) on day 4 of differentiation after overexpression of lnc-ORA (n = 3). The scale bar represents 100 μm. B, statistical analysis of the differentiation index in A (n = 3). C, statistical analysis of the fusion index in A (n = 3). D, mRNA levels of myogenic genes on day 4 of differentiation after overexpression of lnc-ORA (n = 3). E, Western blot detection of MyoD, MyoG, and MyHC (n = 3). F, quantitation of protein levels in E (n = 3). Data represent the mean ± SD. ∗p < 0.05; ∗∗p < 0.01. DAPI, 4′,6-diamidino-2-phenylindole; lnc, long noncoding; lnc-ORA, obesity-related lncRNA; MyHC, myosin heavy chain; MyoD, myogenic differentiation 1; MyoG, myogenin.
Figure 5
Figure 5
Knockdown of lnc-ORA promotes myogenic differentiation.A, immunofluorescent staining of MyHC and DAPI (nuclei) on day 4 of differentiation after knockdown of lnc-ORA (n = 3). The scale bar represents 100 μm. B, statistical analysis of the differentiation index in A (n = 3). C, statistical analysis of the fusion index in A (n = 3). D, mRNA levels of myogenic genes on day 4 of differentiation after knockdown of lnc-ORA (n = 3). E, Western blot detection of MyoD, MyoG, and MyHC (n = 3). F, quantitation of protein levels in E (n = 3). Data represent the mean ± SD. ∗p < 0.05; ∗∗p < 0.01. DAPI, 4′,6-diamidino-2-phenylindole; lnc, long noncoding; lnc-ORA, obesity-related lncRNA; MyHC, myosin heavy chain; MyoD, myogenic differentiation 1; MyoG, myogenin.
Figure 6
Figure 6
Knockdown of lnc-ORA rescues Dex-induced muscle atrophy in vitro.A, morphology of C2C12 cells induced by Dex. The scale bar represents 200 μm. B, level of lnc-ORA in atrophy myotube. C, protein levels of MuRF1 and MAFbx (n = 3). D, quantitation of protein levels in C (n = 3). E, immunofluorescence staining of MyHC and DAPI (nuclei) after cotreatment of silnc-ORA and Dex. The scale bar represents 100 μm. F, Western blot detection of MuRF1, MAFbx, MyHC, and MyoD after cotreatment with silnc-ORA and Dex (n = 3). G, quantitation of protein levels in F (n = 3). Data represent the mean ± SD. ∗p < 0.05; ∗∗p < 0.01. DAPI, 4′,6-diamidino-2-phenylindole; Dex, dexamethasone; lnc, long noncoding; lnc-ORA, obesity-related lncRNA; MAFbx, muscle atrophy F-box; MuRF1, muscle RING finger 1; MyHC, myosin heavy chain; MyoD, myogenic differentiation 1; silnc-ORA, siRNA-lnc-ORA.
Figure 7
Figure 7
Overexpression of lnc-ORA decreases muscle mass and induces muscle atrophy in vivo.A, images of mouse skeletal muscles. B, statistical analysis of muscles mass (n = 5). C, percentage of skeletal muscle (TA and GAS) (n = 5). D, H&E staining images of GAS cross section. The scale bar represents 200 μm. E, statistics of fiber area in D (n = 5). F, Western blot detection of MyHC, MyoD, MAFbx, MuRF, p-PI3K, PI3K, p-AKT, and AKT in the GAS (n = 3). G and H, quantitation of protein level in F (n = 3). Data represent the mean ± SD. ∗p < 0.05; ∗∗p < 0.01. AKT, protein kinase B; GAS, gastrocnemius; lnc, long noncoding; lnc-ORA, obesity-related lncRNA; MAFbx, muscle atrophy F-box; MuRF, Muscle RING finger; MyHC, myosin heavy chain; MyoD, myogenic differentiation 1; p-AKT, phosphorylated AKT; p-PI3K, phosphorylated PI3K; TA, tibialis anterior.
Figure 8
Figure 8
Subcellular localization of lnc-ORA in proliferating and differentiating myoblasts.A, subcellular localization of lnc-ORA by FISH in myoblasts. Special FISH probes against lnc-ORA, U6, and 18S were modified by Cy3 in red. 18S is a cytoplasmic marker, and U6 is a nuclear marker. The nucleus was stained by DAPI in blue. The scale bar represents 50 μm. B, subcellular localization of lnc-ORA by FISH in myotubes. Special FISH probes against lnc-ORA, U6, and 18S were modified by Cy3 in red. 18S is a cytoplasmic marker, and U6 is a nuclear marker. The nucleus was stained by DAPI in blue. The scale bar represents 50 μm. DAPI, 4′,6-diamidino-2-phenylindole; lnc, long noncoding; lnc-ORA, obesity-related lncRNA.
Figure 9
Figure 9
Lnc-ORA functions as a ceRNA for miR-532-3p to control myogenesis.A and B, schematic of the double luciferase assay vector. C and D, analysis of the luciferase reporter assay (n = 3). E, EdU and DAPI (nuclei) staining analysis. The scale bar represents 200 μm. F, statistical analysis in E (n = 3). G, immunofluorescent staining of MyHC analysis. The scale bar represents 200 μm. H, statistical analysis in G (n = 3). I, Western blot detection of PTEN and myogenic factors (n = 3). J, statistical analysis in I (n = 3). Data represent the mean ± SD. ∗p < 0.05; ∗∗p < 0.01. ceRNA, competing endogenous RNA; DAPI, 4′,6-diamidino-2-phenylindole; EdU, 5-ethynyl-20-deoxyuridine; lnc, long noncoding; lnc-ORA, obesity-related lncRNA; MyHC, myosin heavy chain; PTEN, phosphatase and tensin homolog.
Figure 10
Figure 10
Lnc-ORA contributes to myogenesis by competitively binding IGF2BP2.A, Western blotting identified IGF2BP2 bound with lnc-ORA. B, RIP assay revealed that IGF2BP2 was bound with lnc-ORA (n = 3). C, lnc-ORA RNA stability assays in C2C12 myoblasts (n = 3). D, expression level of miR-532-3p when IGF2BP2 was overexpressed (n = 3). E and F, MyoD and MyHC RNA stability assays in C2C12 cells (n = 3). Data represent the mean ± SD. ∗p < 0.05; ∗∗p < 0.01. IGF2BP2, insulin-like growth factor 2 mRNA-binding protein 2; lnc, long noncoding; lnc-ORA, obesity-related lncRNA; MyHC, myosin heavy chain; MyoD, myogenic differentiation 1; RIP, RNA immunoprecipitation.
Figure 11
Figure 11
Molecular regulatory mechanism of lnc-ORA that inhibits skeletal muscle myogenesis and induces muscle atrophy. Lnc-ORA controls PTEN protein levels and further activates the PI3K/AKT signaling pathway by functioning as ceRNA to sponge miR-532-3p and interact with IGF2BP2. AKT, protein kinase B; ceRNA, competing endogenous RNA; IGF2BP2, insulin-like growth factor 2 mRNA-binding protein 2; lnc, long noncoding; lnc-ORA, obesity-related lncRNA; PTEN, phosphatase and tensin homolog.

Similar articles

Cited by

References

    1. Braun T., Gautel M. Transcriptional mechanisms regulating skeletal muscle differentiation, growth and homeostasis. Nat. Rev. Mol. Cell. Biol. 2011;12:349–361. - PubMed
    1. Buckingham M., Rigby P.W. Gene regulatory networks and transcriptional mechanisms that control myogenesis. Dev. Cell. 2014;28:225–238. - PubMed
    1. Schiaffino S., Dyar K.A., Ciciliot S., Blaauw B., Sandri M. Mechanisms regulating skeletal muscle growth and atrophy. FEBS J. 2013;280:4294–4314. - PubMed
    1. Bonaldo P., Sandri M. Cellular and molecular mechanisms of muscle atrophy. Dis. Model Mech. 2013;6:25–39. - PMC - PubMed
    1. Jackman R.W., Cornwell E.W., Wu C.L., Kandarian S.C. Nuclear factor-kappaB signalling and transcriptional regulation in skeletal muscle atrophy. Exp. Physiol. 2013;98:19–24. - PMC - PubMed

Publication types

MeSH terms

LinkOut - more resources