. 2021 May 1:231:117818.
doi: 10.1016/j.neuroimage.2021.117818. Epub 2021 Feb 4.

Infrared neural stimulation with 7T fMRI: A rapid in vivo method for mapping cortical connections of primate amygdala

Affiliations

Infrared neural stimulation with 7T fMRI: A rapid in vivo method for mapping cortical connections of primate amygdala

Sunhang Shi et al. Neuroimage. .

Abstract

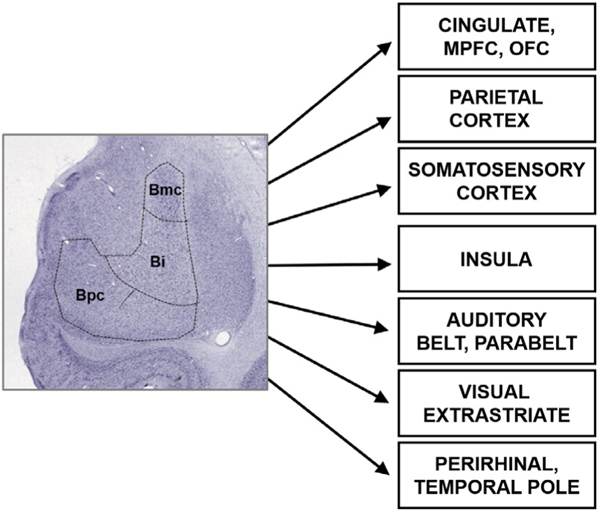
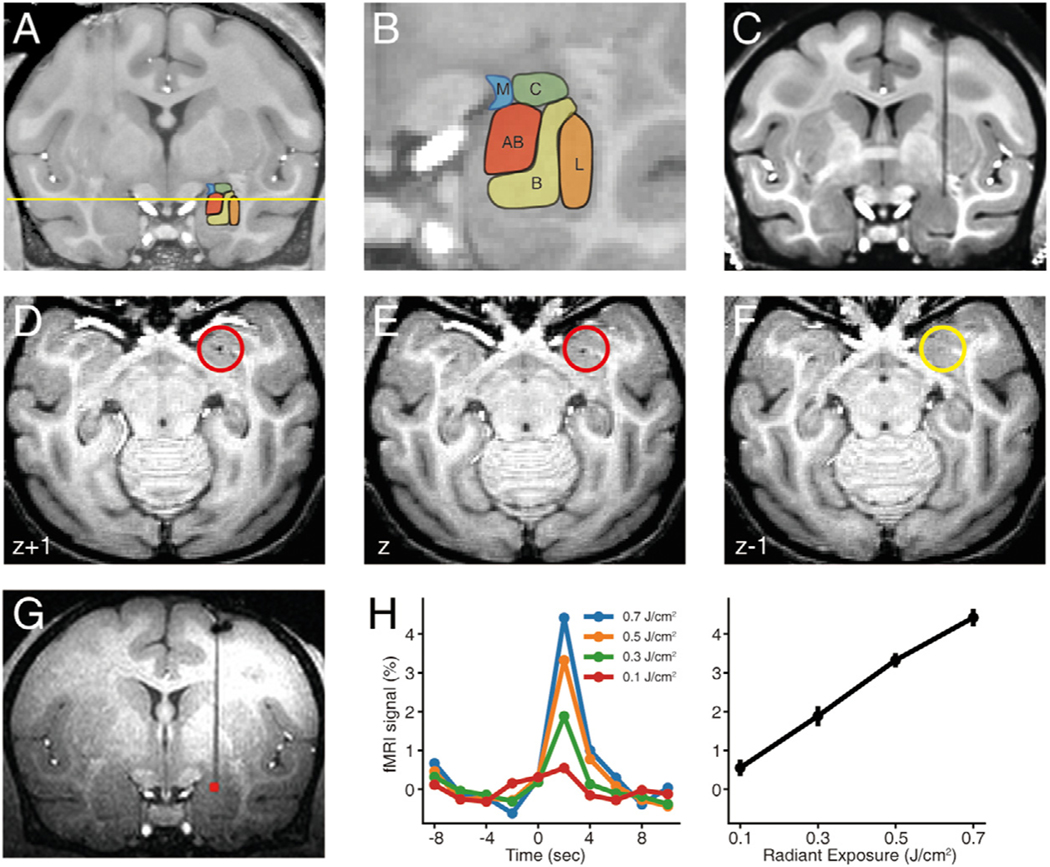
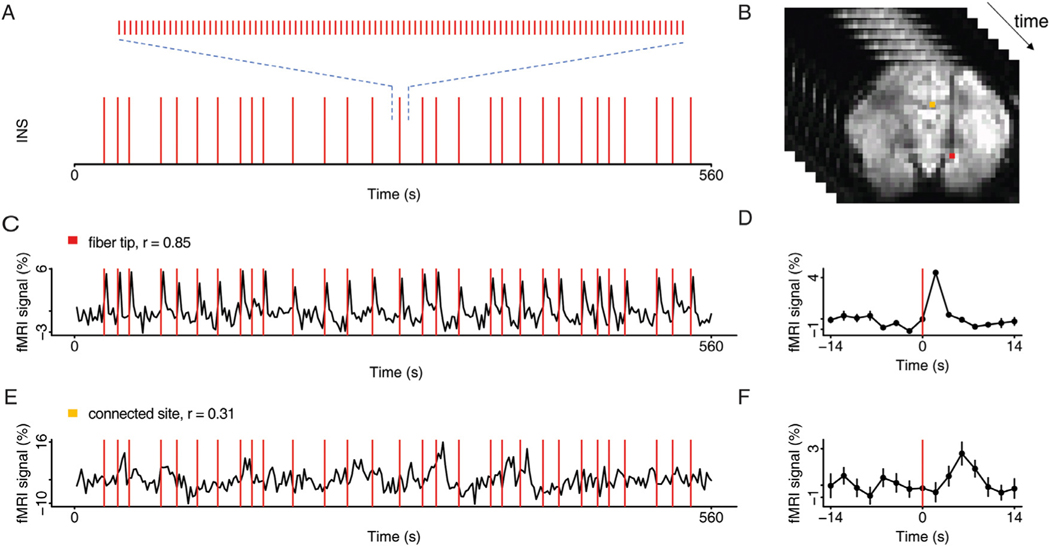
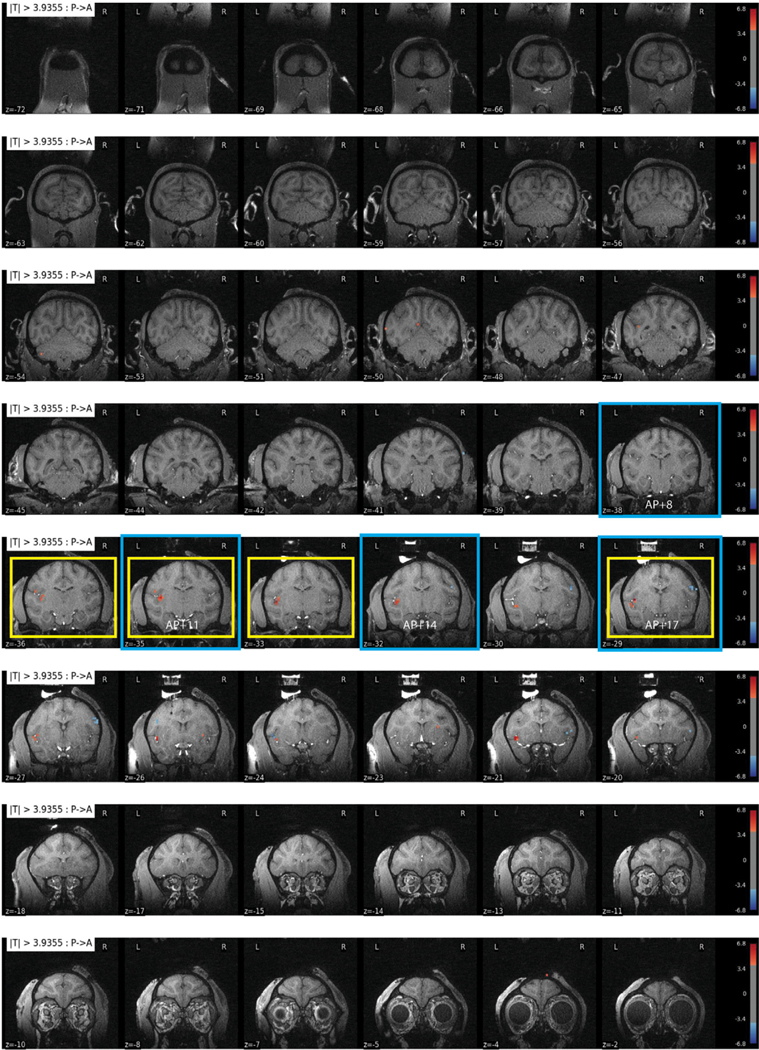
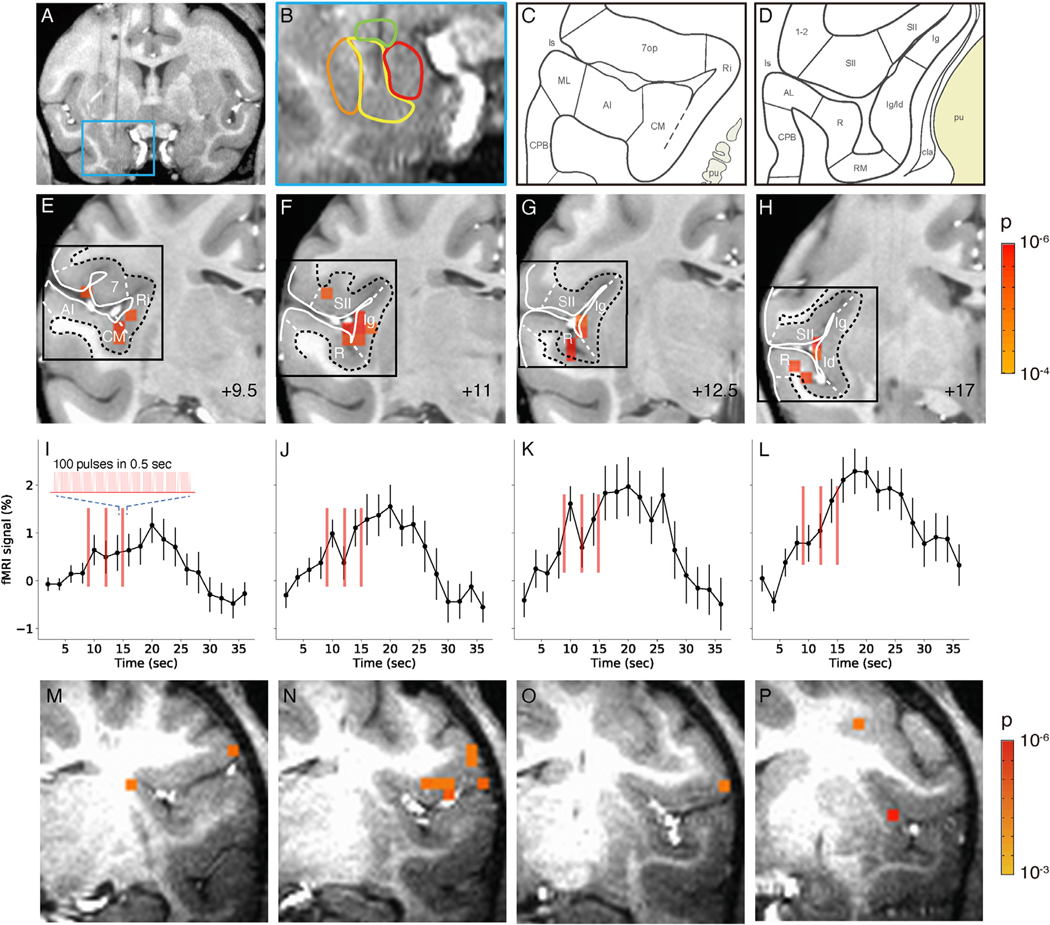
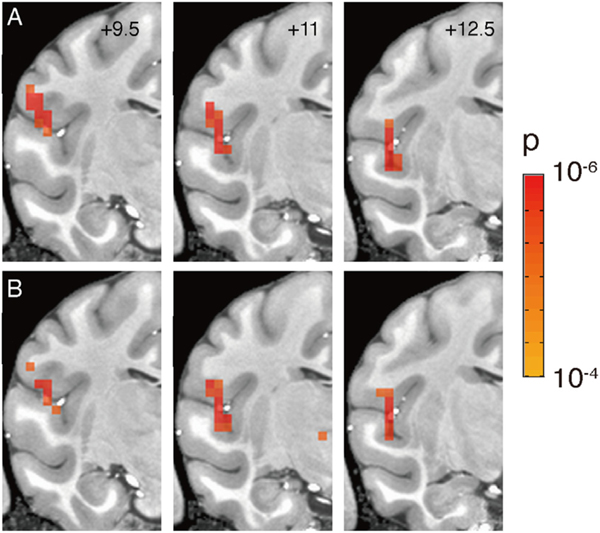
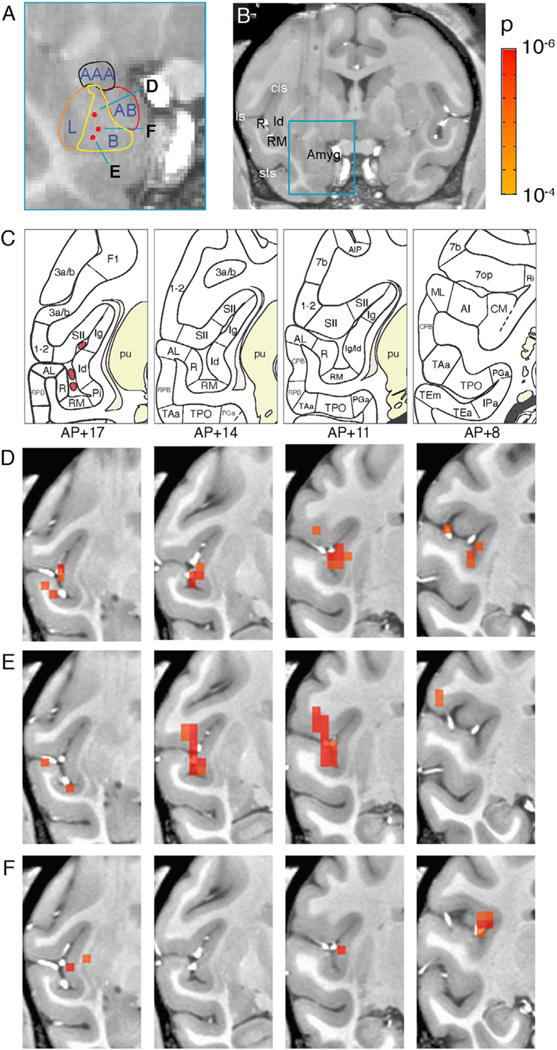
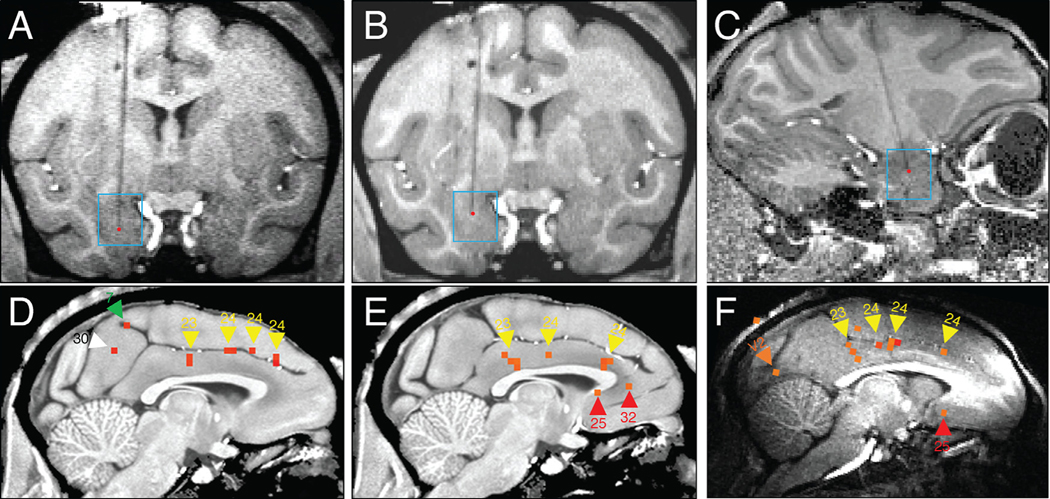
We have previously shown that INS-fMRI is a rapid method for mapping mesoscale brain networks in the macaque monkey brain. Focal stimulation of single cortical sites led to the activation of connected cortical locations, resulting in a global connectivity map. Here, we have extended this method for mapping brainwide networks following stimulation of single subcortical sites. As a testbed, we focused on the basal nucleus of the amygdala in the macaque monkey. We describe methods to target basal nucleus locations with submillimeter precision, pulse train stimulation methods, and statistical tests for assessing non-random nature of activations. Using these methods, we report that stimulation of precisely targeted loci in the basal nucleus produced sparse and specific activations in the brain. Activations were observed in the insular and sensory association cortices as well as activations in the cingulate cortex, consistent with known anatomical connections. What is new here is that the activations were focal and, in some cases, exhibited shifting topography with millimeter shifts in stimulation site. The precision of the method enables networks mapped from different nearby sites in the basal nucleus to be distinguished. While further investigation is needed to improve the sensitivity of this method, our analyses do support the reproducibility and non-random nature of some of the activations. We suggest that INS-fMRI is a promising method for mapping large-scale cortical and subcortical networks at high spatial resolution.

Keywords: Basal nucleus of the amygdala; Connectome; Functional tract tracing; High spatial resolution; Infrared neural stimulation; Macaque monkey; Mesoscale.


Conflict of interest statement

Declaration of Competing Interest None.

Figures

Fig. 1.
Fig. 1.
Connections of the basal nucleus of the amygdala in the macaque monkey. References are listed in Supplementary information Appendix A.
Fig. 2.
Fig. 2.. Anatomical localization and intensity-dependence of INS stimulation.
A-B. Amygdala nuclei in macaque monkey. Labels: L, B, AB, C, and M stand for the lateral, basal, accessory basal, central and medial nuclei of the amygdala respectively. C-F. Localization of fiber tip. C: determination of fiber position shown in coronal plane. d -F: The depth of fiber tip was localized in the ventralmost horizontal section (E) with visible signal dropout due to the laser tip (red circle: location of tip) (signal dropout is absent in F). In this example, the tip is in the magnocellular subdivision of the basal nucleus of the amygdala (depth indicated by yellow line in A). G. Activation at the laser tip, 0.3 J/cm2. H. Intensity dependence. Left: Time courses of the fMRI signals at the laser tip. As previously described (Xu et al., 2019), at the laser tip, peaks occur at a latency of ~2 s from stimulation onset. Right: Relationship between laser intensity and peak response amplitude at fiber tip. Error bars: SEM. (For interpretation of the references to color in this figure legend, the reader is referred to the web version of this article.)
Fig. 3.
Fig. 3.. INS stimulation paradigm.
A. Temporal distribution of INS pulse trains triggered at random onsets. Each pulse train (0.5 s, 200hz, 250us/pulse) consists of 100 laser pulses (shown expanded above). B. Example of functional images acquired over time, with highlights of the activated voxels at the stimulation site (red voxel) and at the presumed connected site (orange voxel) (p < 0.001). C. Time course of the fMRI signals at the laser tip in response to stimulation in A (red voxel in B). Stimulation timepoints (red lines) superimposed on BOLD trace. Correlation values (r) indicated above each trace. D. Time course averaged over repetitions (in C). E. Time course of the fMRI signals at a presumed connected site in response to stimulation in A (orange voxel in B). F. Time course averaged over repetitions (in E). Error bars: SEM. Stimulation intensity 0.5 J/cm2. (For interpretation of the references to color in this figure legend, the reader is referred to the web version of this article.)
Fig. 4.
Fig. 4.
All slices from a stimulation site in basal nucleus of the amygdala in Monkey M. Site 28 stimulation (0.1 J/cm2, p < 0.0001, FDR 5.5%); this site contributed to Fig. 5E–H and Fig. 7D (slices outlined in yellow and blue, respectively). (For interpretation of the references to color in this figure legend, the reader is referred to the web version of this article.)
Fig. 5.
Fig. 5.. Activation in insula and lateral sulcal areas elicited by stimulation of the basal nucleus of the amygdala.
A-L. Monkey M. M-P. Monkey Y. A-B. Stimulation site in intermediate zone of the basal nucleus. C-D. Schematics of cortical areas in the lateral sulcus, including insular cortical areas. insula: lg, ld, Ri. Auditory areas: AI, CM, ML, R, RM. Somatosensory areas: SII, 1–2. (Saleem and Logothetis, 2012) E-H. Activations within the lateral sulcus from posterior (+9.5) to anterior (+17) (9.5 mm, 11 mm, 12,5 mm,17 mm, respectively). Voxels: p < 0.0001 (FDR 5.5%). Black box: approximate regions shown in C-D. I-L: Associated time courses of fMRI signal in E-H (mean of significant voxels). Inset: enlarged schematic of each stimulus train (red line). Stimulation: block design, 0.1 J/cm2. Error bars: SEM. M-P. Activations within the lateral sulcus are seen in monkey Y. Voxels: p < 0.001.
Fig. 6.
Fig. 6.. Reliability of activation patterns.
Half-trial (total n = 20) comparisons of activation following focal stimulation from a single site in the basal nucleus of amygdala (site E in Fig. 7, block design, 0.1 J/cm2). A-B. Three consecutive sections (AP: +9.5, +11, +12.5) showing activation maps obtained from 10 odd (A) and 10 even (B) trials. (p < 0.0001, FDR 6.7%).
Fig. 7.
Fig. 7.. Topography of cortical connectivity with basal nucleus of amygdala.
A-B. Estimated nuclear boundaries in the amygdala and the anatomical location of three stimulation sites shown as red dots and marked as D, E, and F. C. Parcellation of the insula and the surrounding temporal sulcal areas based on the Saleem and Logothetis atlas. D-F. Series of coronal activation maps corresponding to the stimulation sites D, E, and F in the basal nucleus (panel A). The maps are arranged from left to right in an anterior-to-posterior progression (AP: +17, +14, +11, +8). Voxels thresholded at p < 0.0001 (FDR D: 5.5%, E: 14%, F: 6.7%). Stimulation: block design, 0.1 J/cm2.
Fig. 8.
Fig. 8.. Focal and patchy nature of remote responses.
Stimulation of basal nucleus in amygdala induces responses in the ipsilateral cingulate cortex. 3 examples shown. A-C. Stimulation sites (red dots) of D,E,F, respectively. D-F: Activations in cingulate. D: Monkey M site #46 (GLM p < 0.0001, FDR 11.6%), E: Monkey M site #27 (permutation p < 0.002; also see Supp Fig. 1). F: Monkey Y (GLM p < 0.001). Activations indicated by arrowheads: Yellow (cingulate 23, 24), White (retrosplenial 29/30), Red (medial prefrontal 25, 32), Orange (visual V2). Monkey M block design, 0.1 J/cm2. Monkey Y event-related design, 0.1 J/cm2.

References

    1. Amaral D, Price J, Pitkanen A, Carmichael ST, 1992. Anatomical organization of the primate amygdaloid complex, in the Amygdala: neurobiological aspects of emotion, memory, and mental dysfunction. Ed. J Aggleton 1–66.
    1. Amaral DG, Price JL, 1984. Amygdalo-cortical projections in the monkey (Macaca fascicularis). J. Comp. Neurol 230, 465–496. doi: 10.1002/cne.902300402. - DOI - PubMed
    1. Andersson JLR, Skare S, Ashburner J, 2003. How to correct susceptibility distortions in spin-echo echo-planar images: application to diffusion tensor imaging. Neuroimage 20, 870–888. doi: 10.1016/S1053-8119(03)00336-7. - DOI - PubMed
    1. Barbas H, 2007. Flow of information for emotions through temporal and orbitofrontal pathways. J. Anat 237–249. doi: 10.1111/j.1469-7580.2007.00777.x. - DOI - PMC - PubMed
    1. Barbas H, de Olmos J, 1990. Projections from the amygdala to basoventral and mediodorsal prefrontal regions in the rhesus monkey. J. Comp. Neurol 300, 549–571. doi: 10.1002/cne.903000409. - DOI - PubMed

Publication types