

The monitoring of vancomycin: a systematic review and meta-analyses of area under the concentration-time curve-guided dosing and trough-guided dosing
- PMID: 33549035
- PMCID: PMC7866743
- DOI: 10.1186/s12879-021-05858-6
The monitoring of vancomycin: a systematic review and meta-analyses of area under the concentration-time curve-guided dosing and trough-guided dosing
Abstract
Background: This systematic review and meta-analysis explored the relationship between vancomycin (VCM) monitoring strategies and VCM effectiveness and safety.
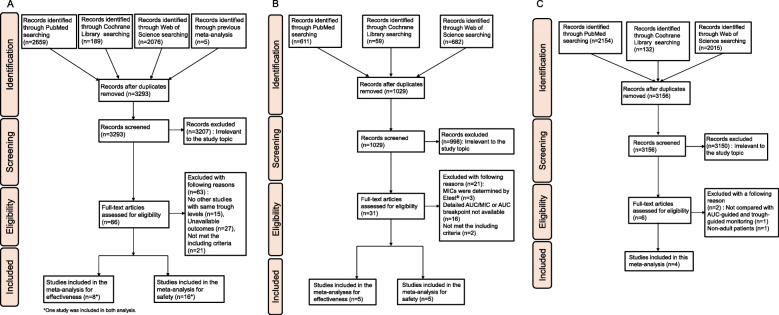
Methods: We conducted our analysis using the MEDLINE, Web of Sciences, and Cochrane Register of Controlled Trials electronic databases searched on August 9, 2020. We calculated odds ratios (ORs) and 95% confidence intervals (CIs).
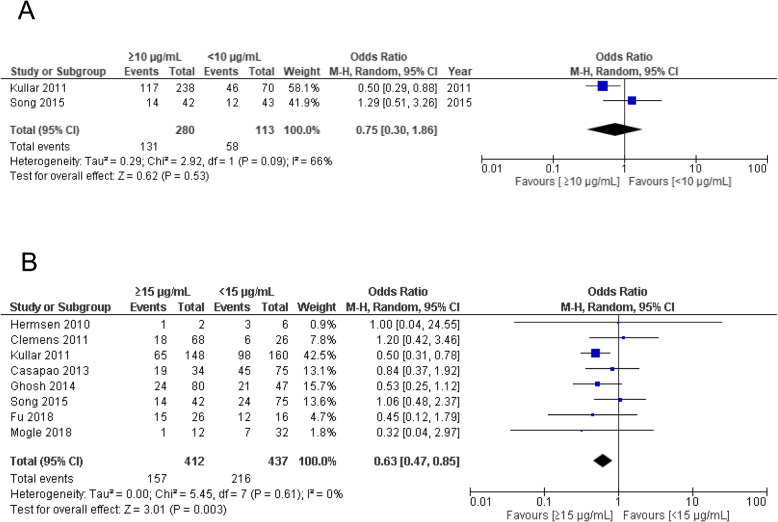
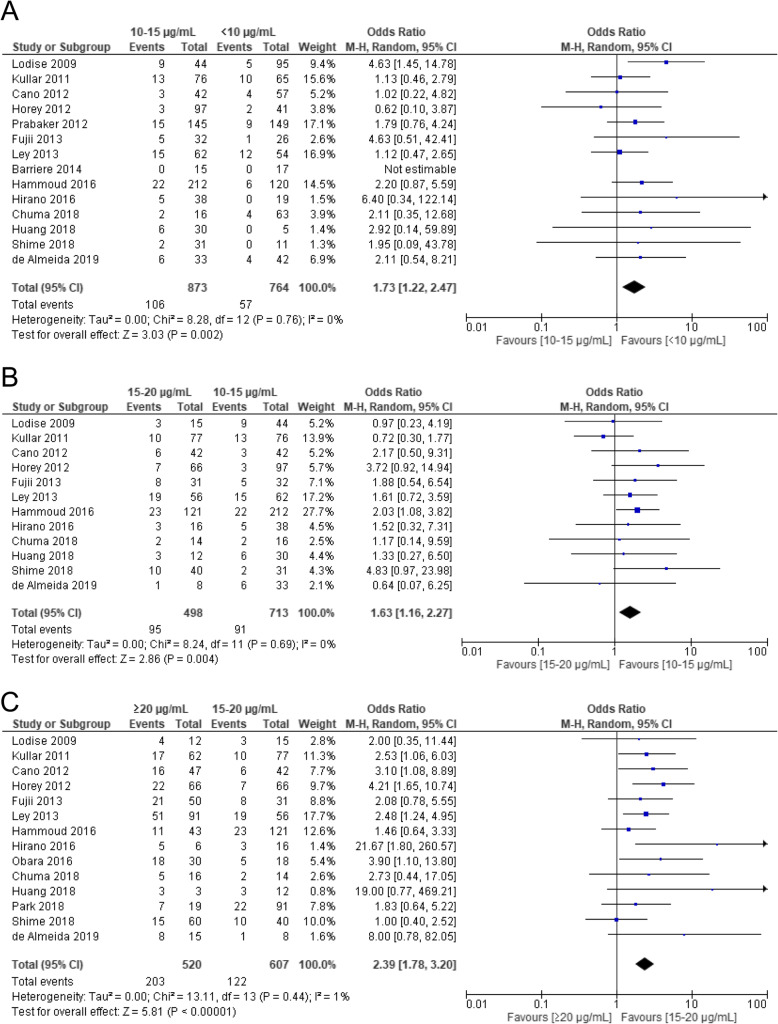
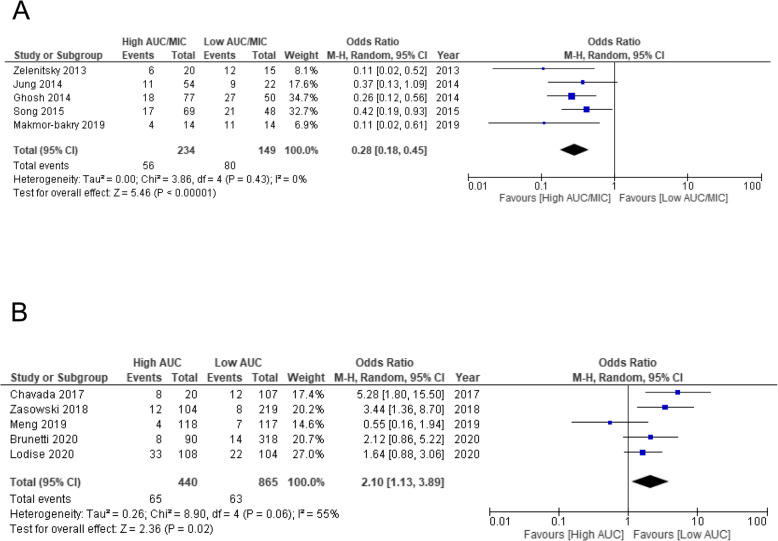
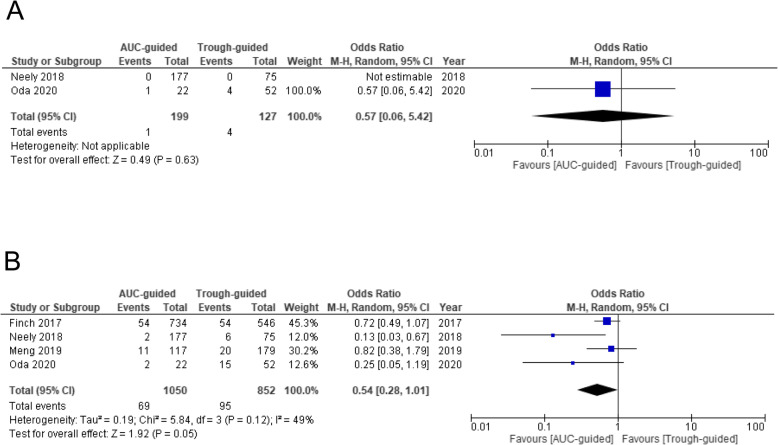
Results: Adult patients with methicillin-resistant Staphylococcus aureus (MRSA) bacteraemia with VCM trough concentrations ≥15 μg/mL had significantly lower treatment failure rates (OR 0.63, 95% CI 0.47-0.85). The incidence of acute kidney injury (AKI) increased with increased trough concentrations and was significantly higher for trough concentrations ≥20 μg/mL compared to those at 15-20 μg/mL (OR 2.39, 95% CI 1.78-3.20). Analysis of the target area under the curve/minimum inhibitory concentration ratios (AUC/MIC) showed significantly lower treatment failure rates for high AUC/MIC (cut-off 400 ± 15%) (OR 0.28, 95% CI 0.18-0.45). The safety analysis revealed that high AUC value (cut-off 600 ± 15%) significantly increased the risk of AKI (OR 2.10, 95% CI 1.13-3.89). Our meta-analysis of differences in monitoring strategies included four studies. The incidence of AKI tended to be lower in AUC-guided monitoring than in trough-guided monitoring (OR 0.54, 95% CI 0.28-1.01); however, it was not significant in the analysis of mortality.
Conclusions: We identified VCM trough concentrations and AUC values that correlated with effectiveness and safety. Furthermore, compared to trough-guided monitoring, AUC-guided monitoring showed potential for decreasing nephrotoxicity.
Keywords: AUC; Meta-analysis; Nephrotoxicity; Trough; Vancomycin.
Conflict of interest statement
MT, HM, NK, YM, ST, SO, YE, KT, SF, YT1, YH, and TK report no conflicts of interest. YT2 received research grants from Dainippon Sumitomo Pharm Co., Ltd., Astellas Pharm, Inc., and MSD Japan. KM received a research grant from Meiji Seika Pharma Co., Ltd.
Figures
References
-
- Liu C, Bayer A, Cosgrove SE, Daum RS, Fridkin SK, Gorwitz RJ, et al. Clinical practice guidelines by the Infectious Diseases Society of America for the treatment of methicillin-resistant Staphylococcus aureus infections in adults and children: executive summary. Clin Infect Dis. 2011;52:285–292. doi: 10.1093/cid/cir034. - DOI - PubMed
-
- Rybak MJ, Le J, Lodise TP, Levine DP, Bradley JS, Liu C, et al. Therapeutic monitoring of vancomycin for serious methicillin-resistant Staphylococcus aureus infections: a revised consensus guideline and review by the American Society of Health-System Pharmacists, the Infectious Diseases Society of America, the Pediatr. Am J Health Syst Pharm. 2020;77:835–864. doi: 10.1093/ajhp/zxaa036. - DOI - PubMed
-
- Matsumoto K, Takesue Y, Ohmagari N, Mochizuki T, Mikamo H, Seki M, et al. Practice guidelines for therapeutic drug monitoring of vancomycin: a consensus review of the Japanese Society of Chemotherapy and the Japanese Society of Therapeutic Drug Monitoring. J Infect Chemother. 2013;19:365–380. doi: 10.1007/s10156-013-0599-4. - DOI - PubMed
Publication types
MeSH terms
Substances
LinkOut - more resources
Full Text Sources
Other Literature Sources
Medical
