

Comparative cost-effectiveness of SARS-CoV-2 testing strategies in the USA: a modelling study
- PMID: 33549196
- PMCID: PMC7862022
- DOI: 10.1016/S2468-2667(21)00002-5
Comparative cost-effectiveness of SARS-CoV-2 testing strategies in the USA: a modelling study
Abstract
Background: To mitigate the COVID-19 pandemic, countries worldwide have enacted unprecedented movement restrictions, physical distancing measures, and face mask requirements. Until safe and efficacious vaccines or antiviral drugs become widely available, viral testing remains the primary mitigation measure for rapid identification and isolation of infected individuals. We aimed to assess the economic trade-offs of expanding and accelerating testing for severe acute respiratory syndrome coronavirus 2 (SARS-CoV-2) across the USA in different transmission scenarios.
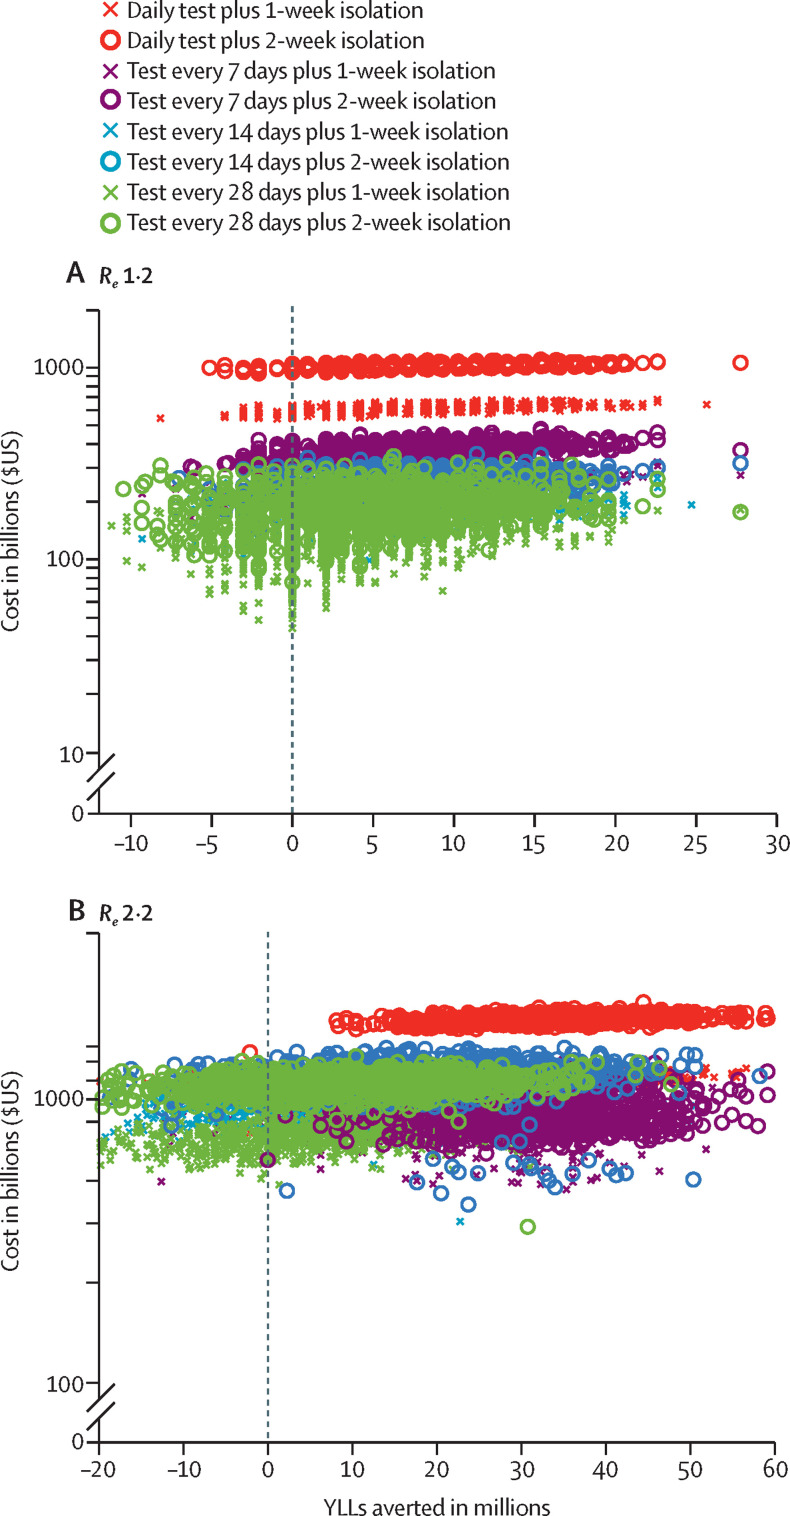
Methods: We used a multiscale model that incorporates SARS-CoV-2 transmission at the population level and daily viral load dynamics at the individual level to assess eight surveillance testing strategies that varied by testing frequency (from daily to monthly testing) and isolation period (1 or 2 weeks), compared with the status-quo strategy of symptom-based testing and isolation. For each testing strategy, we first estimated the costs (incorporating costs of diagnostic testing and admissions to hospital, and salary lost while in isolation) and years of life lost (YLLs) prevented under rapid and low transmission scenarios. We then assessed the testing strategies across a range of scenarios, each defined by effective reproduction number (Re), willingness to pay per YLL averted, and cost of a test, to estimate the probability that a particular strategy had the greatest net benefit. Additionally, for a range of transmission scenarios (Re from 1·1 to 3), we estimated a threshold test price at which the status-quo strategy outperforms all testing strategies considered.
Findings: Our modelling showed that daily testing combined with a 2-week isolation period was the most costly strategy considered, reflecting increased costs with greater test frequency and length of isolation period. Assuming a societal willingness to pay of US$100 000 per YLL averted and a price of $5 per test, the strategy most likely to be cost-effective under a rapid transmission scenario (Re of 2·2) is weekly testing followed by a 2-week isolation period subsequent to a positive test result. Under low transmission scenarios (Re of 1·2), monthly testing of the population followed by 1-week isolation rather than 2-week isolation is likely to be most cost-effective. Expanded surveillance testing is more likely to be cost-effective than the status-quo testing strategy if the price per test is less than $75 across all transmission rates considered.
Interpretation: Extensive expansion of SARS-CoV-2 testing programmes with more frequent and rapid tests across communities coupled with isolation of individuals with confirmed infection is essential for mitigating the COVID-19 pandemic. Furthermore, resources recouped from shortened isolation duration could be cost-effectively allocated to more frequent testing.
Funding: US National Institutes of Health, US Centers for Disease Control and Prevention, and Love, Tito's.
Copyright © 2021 The Author(s). Published by Elsevier Ltd. This is an Open Access article under the CC BY-NC-ND 4.0 license. Published by Elsevier Ltd.. All rights reserved.
Figures


References
-
- Wan W. The Washington Post; March 11, 2020. WHO declares a pandemic of coronavirus disease COVID-19.https://www.washingtonpost.com/health/2020/03/11/who-declares-pandemic-c...
-
- COVID-19 dashboard by the Center for Systems Science and Engineering (CSSE) at Johns Hopkins University (JHU) https://gisanddata.maps.arcgis.com/apps/opsdashboard/index.html#/bda7594...
-
- O'Neill M. Economic pain: COVID-19 pandemic will cost global economy $21 trillion. https://scitechdaily.com/economic-pain-covid-19-pandemic-will-cost-globa...
-
- Zimmer C, Corum J, Wee S-L. The New York Times; June 10, 2020. Coronavirus vaccine tracker.https://www.nytimes.com/interactive/2020/science/coronavirus-vaccine-tra...
Publication types
MeSH terms
Grants and funding
LinkOut - more resources
Full Text Sources
Other Literature Sources
Medical
Miscellaneous
