. 2021 Jul;160(1):199-208.
doi: 10.1016/j.chest.2021.01.077. Epub 2021 Feb 5.

Ultra-Small Lung Cysts Impair Diffusion Without Obstructing Air Flow in Lymphangioleiomyomatosis

Affiliations

Ultra-Small Lung Cysts Impair Diffusion Without Obstructing Air Flow in Lymphangioleiomyomatosis

Brianna P Matthew et al. Chest. 2021 Jul.

Abstract

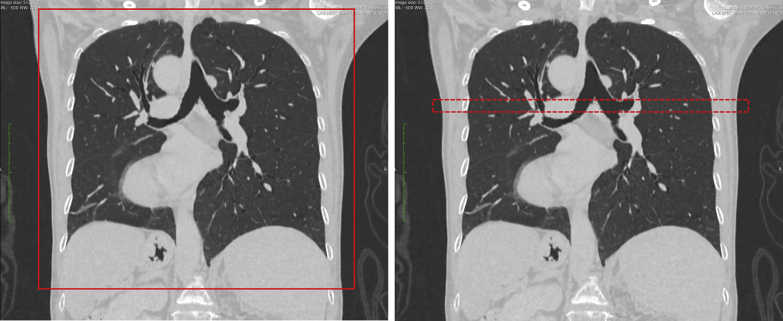
Background: Lymphangioleiomyomatosis (LAM) is a rare lung disease found primarily in women of childbearing age, characterized by the formation of air-filled cysts, which may be associated with reductions in lung function. An experimental, regional ultra-high resolution CT scan identified an additional volume of cysts relative to standard chest CT imaging, which consisted primarily of ultra-small cysts.

Research question: What is the impact of these ultra-small cysts on the pulmonary function of patients with LAM?

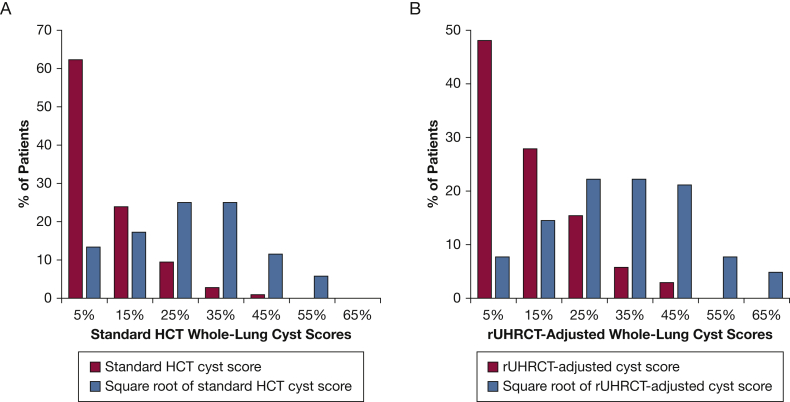
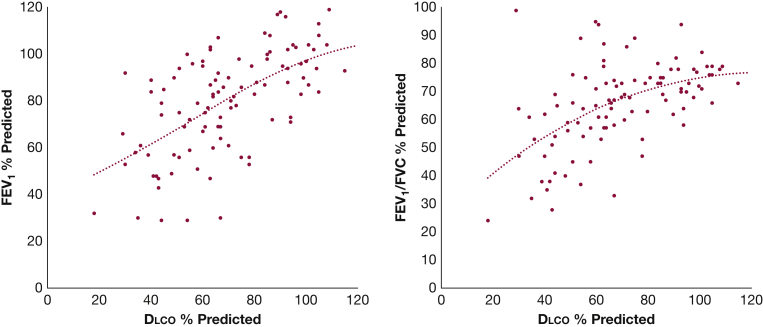
Study design and methods: A group of 103 patients with LAM received pulmonary function tests and a CT examination in the same visit. Cyst score, the percentage lung volume occupied by cysts, was measured by using commercial software approved by the US Food and Drug Administration. The association between cyst scores and pulmonary function tests of diffusing capacity of the lungs for carbon monoxide (Dlco) (% predicted), FEV1 (% predicted), and FEV1/FVC (% predicted) was assessed with statistical analysis adjusted for demographic variables. The distributions of average cyst size and ultra-small cyst fraction among the patients were evaluated.

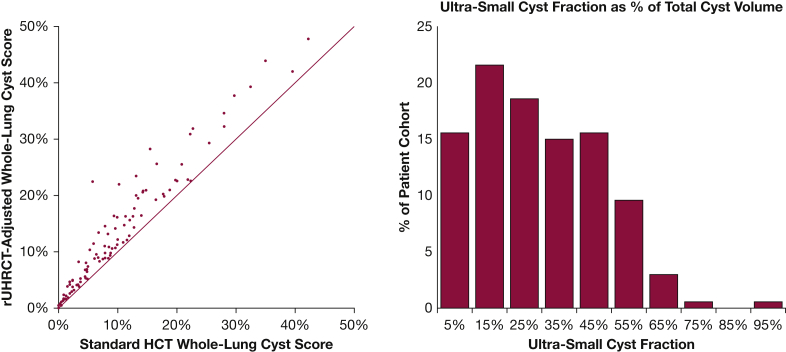
Results: The additional cyst volume identified by the experimental, higher resolution scan consisted of cysts of 2.2 ± 0.8 mm diameter on average and are thus labeled the "ultra-small cyst fraction." It accounted for 27.9 ± 19.0% of the total cyst volume among the patients. The resulting adjusted, whole-lung cyst scores better explained the variance of Dlco (P < .001 adjusted for multiple comparisons) but not FEV1 and FEV1/FVC (P = 1.00). The ultra-small cyst fraction contributed to the reduction in Dlco (P < .001) but not to FEV1 and FEV1/FVC (P = .760 and .575, respectively). The ultra-small cyst fraction and average cyst size were correlated with cyst burden, FEV1, and FEV1/FVC but less with Dlco.

Interpretation: The ultra-small cysts primarily contributed to the reduction in Dlco, with minimal effects on FEV1 and FEV1/FVC. Patients with lower cyst burden and better FEV1 and FEV1/FVC tended to have smaller average cyst size and higher ultra-small cyst fraction.

Clinical trial registration: ClinicalTrials.gov; No.: NCT00001465; URL: www.clinicaltrials.gov.


Figures

Figure 1
Figure 1
Screenshots from the scanner console showing the coverage of the standard helical chest CT scan on the left and the research regional, ultra-high resolution CT scan on the right. In these coronal projection views, the standard scan covers the entire chest, shown by the red rectangle in the left image; the regional, ultra-high resolution CT scan covers a mid-segment of the chest of 20 mm length (dotted red rectangle in the right image).
Figure 2
Figure 2
A-D, Cross-sectional images of the right lung of a patient with lymphangioleiomyomatosis and corresponding cyst segmentation maps, illustrating the additional cyst volume identified by the regional ultra-high resolution scan (rUHRCT). A-B, Images from the standard helical chest CT scan and the rUHRCT scan, respectively. C-D, Cyst segmentation maps corresponding to the images in panels A and B, respectively. The cystic areas are highlighted with light gray pixels. The segmentation was generated semi-automatically by a US Food and Drug Administration-approved commercial software provided by the scanner manufacturer. D, Additional cystic areas compared with those in panel C. The addition can be divided into two types with opposing effects on the average cyst size. The first type were cysts that were either entirely missed or missing most of their volumes in panel C, as exemplified by those in the areas outlined by the blue polygons and red circles, and others dispersed in the rest of the maps. Those in the red circles are adjacent to larger cysts and appear connected to their larger neighbors in panel D. This type is primarily small cysts, which shift the average cyst size downward (smaller). The second type of addition came from better resolution of the borders of larger cysts, resulting in proportional enlargement of the segmented areas, as exemplified by the cysts in the yellow dotted rectangles. This type shifts the average cyst size upward (larger). Measurements of average cyst sizes (Fig 6) showed that the first type (small cysts) dominated the additional cyst volume identified by using the rUHRCT scan.
Figure 3
Figure 3
Comparison of the adjusted whole-lung cyst score based on the rUHRCT scan and the standard whole-lung cyst score from the standard chest CT scan. The two scores of all patients are shown in the scatter plot on the left. The solid line is the line of equality. The rUHRCT scan identified additional cyst volumes in all but two patients who had very low cyst burden (cyst score < 0.6%). The additional cyst volume as a percentage of the total cyst volume, or the ultra-small cyst fraction, had a broad distribution among the cohort, as shown by the histogram on the right. HCT = standard helical chest CT; rUHRCT = regional ultra-high resolution CT.
Figure 4
Figure 4
A-B, Distribution of whole-lung cyst scores prior to and following square root transformation. A, Histogram distributions of cyst scores from the standard chest CT scan. B, Histogram distributions of cyst scores based on the rUHRCT scan. The square root transformation reduces the asymmetry in the distributions of the cyst scores. HCT = standard helical chest CT; rUHRCT = regional ultra-high resolution CT.
Figure 5
Figure 5
Relationship between pulmonary function tests among the patient cohort. Dlco (% predicted) vs FEV1 (% predicted) is shown in the scatter plot on the left, and vs the ratio of FEV1 to FVC (% predicted) in the plot on the right. The dotted lines are third-order polynomial fitting curves, which showed a trend of more shallow slopes at the high end of pulmonary function test values. Dlco = diffusion capacity of the lung for carbon monoxide.
Figure 6
Figure 6
Histogram distributions of cyst size measurements among the entire cohort. The average size of pulmonary cysts in each patient was measured. Distribution of the average cyst size from the standard chest CT scan is shown in gray bars, from the regional ultra-high resolution CT scan in blue bars, and of the additional cyst volume identified by the experimental rUHRCT scan (rUHRCT-standard) in red bars. The additional cyst volume had the smallest cyst size among the three and caused a downshift of the average cyst size of the total volume from the standard CT scan to the rUHRCT scan. rUHRCT = regional ultra-high resolution scan.
Figure 7
Figure 7
Comparing the influence of the ultra-small cyst fraction vs the rest of the cyst volume on the pulmonary function tests of Dlco (% predicted), FEV1 (% predicted), and FEV1/FVC (% predicted). The effects were measured as the reduction of pulmonary function test value per unit of cyst score. The error bars represent the SEM. The P values are for the null hypothesis that a cyst fraction has no effect on a pulmonary function test.

Similar articles

Cited by

References

    1. Hohman D.W., Noghrehkar D., Ratnayake S. Lymphangioleiomyomatosis: a review. Eur J Intern Med. 2008;19(5):319–324. - PubMed
    1. Taveira-DaSilva A.M., Steagall W.K., Moss J. Lymphangioleiomyomatosis. Atlas Genet Cytogenet Oncol Haematol. 2009;13(10):751–757. - PMC - PubMed
    1. Harknett E.C., Chang W.Y.C., Byrnes S. Use of variability in national and regional data to estimate the prevalence of lymphangioleiomyomatosis. QJM Int J Med. 2011;104(11):971–979. - PubMed
    1. Gupta N., Vassallo R., Wikenheiser-Brokamp K.A., McCormack F.X. Diffuse cystic lung disease. Part I. Am J Respir Crit Care Med. 2015;191(12):1354–1366. - PMC - PubMed
    1. Taveira-DaSilva A.M., Moss J. Clinical features, epidemiology, and therapy of lymphangioleiomyomatosis. Clin Epidemiol. 2015;7:249–257. - PMC - PubMed

Publication types

MeSH terms

Associated data