. 2021 Mar 18;49(5):2460-2487.
doi: 10.1093/nar/gkab046.

Restriction of an intron size en route to endothermy

Affiliations

Restriction of an intron size en route to endothermy

Jana Královičová et al. Nucleic Acids Res. .

Abstract

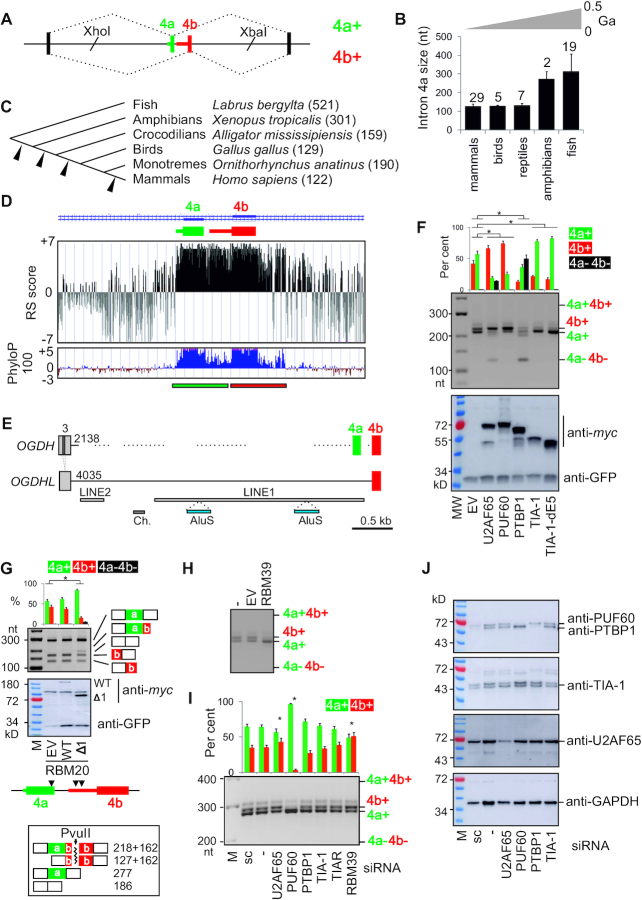
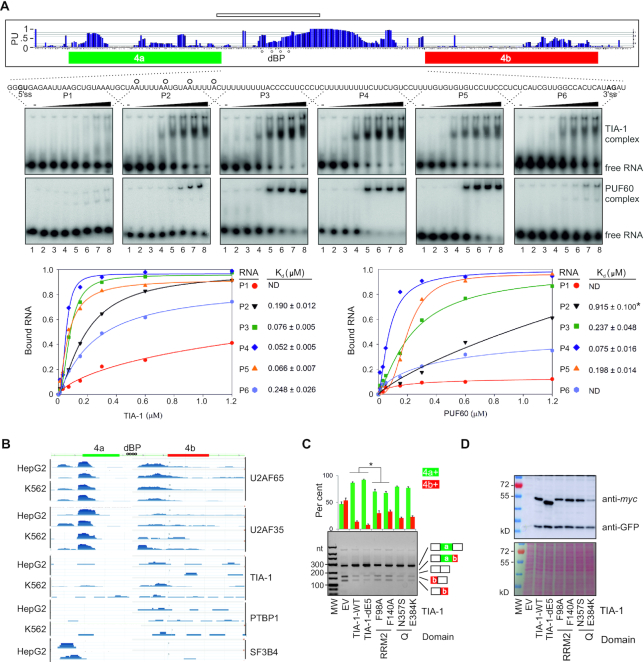
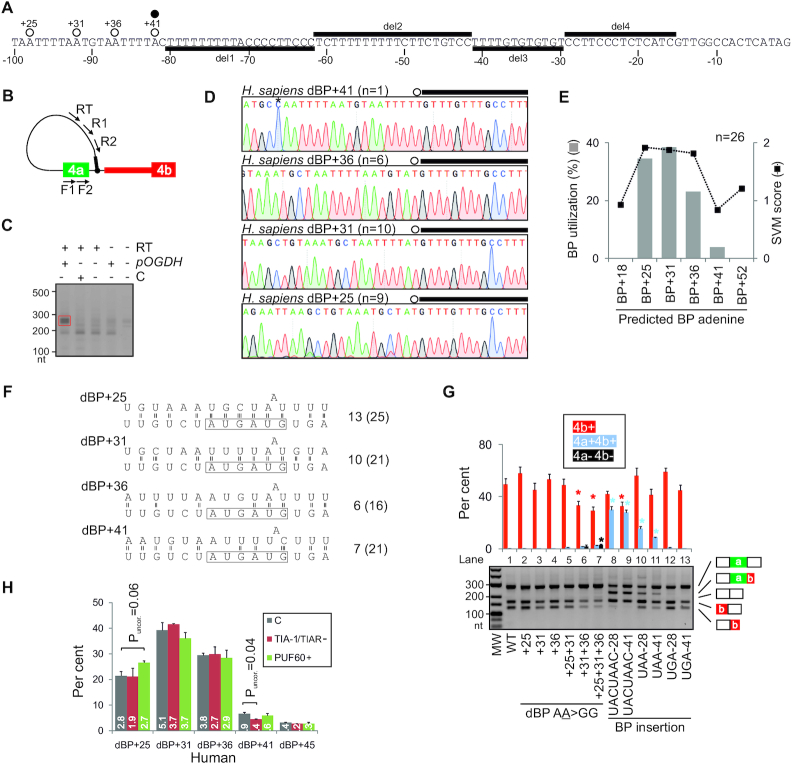
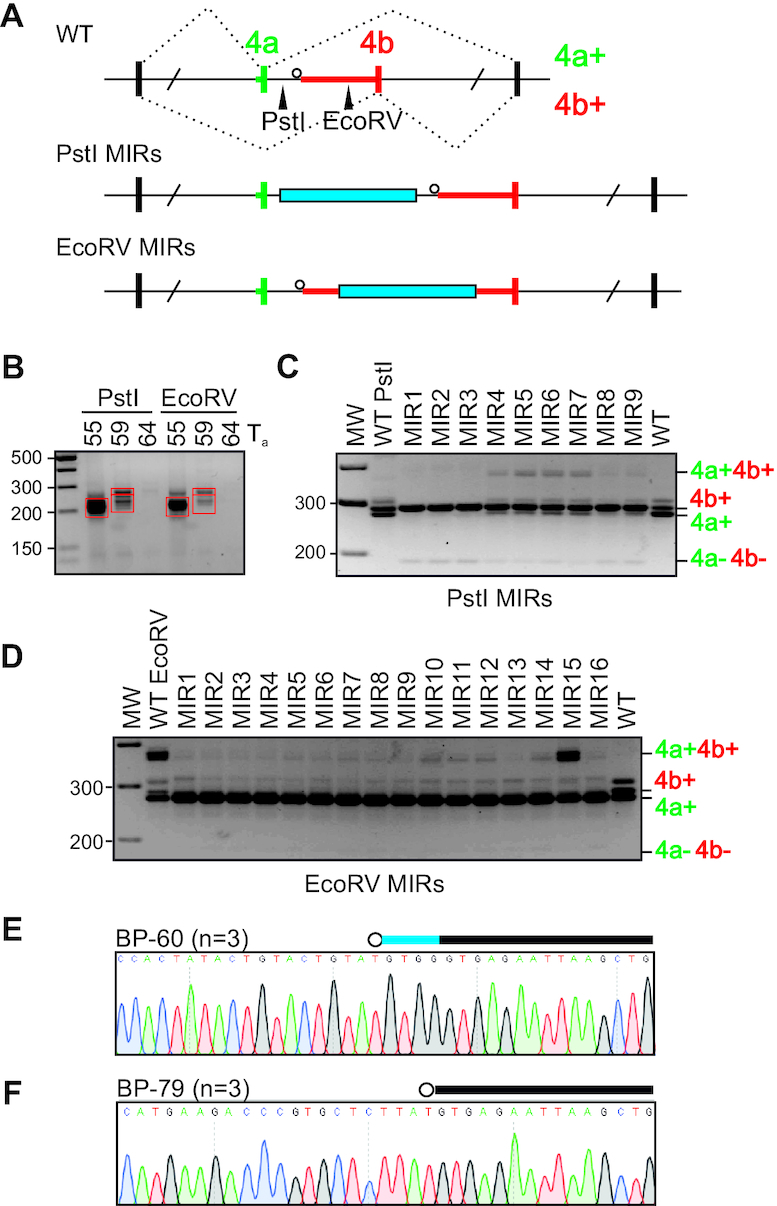
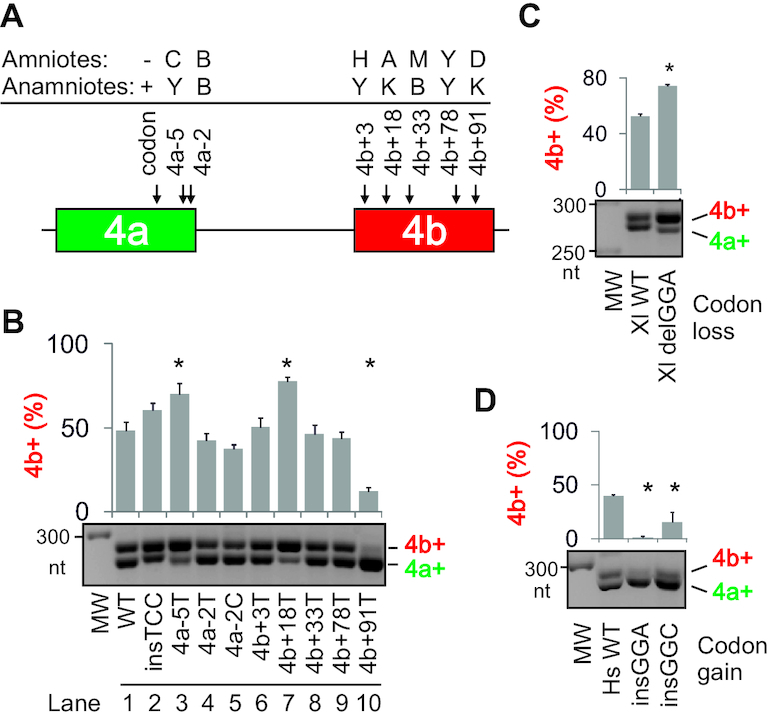
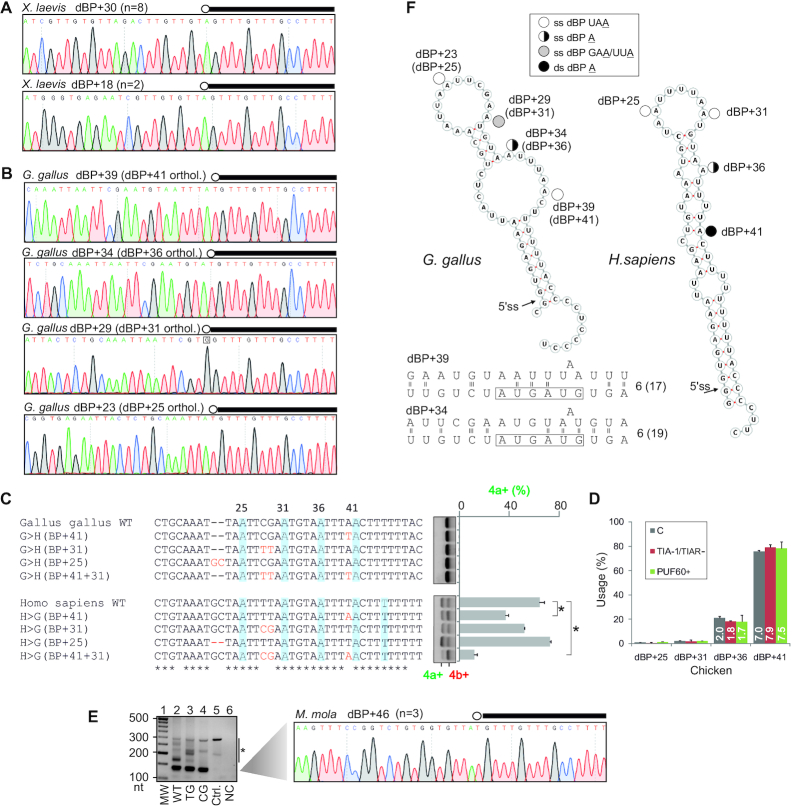
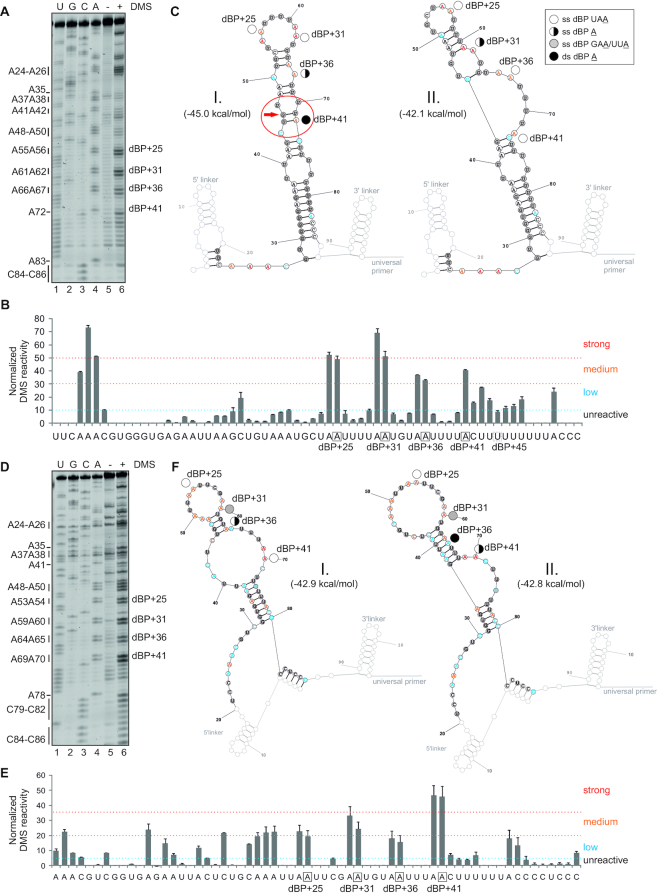
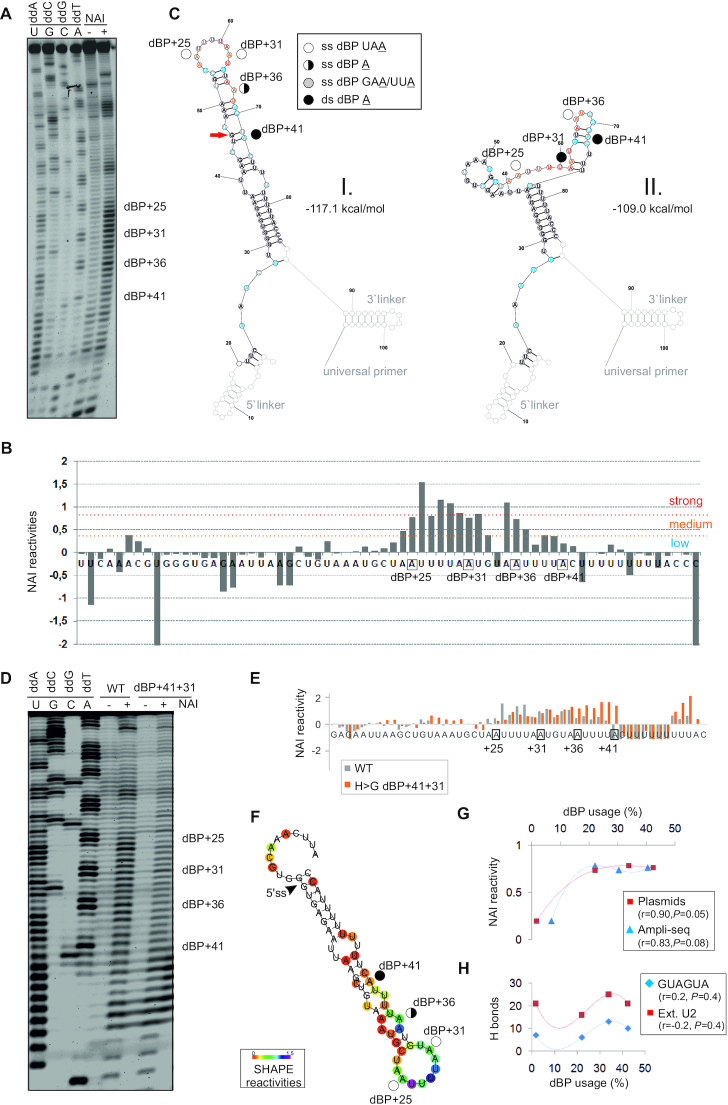
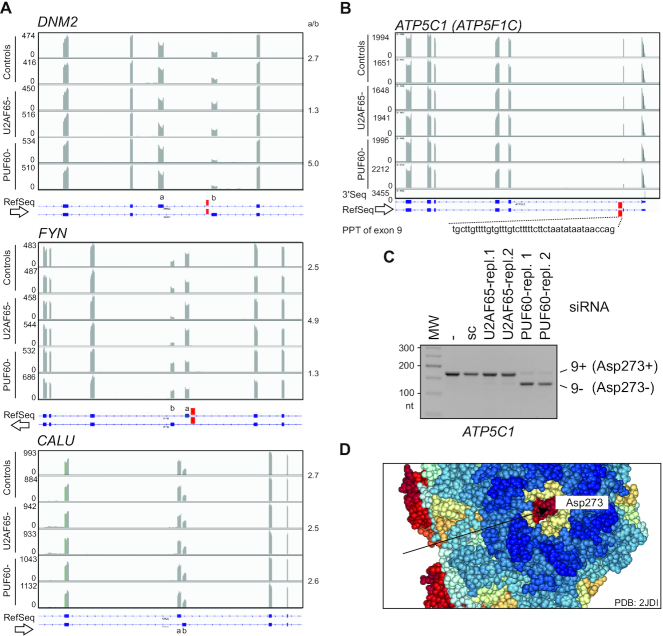
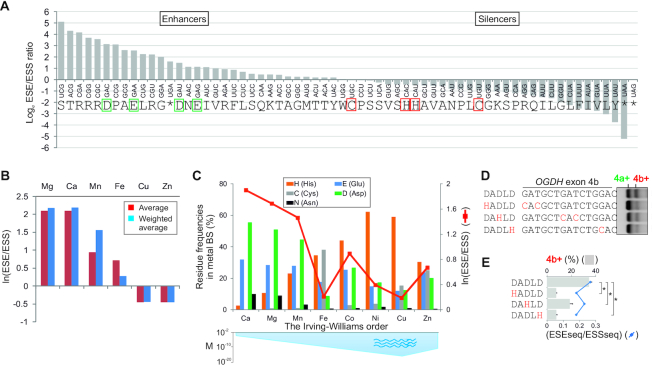
Ca2+-insensitive and -sensitive E1 subunits of the 2-oxoglutarate dehydrogenase complex (OGDHC) regulate tissue-specific NADH and ATP supply by mutually exclusive OGDH exons 4a and 4b. Here we show that their splicing is enforced by distant lariat branch points (dBPs) located near the 5' splice site of the intervening intron. dBPs restrict the intron length and prevent transposon insertions, which can introduce or eliminate dBP competitors. The size restriction was imposed by a single dominant dBP in anamniotes that expanded into a conserved constellation of four dBP adenines in amniotes. The amniote clusters exhibit taxon-specific usage of individual dBPs, reflecting accessibility of their extended motifs within a stable RNA hairpin rather than U2 snRNA:dBP base-pairing. The dBP expansion took place in early terrestrial species and was followed by a uridine enrichment of large downstream polypyrimidine tracts in mammals. The dBP-protected megatracts permit reciprocal regulation of exon 4a and 4b by uridine-binding proteins, including TIA-1/TIAR and PUF60, which promote U1 and U2 snRNP recruitment to the 5' splice site and BP, respectively, but do not significantly alter the relative dBP usage. We further show that codons for residues critically contributing to protein binding sites for Ca2+ and other divalent metals confer the exon inclusion order that mirrors the Irving-Williams affinity series, linking the evolution of auxiliary splicing motifs in exons to metallome constraints. Finally, we hypothesize that the dBP-driven selection for Ca2+-dependent ATP provision by E1 facilitated evolution of endothermy by optimizing the aerobic scope in target tissues.


Figures

Figure 1.
Figure 1.
Intron 4a as a regulator of OGDH MXEs and target for pyrimidine-binding proteins that control Ca2+-sensitive and -insensitive isoforms. (A) OGDH reporter construct. Introns are shown as horizontal lines, exons as boxes and spliced products (right) by dotted lines. MXEs are numbered at the top. Introns are numbered by their genomic location in the main text. The length of MXE PPTs is indicated by coloured horizontal bars. (B) Average size of intron 4a in vertebrate classes. Error bars are SDs. The number of species is indicated above each bar. Approximate evolutionary span is at the top (not to scale). Ga, giga-annum. (C) Intron 4a size in representative species (in nts). Arrowheads denote deletion events. (D) RS (rejected substitutions) scores (65) (upper panel) and PhyloP 100 vertebrates conservation (lower panel) of the MXE pair. Rectangles at the bottom denote a tentative exon duplication event. (E) TEs (horizontal bars) in OGDH and OGDHL introns 3 and 4a. Their size (in nts) in the reference genome is shown at their 5′ ends. Exons are numbered at the top. Dotted lines show regions weakly aligned with OGDHL. LINE, long interspersed elements; Ch., DNA transposon Charlie. (F) Regulation of OGDH MXEs by U-binding proteins. The OGDH reporter was cotransfected with expression constructs (bottom). OGDH mRNA isoforms (middle panel) are measured at the top. Error bars are SDs of two independent transfections. Asterisks denote significant P values (<0.05; ANOVA, Dunnett's post-hoc tests) for the indicated comparisons. MW, size marker; EV, empty vector. Immunoblot with lysates prepared from transfected cells is in the lower panel; antibodies are to the right. (G) RBM20 is a repressor of OGDH exon 4b. Here, RT-PCR products are cut with PvuII, which cleaves exon 4b; digested products and their sizes (in nts) are shown at the bottom. Coexpression of the OGDH reporter with RBM20 constructs is shown in the middle panel; arrowheads below denote the presence of optimal binding sites of RBM20 (UCUU) (81) located in the 5′ part of megaPPT (segment del2, Figure 2A) and in the 3′ part of exon 4a. Ogdh was identified among cardiomyocyte RBM20 HITS-CLIP targets (10 intronic reads) although no Ogdh exons were listed among high-confidence RBM20-regulated exons (FDR<0.05) identified by comparing Rbm20 (−/−) and WT rats (81). (HI) Opposite effects of RBM39 overexpression (H) and depletion (I, last lane) (40) on exon 4a/4b ratios. (I) Exon 4a/4b usage in HEK293 cells depleted of Y-binding proteins. sc, a scrambled control. Spliced products are measured at the top; error bars are SDs of two transfections. Asterisks show statistically significant deviations from controls (ANOVA with post-hoc Dunnett's tests). (J) Immunoblots for panel (I); antibodies are to the right.
Figure 2.
Figure 2.
MegaPPT as a binding platform for splicing factors reciprocally activating or inhibiting OGDH MXEs. (A) Preferential binding of TIA-1 and PUF60 to single-stranded megaPPTs in intron 4a in vitro. PU values (probability of unpaired) (69) are shown in the upper panel. Higher PU values predict unpaired, more accessible RNA bases (69). Human dBPs identified in Figure 3 are denoted by circles. RNA used for structural probing is denoted by a horizontal rectangle at the top. EMSA (middle panels) were carried out with 1 nM of oligoribonucleotides P1-P6 and zero, 0.01, 0.03, 0.07, 0.15, 0.3, 0.6 and 1.2 μM of each recombinant protein (lanes 1–8). Lower panels show graphical representations of bound fractions. TIA-1 Kd for probes P1–P6 inversely correlated with their uridine fractions (r = –0.85, P = 0.03, F-test). ND, not determined; *, derived from the linear equation. (B) Compilation of a subset of enhanced crosslinking and immunoprecipitation datasets (86) for the indicated cell lines (left) and proteins (right). (C) TIA-1 RRM2 substitutions of residues that contact RNA impair TIA-1-mediated activation of exon 4a. RNA products were treated with PvuII. Restriction fragments are shown in Figure 1G. Asterisk denotes P values <0.05 (ANOVA, Dunnett's post-hoc tests). Error bars are SDs of two independent replicates. (D) Immunoblots for the transfection experiment shown in panel C. Protein lysates (15 μg) visualized by Poncaeau staining (lower panel) were incubated with anti-GFP and anti-myc antibodies (upper panel).
Figure 3.
Figure 3.
OGDH transcripts employ redundant dBP adenines located near the 5′ss of exon 4a. (A) The last 100 nts of intron 4a. Newly mapped dBPs (open circles) are denoted by their distance from the 5′ss of intron 4a. A closed circle shows a low-confidence BP reported previously (97). Horizontal bars denote megaPPT deletions (del1–4) introduced in the WT OGDH reporter (tested in Supplementary Figure S5). (B) BP mapping primers (arrows). Their sequences are in Supplementary Table S1. Black bar denotes the 5′ end of the first minigene intron. (C) PCR products from nested reactions. pOGDH, the OGDH plasmid; RT, reverse transcriptase; C, a control minigene. Red rectangle denotes fragments extracted from the gel for cloning. (D) Representative sequence chromatograms illustrating diagnostic A>T mismatches at each lariat junction. The 5′ end of minigene intron is denoted by black rectangles and BPs are circled; n, the number of informative clones supporting each dBP; their alignments are shown in Supplementary Figure S3. Asterisk in the dBP+41 panel denotes a PCR-generated T>C mutation. (E) dBP usage (left) and their SVM scores (right). (F) Predicted U2 snRNA:dBP base-pairing interactions. Only the most common mode of BP:U2 contacts (193) is shown. The BP-interacting region of U2 snRNA is boxed; number of hydrogen bonds within the U2 box is to the right. The number of hydrogen bonds within the extended region, which may facilitate base shifted registers and less common binding modes (39,193,194), is in parentheses. (G) Impact of dBP substitutions (lanes 2–7) and insertions of canonical BPs (lanes 8–13) on splicing. RNA products were digested with PvuII, as shown in Figure 1G. Asterisks show significant changes from the WT. (H) dBP usage in cells depleted of TIA proteins or overexpressing PUF60, as determined by RNA-seq. Bar charts represent the mean relative usage (%) of each dBP; error bars are SDs of technical duplicates. C, untreated cells. The number of reads (in millions) supporting each dBP bin is shown in white.
Figure 4.
Figure 4.
Transposons can both introduce and eliminate dBP competitors. (A) Schematics of MIR cloning. MIR insertions (blue bars) were introduced in intron 4a upstream (PstI) or downstream (EcoRV) of the dBP cluster. Restriction sites are denoted by arrowheads in the WT construct. (B) Construction of the MIR library. PCR products obtained with the indicated annealing temperatures (Ta;°C) were cut from the gel (red rectangles) and subcloned into PstI or EcoRV sites. (C, D) Exon usage of OGDH constructs with upstream (C) or downstream (D) MIR insertions. MIR inserts are characterized in Supplementary Table S3. (E, F) MIR15 transcripts employed both a unique BP (E) and BP shared with other MIR constructs (F). Canonical BPs are denoted by their distances from 3′ss (in nts). Blue horizontal bar denotes the last 4 nts of exon 4a.
Figure 5.
Figure 5.
Identification of vertebrate Ogdh variants that alter MXE ratios. (A) Summary of tested variants. Each polymorphism is represented by a IUPAC code (B = C, G or T; H = A, C or T; K = G or T; M = A or C; D = A, G or T) and is denoted by nt distances from the 5′ss (−) or 3′ss (+) of intron 4a. Supplementary Figure S1 shows each allele in 62 vertebrates. (B) The relative abundance of Ca2+-sensitive isoforms 4b+ (upper panel) following transfections of mutated constructs into HEK293 cells (lower panel). Error bars are SDs of two transfection experiments. Asterisks denote significant (P< 0.05; one-way ANOVA with Dunnett's post-hoc tests) differences in exon 4b inclusion from the wild-type construct (WT). (C, D) The impact of codon loss (C) or gain (D) in exon 4a on MXE ratios. (C) Loss of GGA codon from Xenopus laevis transcripts promotes isoform 4b+. (D) Codon gain in Homo sapiens transcripts promotes isoform 4a+.
Figure 6.
Figure 6.
Evolution of the OgdhdBP cluster in vertebrates. (A, B) BP mapping in frog (A) and chicken (B) transcripts. dBPs are circled and denoted by their distance from the 5′ss. The 5′ end of minigene intron is denoted by black rectangles. (C) The impact of sauropsid dBP variants on exon 4a/4b usage. Mutations introduced in the WT minigenes are in red. dBPs are shaded. Error bars are SDs of two transfections. Asterisks denote significant differences between means (P<0.05; ANOVA with post-hoc Dunnett's tests). (D) Chicken dBP usage in HEK293 cells depleted of TIA-1 or overexpressing PUF60. Bar charts show mean usage of the indicated dBPs; error bars are SDs of two transfection wells. The total number of RNA-seq reads (in millions) is in white. C, untreated cells. (E) BP mapping in ocean sunfish (M. mola) transcripts. RT-PCR gel (left panel) with a 140-nt fragment containing a lariat junction sequenced in the right panel. Ctrl., control plasmid, NC, negative RT control. TG and CG denote M. mola minigenes with mutations removing the AGEZ spoiler and restoring the long AGEZ (Supplementary Figure S13E). Asterisk denotes RT-PCR artefacts confirmed by sequencing. (F) Potential display of dBPs in stable RNA hairpins predicted for chicken (left) and human (right) transcripts. Putative base-pairing interactions between established chicken dBPs and U2 snRNA are at the bottom; for full legend, see Figure 3F. ss, single-stranded; ds, double-stranded.
Figure 7.
Figure 7.
DMS structural probing of human and chicken dBP clusters. (A–C) human dBPs; (D–F) chicken dBPs. Their usage is shown in Figures 3H and 6D. (A, D) Representative gels containing RT products of DMS-treated and untreated RNAs run in parallel with a sequencing ladder. Adenines (left) are numbered as in panels C and F. (B, E) Normalized DMS reactivities of duplicate experiments with human (B) and chicken (E) probes. dBPs are boxed. (C, F) Secondary structure predictions showing strong, medium and low DMS reactivities for the most stable (I, left) and the second most stable (II, right) structures of human (C) and chicken (F) transcripts. SHAPE-guided structures are in Figure 8. Legend (top right corner of panel C) denotes paired and unpaired status of individual dBPs; red arrow shows a wobble pair at the helix end; if disallowed in RNAfold (59), dBP+41 A becomes single-stranded in an asymmetric loop involving nts marked by a red ellipse. Tentative human dBP+45 U (Figure 3H) is single-stranded (panel C), but its unused chicken counterpart is double-stranded in the most stable structure (panel F).
Figure 8.
Figure 8.
SHAPE with human RNA probes modified by NAI. (A) Separated RT products of in vitro NAI-treated (+) or untreated (−) reactions with human Cy5-labeled WT RNA probe with linkers. dBP cluster is labeled to the right. Dideoxy sequencing ladder (lanes 1–4) was run in parallel to determine modified positions. (B) Normalized NAI reactivities. Nucleotide flexibility is coloured (scale is to the right); negative values are shown in full. (C) The most stable SHAPE-guided structure (I, left) with an alternative stable structure (II, right). Predictions were carried out with RNAstructure using reactivity values from panel B. Linkers are greyed. Red arrow shows a wobble pair at the end of helix; if disallowed in RNAfold (59), dBP+41becomes single-stranded. (D) Human WT and mutated probes that lack linkers. (E) Normalized NAI reactivities for panel D; negative values are cut off at −1. (F) Optimal SHAPE-guided secondary structure of the WT RNA probe supported by methods developed by Deigan et al. (55) (default slope m = 1.9 and intercept b = −0.7), Washietl et al. (57) (linear mapping and tau/sigma-ratio of 1) and Zarringhalam et al. (56) (linear linear log model, slope 1.6, intercept −2.29 and β = 0.8). (G,H) Usage of individual dBPs correlates with their NAI reactivities (G) rather than predicted U2:BP base-pairing (H), shown as the number of hydrogen bonds between dBPs and canonical GUAGUA motif (blue) or the extended U2 snRNA region (red). r, correlation coefficients and associated P values (F-tests). For Ampli-seq data, r and P values were 0.65 and 0.18 (GUAGUA) and 0.26 and 0.4 (extended U2 motif), respectively.
Figure 9.
Figure 9.
Exon-level co-regulation of OGDH and the γ-subunit of F1-ATP synthase. (A) UG-rich PPTs precede PUF60-activated MXEs. Genome browser views of RNA-seq of HEK293 cells depleted of PUF60, U2AF65 and untreated controls (in duplicates). UG repeats are denoted by red rectangles in DNM2 and FYN (top two panels); they are absent in a 73-nt intron between insensitive CALU MXEs (bottom panel). Mean MXE ratios (a/b) calculated from Sashimi plots are to the right. Y-axis, read numbers (ArrayExpress accession number E-MTAB-6010). Arrows indicate transcriptional orientation. (B) Alternative splicing of PUF60-dependent ATP5C1 exon 9. Location of UG-rich PPT is denoted by a red rectangle. 3′ end sequencing track (3′Seq, ref. 195) shows a downstream polyadenylation site. (C) Validation of PUF60-dependent splicing of exon 9 by RT-PCR; sc, scrambled control (41). (D) Spacefill representation of the ground state bovine structure of the F1Fo-ATP synthase at 1.9 Å resolution (196). Arrow denotes the C-terminal amino acid of the γ-subunit encoded by ATP5C1 isoform 9+, but not by isoform 9-.
Figure 10.
Figure 10.
Auxiliary splicing motifs in exons and the Irving-Williams affinity series. (A) Sixty-four codons ranked by loge ESE/ESS ratios. Asterisks denote stop codons. Amino acids preferentially involved in Ca2+ or Mg2+ binding are boxed in green; residues preferentially involved in Cu2+ and Zn2+ binding are boxed in red. (B) ESE/ESS ratios for codons that encode key residues in protein binding sites for the indicated metals mirror the Irving-Williams affinity order. The weighted average ratios were derived with residue frequencies estimated by fragment transformation methods (61). (C) Weighted average loge(ESE/ESS) values for the indicated amino acids (top) and metal ions (bottom). The values were computed for residue frequencies in ∼290 000 metal binding sites from >50 000 pro- and eukaryotic structures (62). The lower panel shows estimates of molar concentrations (M) of the free metals in the primordial sea of the Earth (∼4500 Myrs ago), as reported previously (183,197). (D, E) ESE to ESS (Asp to His) reversal of the Ca2+-binding DADLD motif in OGDH exon 4b. (D) Exon 4b inclusion in mature transcripts upon transient transfection of WT and mutated reporters into HEK293 cells. Mutations are in red. (E) Measurements of exon 4b inclusion levels for panel D. Error bars represent SDs from two independent transfections. Asterisks denote significant differences for the indicated comparisons (P< 0.05, ANOVA with Dunnett's post-hoc tests). The ESEseq/ESSseq ratios were calculated for all hexamers in 25-nt segments around the WT or mutated DADLD motifs using ESEseq and ESSseq scores published previously (60).

References

    1. Grigg G.C., Beard L.A., Augee M.L.. The evolution of endothermy and its diversity in mammals and birds. Physiol. Biochem. Zool. 2004; 77:982–997. - PubMed
    1. Kemp T.S. The origin of mammalian endothermy: a paradigm for the evolution of complex biological structure. Zool. J. Linnean Soc. 2006; 147:473–488.
    1. Clarke A., Portner H.O.. Temperature, metabolic power and the evolution of endothermy. Biol. Rev. Camb. Philos. Soc. 2010; 85:703–727. - PubMed
    1. Lovegrove B.G. A phenology of the evolution of endothermy in birds and mammals. Biol. Rev. Camb. Philos. Soc. 2017; 92:1213–1240. - PubMed
    1. Bennett A.F., Ruben J.A.. Endothermy and activity in vertebrates. Science. 1979; 206:649–654. - PubMed

Publication types

MeSH terms