. 2021 Aug;74(2):667-685.
doi: 10.1002/hep.31743. Epub 2021 Aug 10.

Heterogeneity of HSCs in a Mouse Model of NASH

Affiliations

Heterogeneity of HSCs in a Mouse Model of NASH

Sara Brin Rosenthal et al. Hepatology. 2021 Aug.

Abstract

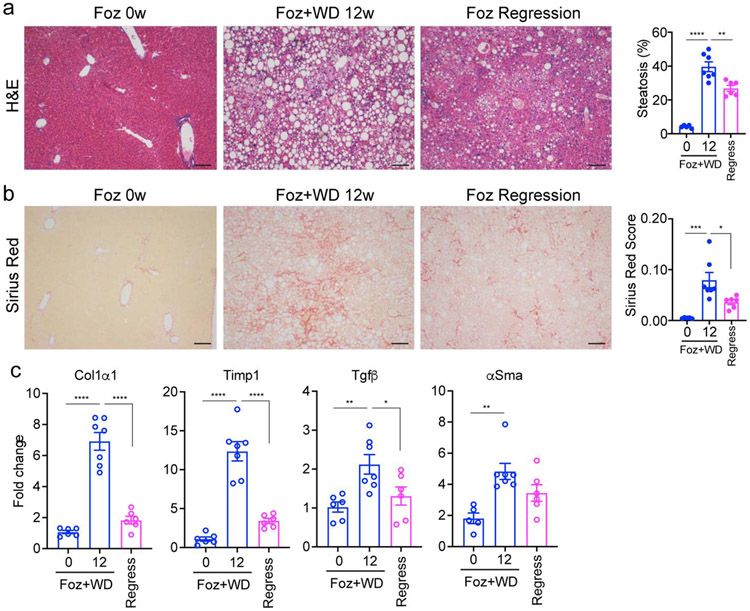
Background and aims: In clinical and experimental NASH, the origin of the scar-forming myofibroblast is the HSC. We used foz/foz mice on a Western diet to characterize in detail the phenotypic changes of HSCs in a NASH model.

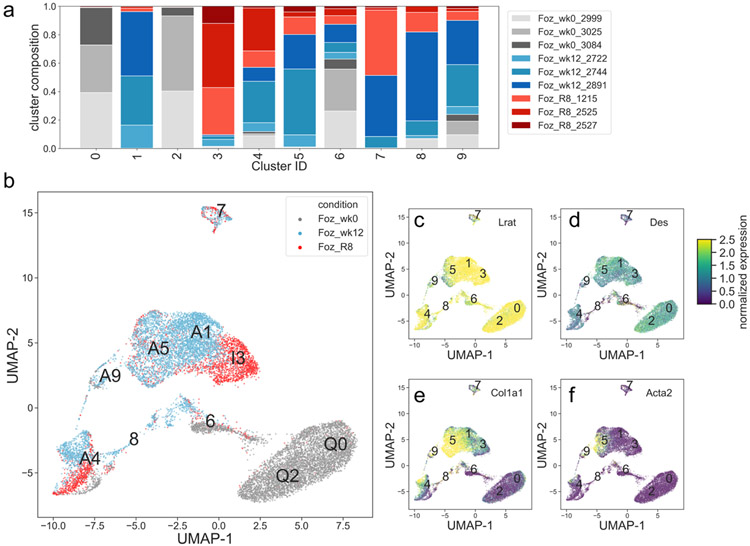
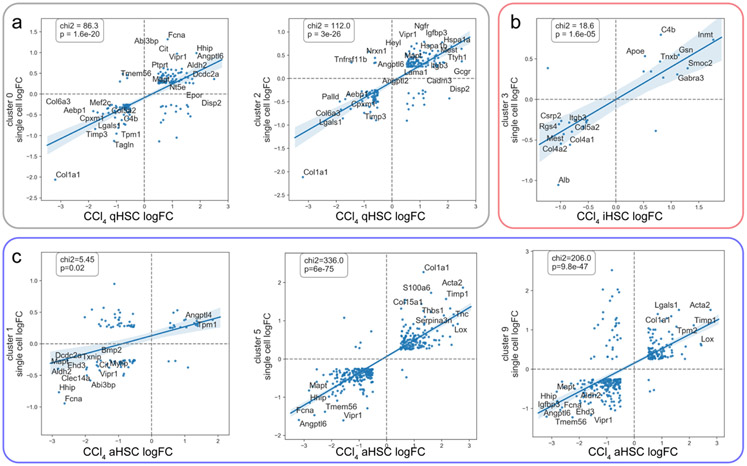
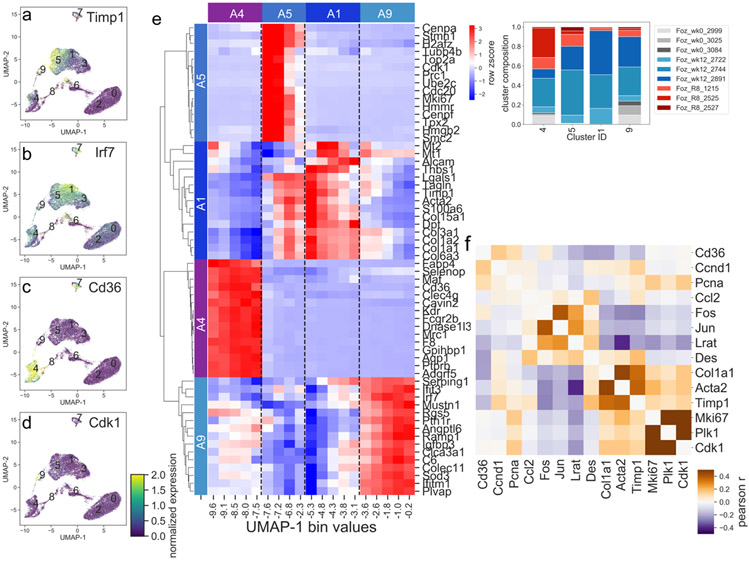
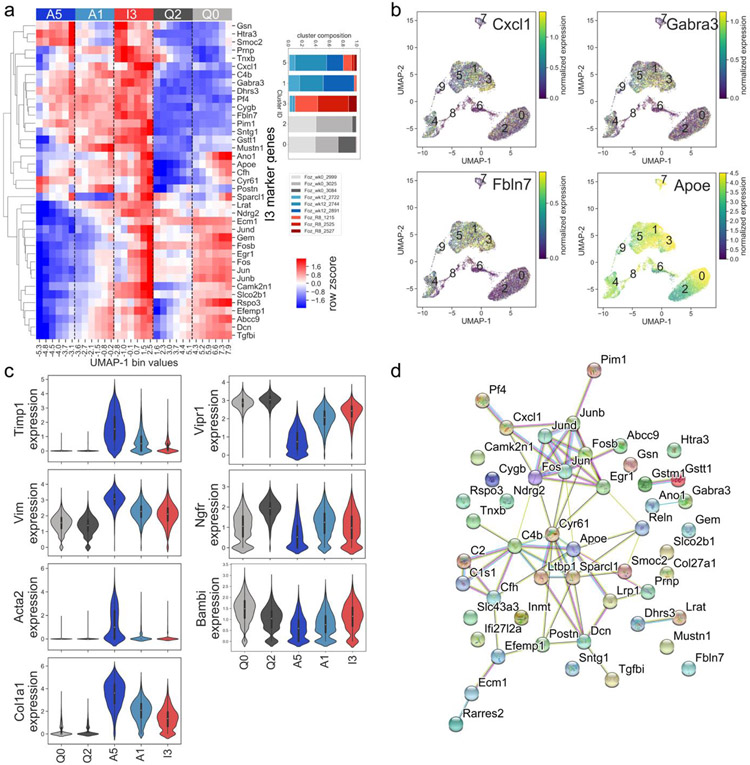
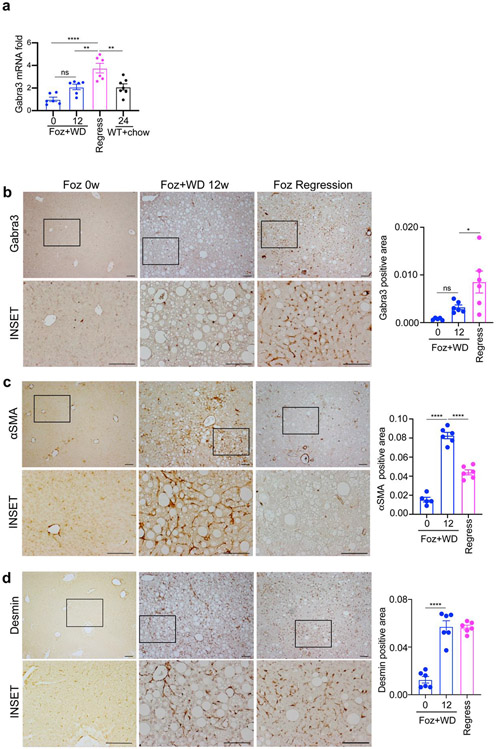
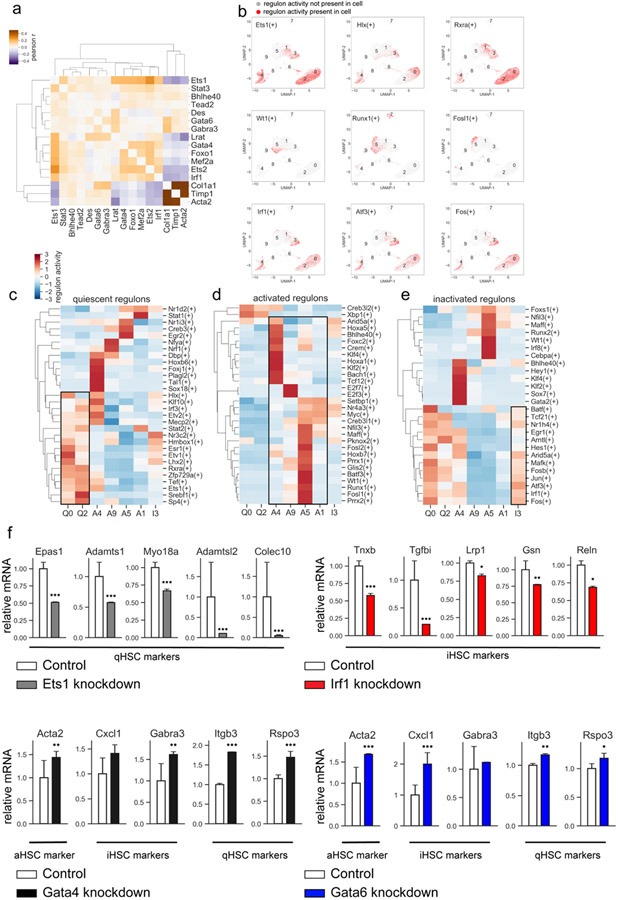
Approach and results: We examined the single-cell expression profiles (scRNA sequencing) of HSCs purified from the normal livers of foz/foz mice on a chow diet, in NASH with fibrosis of foz/foz mice on a Western diet, and in livers during regression of NASH after switching back to a chow diet. Selected genes were analyzed using immunohistochemistry, quantitative real-time PCR, and short hairpin RNA knockdown in primary mouse HSCs. Our analysis of the normal liver identified two distinct clusters of quiescent HSCs that correspond to their acinar position of either pericentral vein or periportal vein. The NASH livers had four distinct HSC clusters, including one representing the classic fibrogenic myofibroblast. The three other HSC clusters consisted of a proliferating cluster, an intermediate activated cluster, and an immune and inflammatory cluster. The livers with NASH regression had one cluster of inactivated HSCs, which was similar to, but distinct from, the quiescent HSCs.

Conclusions: Analysis of single-cell RNA sequencing in combination with an interrogation of previous studies revealed an unanticipated heterogeneity of HSC phenotypes under normal and injured states.


Conflict of interest statement

COI: UC San Diego receives grant support from Janssen

Figures

Figure 1.
Figure 1.. Progression and regression of fibrosis in foz/foz mice.
Six weeks old foz/foz mice were fed either standard chow (0w) or WD for 12 weeks (12w) or subjected to regression by switching 12w WD fed mice to standard chow for 8 additional weeks. Representative images of liver histology depicting steatosis (a; hematoxylin-eosin (H&E) staining) and fibrosis (b; sirius red staining; quantified as sirius red positive area normalized to non-steatotic area); Scale bar: 100 μm. (c) Total RNA was extracted from the liver lysates and expression of indicated fibrogenic markers were analyzed by qPCR. The data is represented as fold induction versus foz/foz mice on standard chow (0w WD group). All bar graphs represent mean ± SEM, *p <0.05, **p <0.01, ***p <0.001, ****p <0.0001 by ANOVA.
Figure 2:
Figure 2:. Single cell RNA-seq clusters of HSCs express validated markers.
a) Cell type composition breakdown per cluster (fraction of total cell count per cluster). Three foz/foz week 0 samples shown in gray, three foz/foz week 12 samples shown in blue, and three foz/foz regression samples shown in red. b) Cells plotted in UMAP space, color-coded by condition, cluster identity positioned at the median UMAP-1, UMAP-2 for all cells in the cluster. c-f) Cells plotted in UMAP space, color-coded by Lrat, Des, Acta2, and Col1a1 mRNA expression.
Figure 3:
Figure 3:. Single cell clusters match known HSC phenotypes.
a) Clusters 0 and 2 correspond to quiescent HSC markers; x-axis shows log fold change comparing CCl4 quiescent HSCs to activated and inactivated HSCs, y-axis shows log fold change comparing expression in clusters 0 and 2 to all other cells. b) Cluster 3 corresponds to inactivated HSC markers; x-axis shows log fold change comparing CCl4 inactivated HSCs to activated or quiescent HSCs, y-axis shows log fold change comparing expression in cluster 3 to all other cells. c) Clusters 1, 5, and 9 correspond to activated HSC markers; x-axis shows log fold change comparing CCl4 activated HSCs to quiescent and inactivated HSCs, y-axis shows log fold change comparing expression in clusters 1, 5, and 9 to all other cells. For panels (a-c) scatterplot points are shown which are both changed with abs(log fold change)>0.5 in the CCl4 experiment, and which are identified as markers of each cluster in the single cell analysis. The top 15 genes are labeled. A linear regression line was fitted to the data, with 95% confidence intervals shown. The Chi-squared values and corresponding p-values are shown which compare the number of genes observed in each quadrant to what would be expected if there was no correspondence between the two datasets.
Figure 4:
Figure 4:. Heterogeneity of quiescent HSCs in murine NASH.
a) Previously determined markers of central-vein associated qHSCs (yellow) and portal-vein associated qHSCs (green) correspond to clusters Q0 and Q2 (quiescent clusters) respectively. Heatmap displays relative gene expression in cells binned by UMAP dimension 1, where most of the variance is seen between clusters Q0 and Q2, bins evenly spaced between minimum and maximum UMAP-1 value for cells in clusters Q0 and Q2. Cluster membership annotated by top color bar and dotted line. Inset indicates breakdown of cells in clusters 0 and 2 by sample. b) Individual cell expression plotted in UMAP space for cells in clusters Q0 and Q2, for four selected marker genes of portal-vein HSCs (Ngfr, Itgb3), and central-vein associated HSCs (Adamtsl2, Rspo3). c) Markers of cluster Q2 identified by our analysis overlap with portal-vein markers (33/46 portal-vein genes shared) d) Markers of cluster Q0 identified by our analysis overlap with central vein marker genes (20/26 central-vein genes shared). e) Molecular interactions among cluster Q2 marker genes, from the STRING database. This gene set has more interactions than expected by chance (p<1E-16, permutation test). f) Molecular interactions among cluster Q0 marker genes, from the STRING database. This gene set has more interactions than expected by chance (p<1E-16, permutation test).
Figure 5:
Figure 5:. Heterogeneity of activated HSCs in murine NASH.
a-d) Individual cell expression of selected marker genes (Timp1, Irf7, Cd36, and Cdk1) for each of the 4 activated clusters (clusters A1, A4, A5, and A9). e) Heatmap displays relative gene expression in cells binned by UMAP dimension 1, where most of the variance is seen among clusters A4, A9, A5, and A1, bins evenly spaced between minimum and maximum UMAP-1 value for cells in clusters A4, A9, A5, and A1. Relative expression for top 15 marker genes for each cluster is shown. Cluster membership annotated by top color bar and dotted line. Inset indicates breakdown of cells in clusters A4, A9, A5, and A1 by sample. f) Heatmap showing the co-expression between selected proliferation genes and activated and quiescent marker genes. Co-expression was calculated between all cells from the foz/foz week 12 condition.
Figure 6:
Figure 6:. Characterization of inactivated HSCs in murine NASH.
a) Heatmap displays relative gene expression in cells binned by UMAP dimension 1, for cells in clusters A5, A1 (activated), I3 (inactivated), Q0, and Q2 (quiescent), bins evenly spaced between minimum and maximum UMAP-1 value for cells in clusters A5, A1, I3, Q0, and Q2. Relative expression for top 40 I3 marker genes for each cluster is shown. Expression levels of cells in the A1 cluster are intermediate between A5 and I3. Relative expression for top 15 marker genes for each cluster is shown. Cluster membership annotated by top color bar and dotted line. Inset indicates breakdown of cells in A5, A1, I3, Q0, and Q2 by sample. b) Individual cell expression of selected I3 marker genes. c) Violin plots demonstrating cluster-specific expression of selected marker genes in quiescent, activated, and inactivated clusters. d) Molecular interactions among cluster I3 marker genes, from the STRING database. This gene set has more interactions than expected by chance (p<1E-16, permutation test).
Figure 7.
Figure 7.. Inactivated hepatic stellate cells are characterized by high GABRA3, low aSMA expression.
a) GABRA3 gene expression in the indicated groups was analyzed by qPCR. Liver sections from the indicated groups were stained with b) anti-GABRA3, c) anti-aSMA and d) anti-DESMIN, antibody and quantified as normalized to the non-steatotic area. Scale bar: 100 μm. Data are represented as fold induction versus foz/foz mice on standard chow (0w WD group). Bar graphs represent mean ± SEM, *p <0.05, **p <0.01, ***p <0.001, ****p <0.0001 by ANOVA.
Figure 8:
Figure 8:. Analysis of transcription factors.
a) Heatmap displaying the correlation in expression (Pearson r) between selected transcription factors and selected markers of stellate cell activation. b) Top row: regulon activity of selected quiescent transcription factors, middle row: regulon activity of selected activated transcription factors, bottom row: regulon activity of selected inactivated transcription factors. c-e) Relative regulon activity per cluster for quiescent (c), activated (d), or inactivated (e) regulons. f) Primary HSCs (1 x 10⁶ cells) were infected with TF-specific shRNA- or non-targeting lentiviruses (>2 targeted and control vectors were tested), followed by ± puromycin (5μg/ml) and analyzed by RNA-Seq. Selected quiescent HSC marker genes observed to be downregulated upon knockdown of Ets1 (top left), selected inactivated HSC marker genes observed to be downregulated upon Irf1 knockdown (top right), selected markers of activated, inactivated, and quiescent HSCs observed to be significantly upregulated upon knockdown of Gata4 (bottom left) or Gata6 (bottom right). Relative expression normalized to mean of control mice. Error bars indicate 1 standard deviation. *p <0.05, **p <0.01, ***p <0.001, adjusted p-value from DESeq2 analysis of RNAseq data.

Comment in

References

    1. Tsuchida T, Friedman SL. Mechanisms of hepatic stellate cell activation. Nat. Rev. Gastroenterol. Hepatol 2017;14:397–411. - PubMed
    1. Koyama Y, Brenner DA. Liver inflammation and fibrosis. J. Clin. Invest 2017;127:55–64. - PMC - PubMed
    1. Iwaisako K, Jiang C, Zhang M, Cong M, Moore-Morris TJ, Park TJ, et al.Origin of myofibroblasts in the fibrotic liver in mice. Proc. Natl. Acad. Sci. U. S. A 2014;111:E3297–305. - PMC - PubMed
    1. Mederacke I, Hsu CC, Troeger JS, Huebener P, Mu X, Dapito DH, et al.Fate tracing reveals hepatic stellate cells as dominant contributors to liver fibrosis independent of its aetiology. Nat. Commun 2013;4:2823. - PMC - PubMed
    1. Xiong X, Kuang H, Ansari S, Liu T, Gong J, Wang S, et al.Landscape of intercellular crosstalk in healthy and NASH liver revealed by single-cell secretome gene analysis. Mol. Cell 2019;75:644–660.e5. - PMC - PubMed

Publication types

MeSH terms