Randomized Controlled Trial
. 2021 Feb;147(2):613-621.e9.
doi: 10.1016/j.jaci.2020.09.042.

Gut microbiota development during infancy: Impact of introducing allergenic foods

Affiliations
Randomized Controlled Trial

Gut microbiota development during infancy: Impact of introducing allergenic foods

Tom Marrs et al. J Allergy Clin Immunol. 2021 Feb.

Abstract

Background: The gut microbiota potentially plays an important role in the immunologic education of the host during early infancy.

Objective: We sought to determine how the infant gut microbiota evolve during infancy, particularly in relation to hygiene-related environmental factors, atopic disorders, and a randomized introduction of allergenic solids.

Methods: A total of 1303 exclusively breast-fed infants were enrolled in a dietary randomized controlled trial (Enquiring About Tolerance study) from 3 months of age. In this nested longitudinal study, fecal samples were collected at baseline, with additional sampling of selected cases and controls at 6 and 12 months to study the evolution of their gut microbiota, using 16S ribosomal RNA gene-targeted amplicon sequencing.

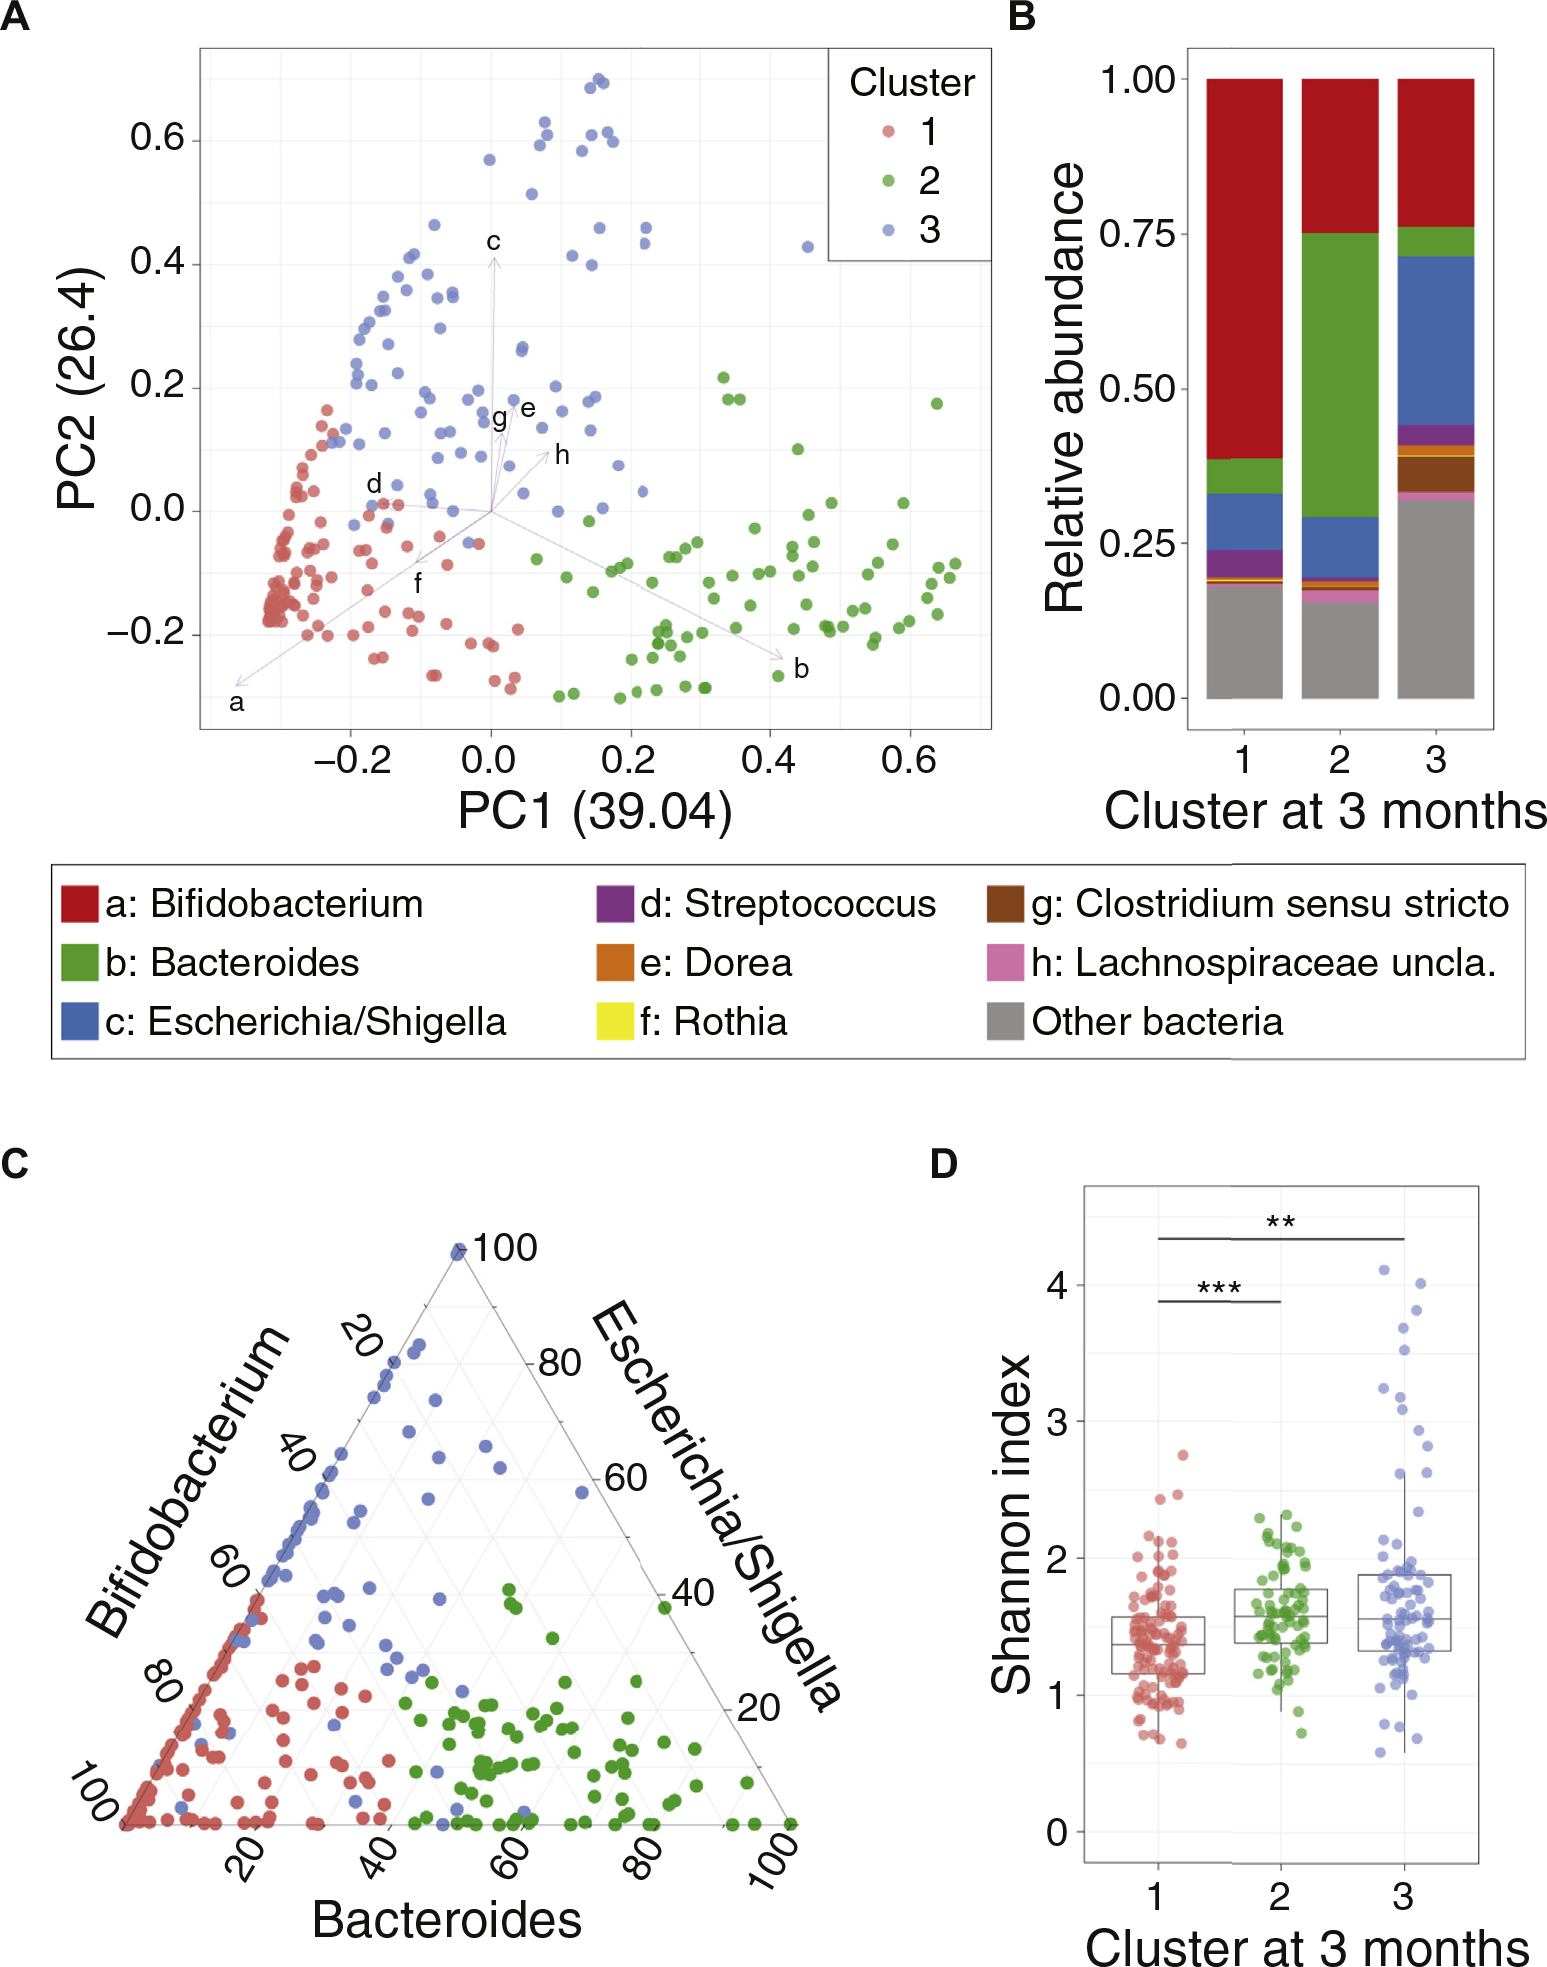
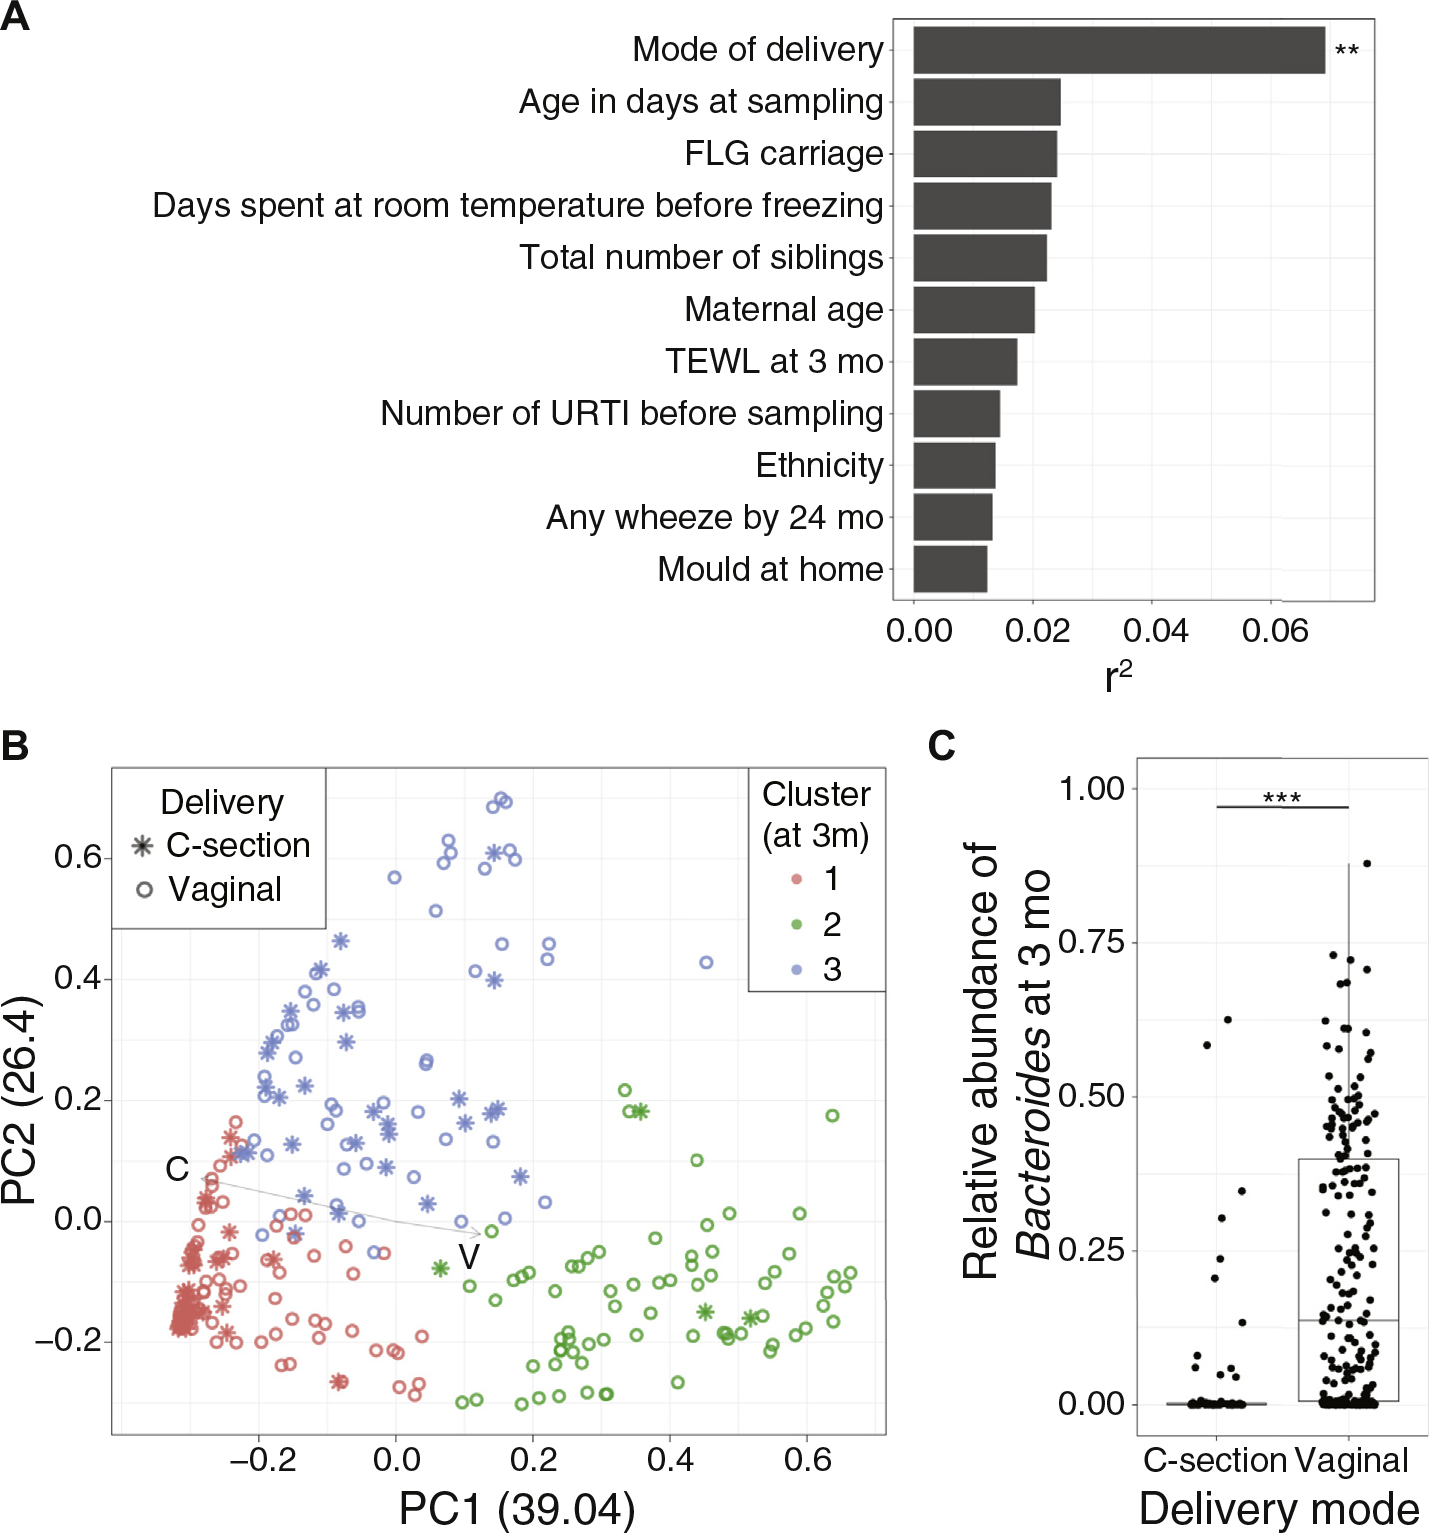
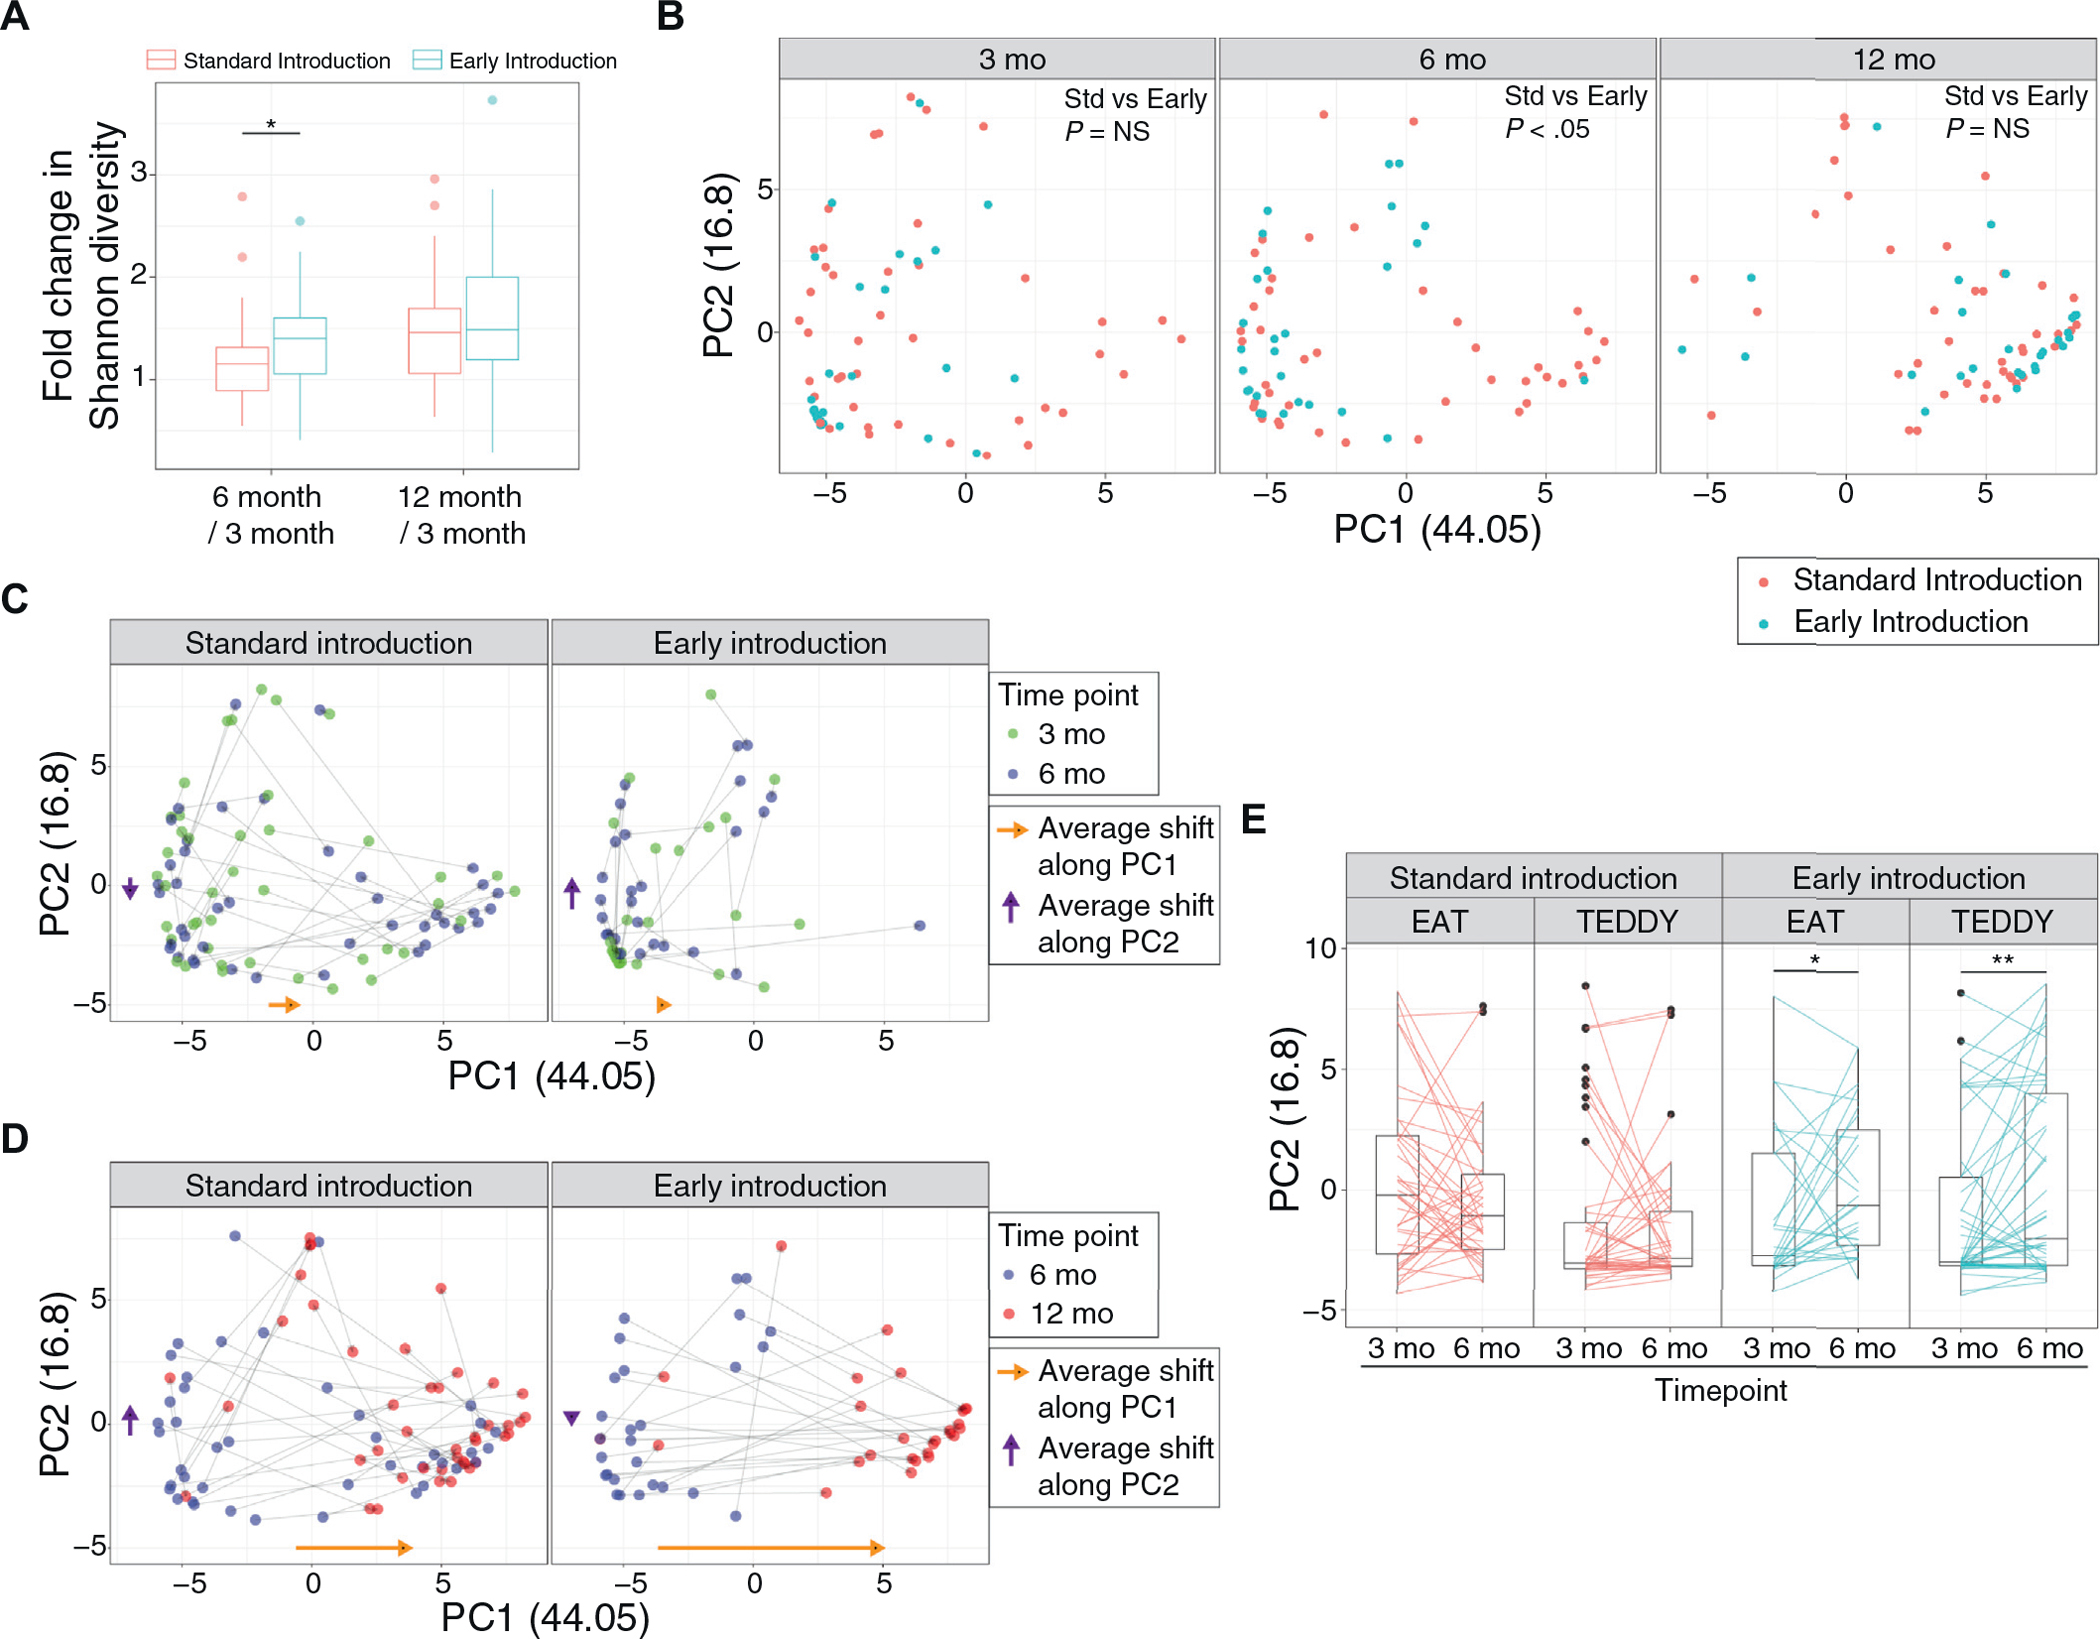
Results: In the 288 baseline samples from exclusively breast-fed infant at 3 months, the gut microbiota was highly heterogeneous, forming 3 distinct clusters: Bifidobacterium-rich, Bacteroides-rich, and Escherichia/Shigella-rich. Mode of delivery was the major discriminating factor. Increased Clostridium sensu stricto relative abundance at 3 months was associated with presence of atopic dermatitis on examination at age 3 and 12 months. From the selected cases and controls with longitudinal samples (n = 70), transition to Bacteroides-rich communities and influx of adult-specific microbes were observed during the first year of life. The introduction of allergenic solids promoted a significant increase in Shannon diversity and representation of specific microbes, such as genera belonging to Prevotellaceae and Proteobacteria (eg, Escherichia/Shigella), as compared with infants recommended to exclusively breast-feed.

Conclusions: Specific gut microbiota characteristics of samples from 3-month-old breast-fed infants were associated with cesarean birth, and greater Clostridium sensu stricto abundance was associated with atopic dermatitis. The randomized introduction of allergenic solids from age 3 months alongside breast-feeding was associated with differential dynamics of maturation of the gut microbial communities.

Keywords: Atopic dermatitis; bacteria; colonization; diet; environment; food; microbiome; tolerance.


Figures

FIG 1.
FIG 1.
Gut microbiota characteristics at age 3 months. A, PCoA of the gut microbiome at 3 months. Pair-wise distances (theta distance) among all samples were calculated and 2 major axes (PC1 and PC2) from the multidimensional distance space were calculated and depicted on a scatter plot. Colors indicate different clusters, according to k-means clustering. Arrows and letters indicate specific genera significantly correlated with PCoA ordination (P < .05, lengths of arrows are proportion to R2, calculated from EnvFit function from R). Corresponding genera for letters are showing on the right panel of B. B, Averaged stacked bar chart of infants’ microbiome within each cluster. Genera that are significantly correlated with PCoA ordination are depicted as colored bar (legend on right) and others are merged as “Other bacteria.” C, Triangle plot showing relative abundances of the 3 key genera (Bifidobacterium, Bacteroides, and Escherichia/Shigella) in the gut microbiota of baseline samples. The colors indicate clusters (same as Fig 1, A). D, Boxplot of bacterial community diversity (Shannon index) differences according to microbiome community clusters. Shannon diversity of cluster 1 community is significantly lower than those of clusters 2 and 3. (**P < .01, ***P < .001; Wilcoxon rank-sum test, after Kruskal-wallis test)
FIG 2.
FIG 2.
Evaluation of associations between gut microbiota characteristics and cesarean delivery. A, Association analysis of clinical, hygiene, and lifestyle factors (“covariates”) with microbiome variations. Among a total of 48 covariates tested, 11 covariates with r2 greater than 0.01 are plotted here. Each bar indicates the amount of variance explained by each covariate, calculated by EnvFit function from R (**P < .01; Bonferroni corrected). After correction for multiple comparison, mode of delivery remained as a significant factor that associated with microbiome variation. B, PCoA of microbiomes at 3 months with delivery mode delineated. Color indicates cluster (same as Fig 1, A), and the shape indicates delivery mode. Arrows demonstrate the direction of each covariate in the ordination space. Infants born by cesarean section tend to cluster on the left portion of the scatter plot. C, Boxplot showing the difference in relative abundances of Bacteroides by mode of delivery. Bacteriodes are largely missing in infants born by cesarean section (***P < .001; Wilcoxon rank-sum test). TEWL, Transepidermal water loss; URTI, Upper respiratory tract infection.
FIG 3.
FIG 3.
Impact of allergenic solid introduction on infants’ gut microbiota. A, Boxplot comparing Shannon diversity changes among participants’ longitudinal samples according to randomized allocation to continued exclusive breast-feeding (standard introduction group) or the introduction of allergenic solids (early introduction group) (*P < .05; Wilcoxon rank-sum test). B, PCoA plot showing longitudinal transition of the gut microbiome from age 3 to 12 months in the different dietary intervention groups. At 6 months, the microbiota of early introduction is significantly different from standard introduction (P < .05 by analysis of molecular variance). C, PCoA scatter plot demonstrating longitudinal transition from age 3 to 6 months. Gray arrows connect samples from the same individuals. Yellow and purple arrows alongside the axes indicate the average shift of the microbiota in each PCoA axis. D, PCoA scatter plot demonstrating longitudinal transition from age 6 to 12 months. Gray arrows connect samples from the same individual. Yellow and purple arrows alongside the axes indicate average shift of the microbiota in each PCoA axis. E, Boxplot showing changes in microbiome from 3 to 6 months, in different dietary intervention groups and cohorts (EAT and TEDDY). Early introduction in both studies led to an increase along the second principal-coordinate axis (*P < .05 and **P < .01; paired Wilcoxon rank-sum test). NS, Nonsignificant; Std, standard.

References

    1. Zeissig S, Blumberg RS. Life at the beginning: perturbation of the microbiota by antibiotics in early life and its role in health and disease. Nat Immunol 2014;15: 307–10. - PubMed
    1. Arrieta MC, Stiemsma LT, Dimitriu PA, Thorson L, Russell S, Yurist-Doutsch S, et al. Early infancy microbial and metabolic alterations affect risk of childhood asthma. Sci Transl Med 2015;7:307ra152. - PubMed
    1. Fujimura KE, Sitarik AR, Havstad S, Lin DL, Levan S, Fadrosh D, et al. Neonatal gut microbiota associates with childhood multisensitized atopy and T cell differentiation. Nat Med 2016;22:1187–91. - PMC - PubMed
    1. Stokholm J, Blaser MJ, Thorsen J, Rasmussen MA, Waage J, Vinding RK, et al. Maturation of the gut microbiome and risk of asthma in childhood. Nat Commun 2018;9:141. - PMC - PubMed
    1. Dominguez-Bello MG, Costello EK, Contreras M, Magris M, Hidalgo G, Fierer N, et al. Delivery mode shapes the acquisition and structure of the initial microbiota across multiple body habitats in newborns. Proc Natl Acad Sci U S A 2010;107: 11971–5. - PMC - PubMed

Publication types