. 2021 Jul 5;31(7):426-450.
doi: 10.2188/jea.JE20200416. Epub 2021 Feb 6.

Updated Trends in Cancer in Japan: Incidence in 1985-2015 and Mortality in 1958-2018-A Sign of Decrease in Cancer Incidence

Affiliations

Updated Trends in Cancer in Japan: Incidence in 1985-2015 and Mortality in 1958-2018-A Sign of Decrease in Cancer Incidence

Kota Katanoda et al. J Epidemiol. .

Abstract

Background: Unlike many North American and European countries, Japan has observed a continuous increase in cancer incidence over the last few decades. We examined the most recent trends in population-based cancer incidence and mortality in Japan.

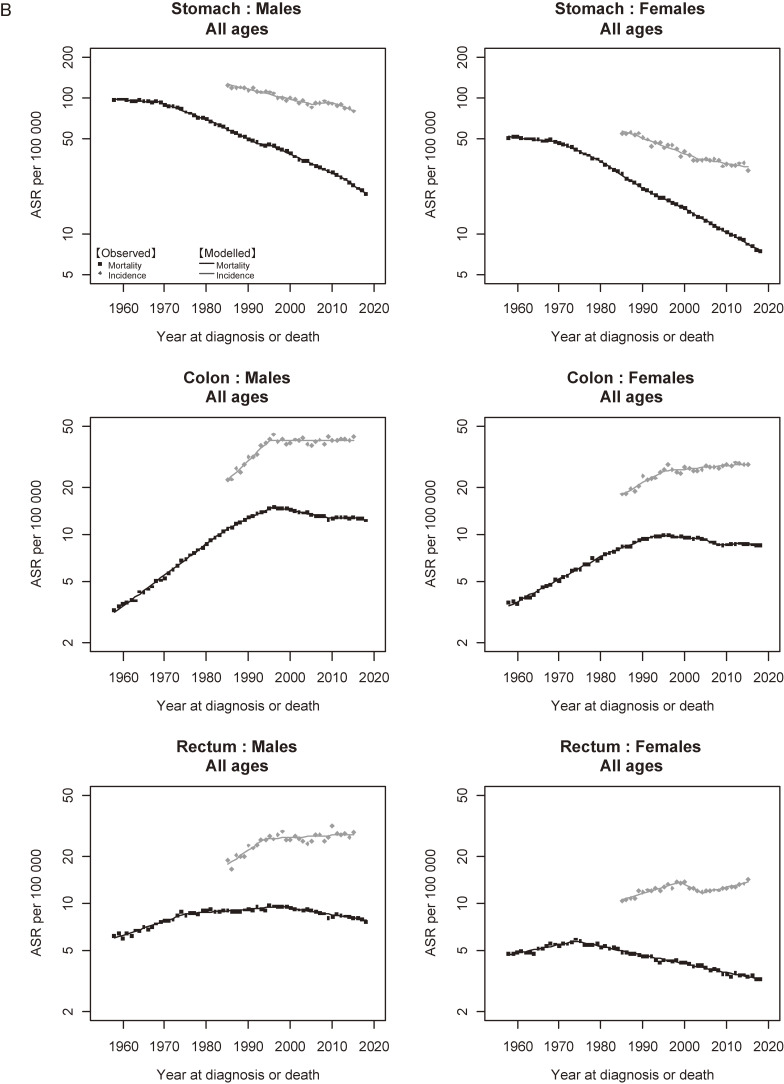
Methods: National cancer mortality data between 1958 and 2018 were obtained from published vital statistics. Cancer incidence data between 1985 and 2015 were obtained from high-quality population-based cancer registries maintained by three prefectures (Yamagata, Fukui, and Nagasaki). Trends in age-standardized rates (ASR) were examined using Joinpoint regression analysis.

Results: For males, all-cancer incidence increased between 1985 and 1996 (annual percent change [APC] +1.1%; 95% confidence interval [CI], 0.7-1.5%), increased again in 2000-2010 (+1.3%; 95% CI, 0.9-1.8%), and then decreased until 2015 (-1.4%; 95% CI, -2.5 to -0.3%). For females, all-cancer incidence increased until 2010 (+0.8%; 95% CI, 0.6-0.9% in 1985-2004 and +2.4%; 95% CI, 1.3-3.4% in 2004-2010), and stabilized thereafter until 2015. The post-2000 increase was mainly attributable to prostate in males and breast in females, which slowed or levelled during the first decade of the 2000s. After a sustained increase, all-cancer mortality for males decreased in 1996-2013 (-1.6%; 95% CI, -1.6 to -1.5%) and accelerated thereafter until 2018 (-2.5%; 95% CI, -2.9 to -2.0%). All-cancer mortality for females decreased intermittently throughout the observation period, with the most recent APC of -1.0% (95% CI, -1.1 to -0.9%) in 2003-2018. The recent decreases in mortality in both sexes, and in incidence in males, were mainly attributable to stomach, liver, and male lung cancers.

Conclusion: The ASR of all-cancer incidence began decreasing significantly in males and levelled off in females in 2010.

Keywords: incidence; mortality; neoplasms; population surveillance; vital statistics.


Conflict of interest statement

Conflicts of interest: Kota Katanoda received a JMWH Bayer Grant (funded by Bayer) from the Japan Society for Menopause and Women’s Health. Eiko Saito received a grant from the Pfizer Health Research Foundation. Tatsuya Suzuki received a personal fee form Chugai Pharmaceutical. All of these financial relationships are outside the present study and did not affect any part of the work.

Figures

Figure 1A.
Figure 1A.. Annual trends in age-standardized rates of all-cancer and site-specific cancer incidence: data from three prefectures (1985–2015): Major sitesa,b. aYamagata, Fukui, and Nagasaki Prefectures. bStandardized to the Japanese model population in 1985. cCervix and corpus uteri are shown in Figure 1B.
Figure 1B.
Figure 1B.. Annual trends in the age-standardized rates of all-cancer and site-specific cancer incidence: data from three prefectures (1985–2015): Sub-major sitesa,b. aYamagata, Fukui, and Nagasaki Prefectures. bStandardized to the Japanese model population in 1985.
Figure 2.
Figure 2.. Contribution of cancer sites to changes in incidence.
Figure 3A.
Figure 3A.. Annual trends in age-standardized rates of all-cancer and site-specific cancer mortality: national data (1958–2018): Major sitesa. aStandardized to the Japanese model population in 1985. bCervix and corpus uteri are shown in Figure 3B.
Figure 3B.
Figure 3B.. Annual trends in the age-standardized rates of all-cancer and site-specific cancer mortality: national data (1958–2018): Sub-major sitesa. aStandardized to the Japanese model population in 1985.
Figure 4.
Figure 4.. Contribution of cancer sites to the decrease in mortality in the most recent 10 years (2009–2018).
Figure 5A.
Figure 5A.. Observed and modelled trends in cancer incidence (1985–2015) and mortality (1958–2018) rates: All cancers combined. aIncidence: data from Yamagata, Fukui, and Nagasaki Prefectures, Mortality: national data. bStandardized to the Japanese model population in 1985.
Figure 5B.
Figure 5B.. Observed and modelled trends in cancer incidence (1985–2015) and mortality (1958–2018) rates: Major sites. aIncidence: data from Yamagata, Fukui, and Nagasaki Prefectures, Mortality: national data. bStandardized to the Japanese model population in 1985.
Figure 5B.
Figure 5B.. Observed and modelled trends in cancer incidence (1985–2015) and mortality (1958–2018) rates: Major sites. aIncidence: data from Yamagata, Fukui, and Nagasaki Prefectures, Mortality: national data. bStandardized to the Japanese model population in 1985.
Figure 5B.
Figure 5B.. Observed and modelled trends in cancer incidence (1985–2015) and mortality (1958–2018) rates: Major sites. aIncidence: data from Yamagata, Fukui, and Nagasaki Prefectures, Mortality: national data. bStandardized to the Japanese model population in 1985.
Figure 5C.
Figure 5C.. Observed and modelled trends in cancer incidence (1985–2015) and mortality (1958–2018) rates: Sub-major sites. aIncidence: data from Yamagata, Fukui, and Nagasaki Prefectures, Mortality: national data. bStandardized to the Japanese model population in 1985.
Figure 5C.
Figure 5C.. Observed and modelled trends in cancer incidence (1985–2015) and mortality (1958–2018) rates: Sub-major sites. aIncidence: data from Yamagata, Fukui, and Nagasaki Prefectures, Mortality: national data. bStandardized to the Japanese model population in 1985.
Figure 5C.
Figure 5C.. Observed and modelled trends in cancer incidence (1985–2015) and mortality (1958–2018) rates: Sub-major sites. aIncidence: data from Yamagata, Fukui, and Nagasaki Prefectures, Mortality: national data. bStandardized to the Japanese model population in 1985.

References

    1. Henley SJ, Ward EM, Scott S, et al. . Annual Report to the Nation on the Status of Cancer, part I: National cancer statistics. Cancer. 2020;126(10):2225–2249. 10.1002/cncr.32802 - DOI - PMC - PubMed
    1. Canadian Cancer Statistics 2019. Canadian Cancer Society, [Apr. 1, 2020 accessed]; Available from: http://cancer.ca/Canadian-Cancer-Statistics-2019-EN.
    1. Arnold M, Sierra MS, Laversanne M, Soerjomataram I, Jemal A, Bray F. Global patterns and trends in colorectal cancer incidence and mortality. Gut. 2017;66:683–691. 10.1136/gutjnl-2015-310912 - DOI - PubMed
    1. Dafni U, Tsourti Z, Alatsathianos I. Breast cancer statistics in the European Union: incidence and survival across European countries. Breast Care (Basel). 2019;14:344–353. 10.1159/000503219 - DOI - PMC - PubMed
    1. Hong S, Won YJ, Park YR, Jung KW, Kong HJ, Lee ES; Community of Population-Based Regional Cancer Registries . Cancer statistics in Korea: incidence, mortality, survival, and prevalence in 2017. Cancer Res Treat. 2020;52:335–350. 10.4143/crt.2020.206 - DOI - PMC - PubMed