. 2021 Jan 22:14:586108.
doi: 10.3389/fnins.2020.586108. eCollection 2020.

Presenilin-Deficient Neurons and Astrocytes Display Normal Mitochondrial Phenotypes

Affiliations

Presenilin-Deficient Neurons and Astrocytes Display Normal Mitochondrial Phenotypes

Sabrina Contino et al. Front Neurosci. .

Abstract

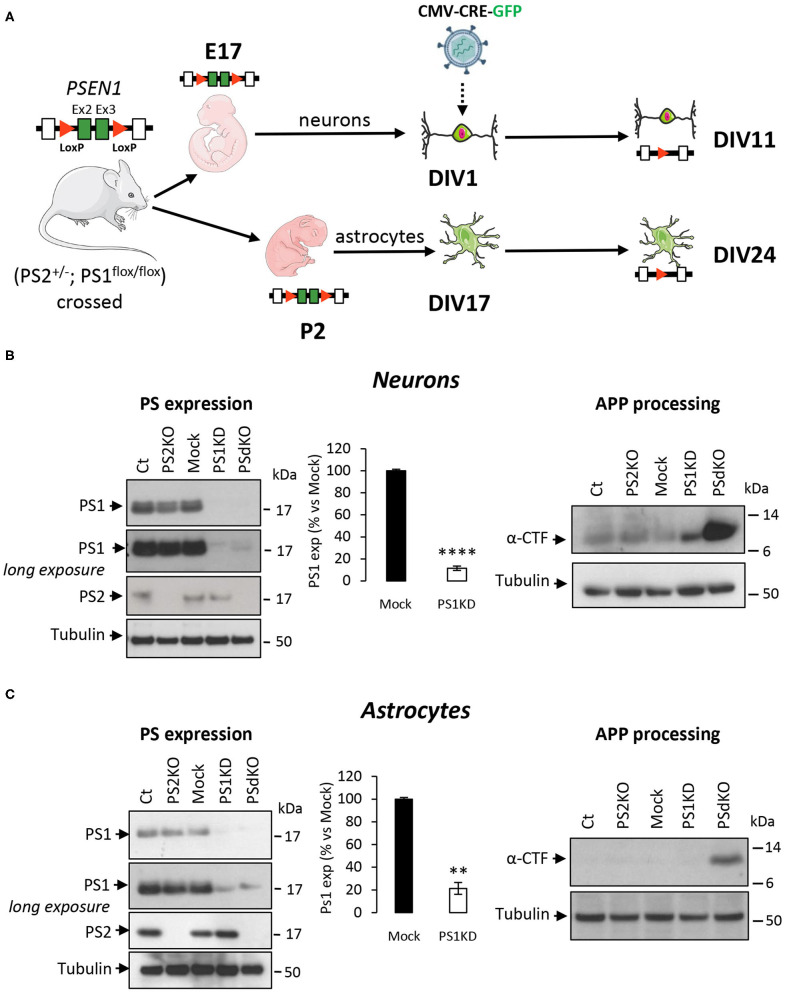
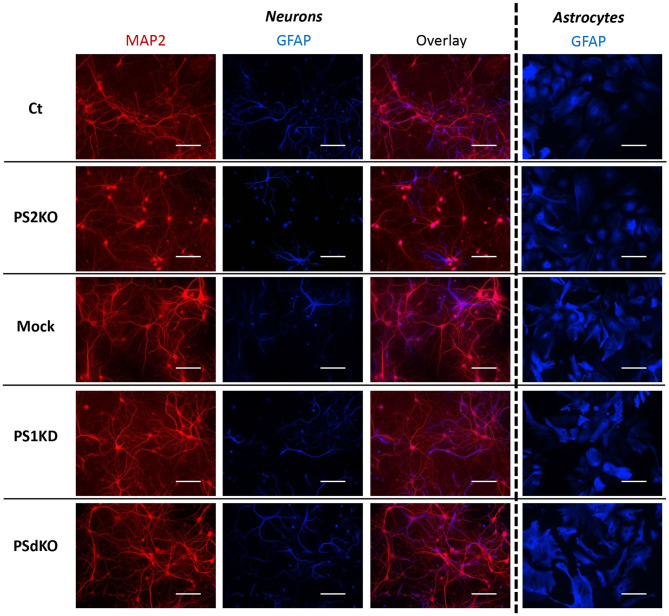
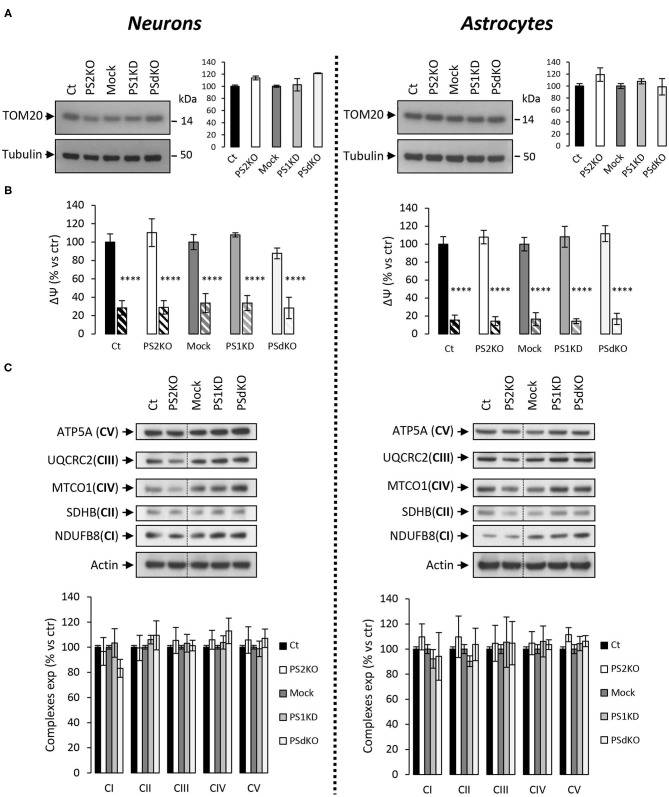
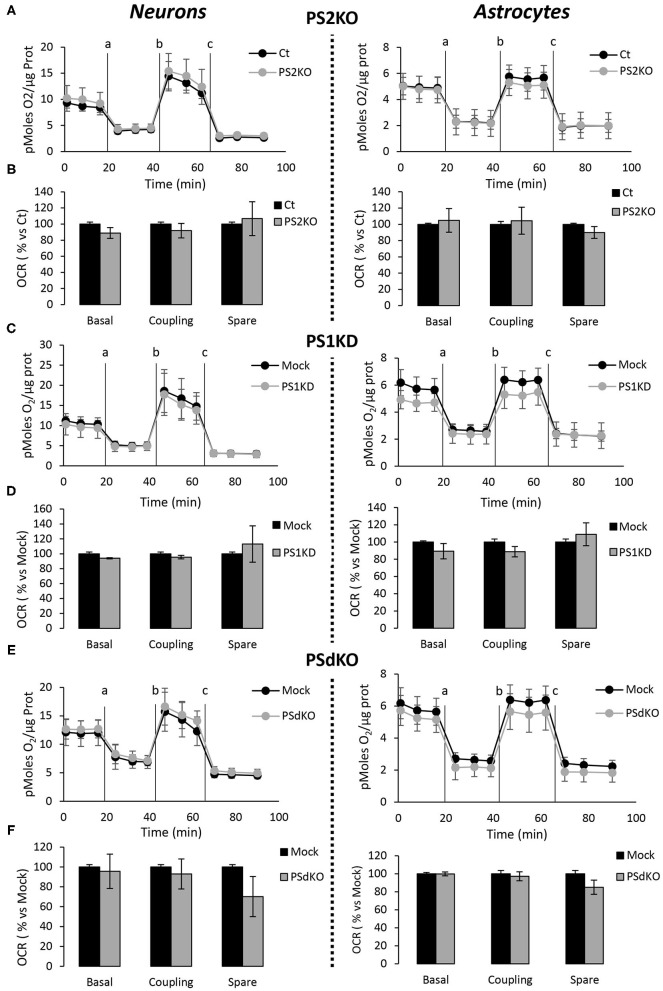
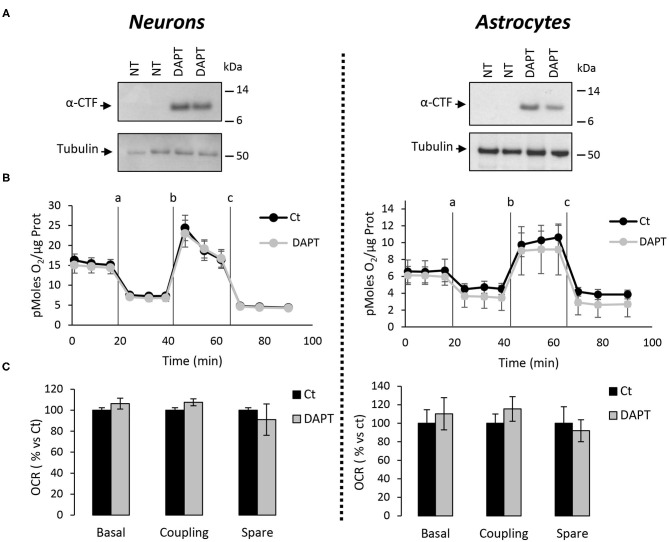
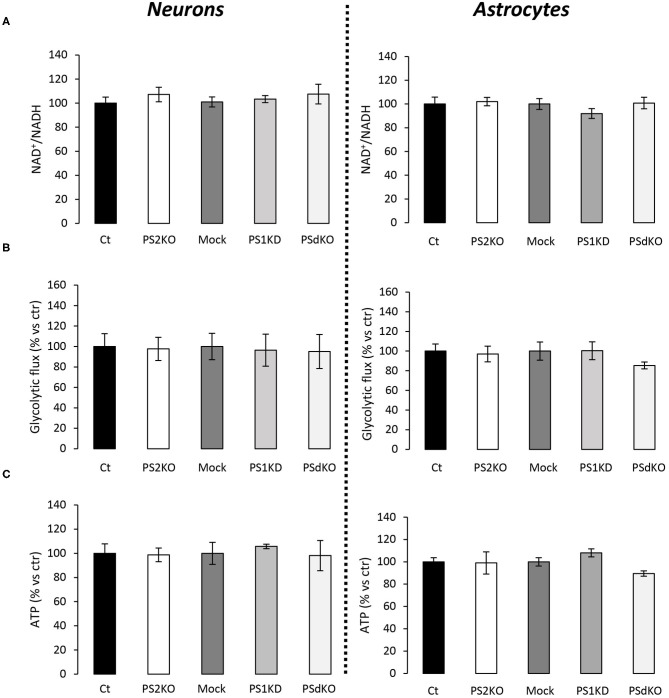
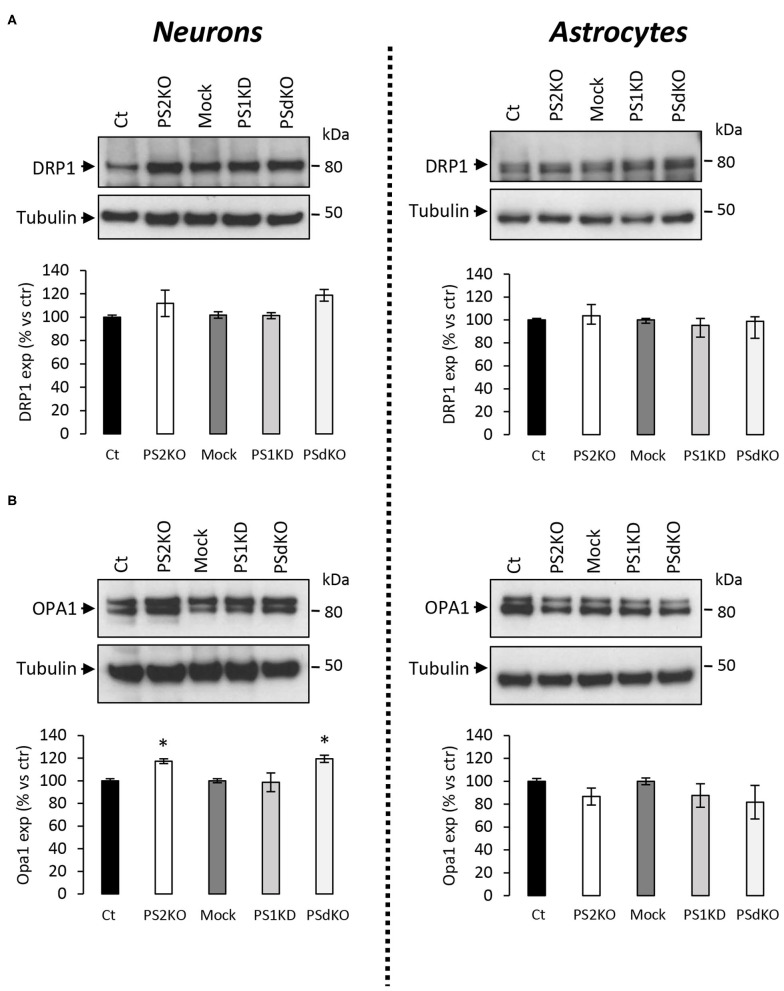
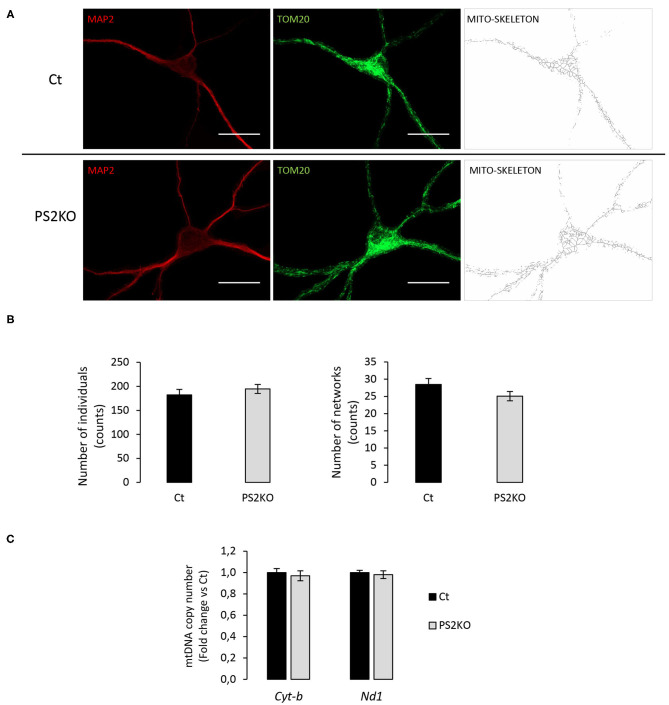
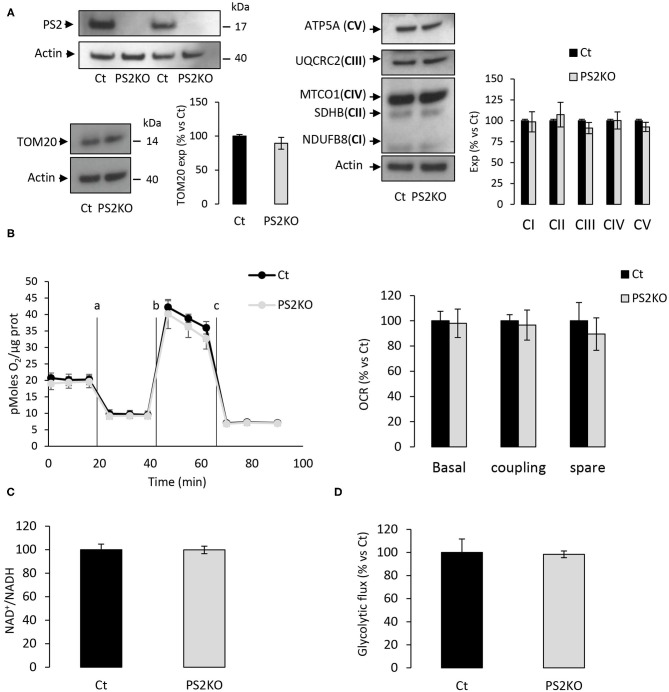
Presenilin 1 (PS1) and Presenilin 2 (PS2) are predominantly known as the catalytic subunits of the γ-secretase complex that generates the amyloid-β (Aβ) peptide, the major constituent of the senile plaques found in the brain of Alzheimer's disease (AD) patients. Apart from their role in γ-secretase activity, a growing number of cellular functions have been recently attributed to PSs. Notably, PSs were found to be enriched in mitochondria-associated membranes (MAMs) where mitochondria and endoplasmic reticulum (ER) interact. PS2 was more specifically reported to regulate calcium shuttling between these two organelles by controlling the formation of functional MAMs. We have previously demonstrated in mouse embryonic fibroblasts (MEF) an altered mitochondrial morphology along with reduced mitochondrial respiration and increased glycolysis in PS2-deficient cells (PS2KO). This phenotype was restored by the stable re-expression of human PS2. Still, all these results were obtained in immortalized cells, and one bottom-line question is to know whether these observations hold true in central nervous system (CNS) cells. To that end, we carried out primary cultures of PS1 knockdown (KD), PS2KO, and PS1KD/PS2KO (PSdKO) neurons and astrocytes. They were obtained from the same litter by crossing PS2 heterozygous; PS1 floxed (PS2+/-; PS1flox/flox) animals. Genetic downregulation of PS1 was achieved by lentiviral expression of the Cre recombinase in primary cultures. Strikingly, we did not observe any mitochondrial phenotype in PS1KD, PS2KO, or PSdKO primary cultures in basal conditions. Mitochondrial respiration and membrane potential were similar in all models, as were the glycolytic flux and NAD+/NADH ratio. Likewise, mitochondrial morphology and content was unaltered by PS expression. We further investigated the differences between results we obtained here in primary nerve cells and those previously reported in MEF cell lines by analyzing PS2KO primary fibroblasts. We found no mitochondrial dysfunction in this model, in line with observations in PS2KO primary neurons and astrocytes. Together, our results indicate that the mitochondrial phenotype observed in immortalized PS2-deficient cell lines cannot be extrapolated to primary neurons, astrocytes, and even to primary fibroblasts. The PS-dependent mitochondrial phenotype reported so far might therefore be the consequence of a cell immortalization process and should be critically reconsidered regarding its relevance to AD.

Keywords: Alzheimer's disease; OXPHOS; astrocyte; mitochondria; neuron; presenilins.


Conflict of interest statement

The authors declare that the research was conducted in the absence of any commercial or financial relationships that could be construed as a potential conflict of interest.

Figures

Figure 1
Figure 1
Experimental workflow and model characterization in PS-defective primary nerve cells. (A) Workflow description of the experiments with specificity for PSEN1 deletion. Primary neuronal and astrocyte cultures were performed on embryos at day 17 (E17) and postnatal pups at day 2 after birth (P2), respectively. Generation of the different genotypes in the same litter were obtained from crossing PS2 heterozygous and PS1 floxed (PS2+/−; PS1flox/flox) animals followed where necessary by viral transduction. At DIV1 for neurons and DIV17 for astrocytes, cells were either non-infected (Ct and PS2KO) or infected with GFP (Mock) or CRE-GFP to induce PSEN1 gene deletion (PS1KD and PSdKO). Experiments were performed after 11 days for neurons and 24 days (including 7 days of differentiation) for astrocytes. Ex2 and Ex3 = PSEN1 exons 2 and 3, respectively. (B,C) Representative WBs showing PS1 and PS2 expression profiles (left panel) and APP C-terminal fragment (α-CTFs; right panel) in total cell lysates from primary neuronal (B) and astrocyte (C) cultures. Tubulin was used as loading control. Quantification of PS1 expression (means ± sem) is given as percentage of signal measured in control cells (Mock); ****p < 0.0001; **p < 0.01; Student's t-test for neurons results and Mann-Whitney test for astrocytes results (N = 6).
Figure 2
Figure 2
Morphology of PS-defective primary neuronal and astrocyte cultures. On the left side, a primary culture of neurons at DIV11 immuno-stained with glial-specific protein GFAP (blue) and the neuron-specific protein MAP2 (red) antibodies. On the right side, a primary culture of astrocytes at DIV24 immuno-stained with GFAP (blue) antibody. Scale bar = 100 μm.
Figure 3
Figure 3
ΔΨ and OXPHOS complexes expression in PS-deficient primary nerve cells. Experiments were performed on primary DIV11 neuronal cultures and primary DIV24 astrocytes cultures. Cell conditions were Ct vs. PS2KO, Mock (infection control) vs. PS1KD and PSdKO. (A) Representative WBs and quantifications of TOM20 profile expression; in primary neuronal cell lysates (left panel) and in primary astrocyte cell lysates (right panel). Tubulin was used as a loading control. Results (mean ± sem) are expressed as percentage of the respective control (ctr = Ct or Mock) (min N = 2). Kruskal–Wallis test and Dunn's multiple comparison test. (B) ΔΨ was evaluated with the TMRM probe in the presence or absence of FCCP, an uncoupling agent used as control (striped columns). Fluorescence signal was measured with a plate reader and results are expressed as the percentage of the relative mean fluorescence of the respective control cells (ctr = Ct or Mock) (min N = 3). ANOVA and Tukey's multiple comparison test. ****p < 0.0001. (C) The expression level of representative protein subunits from each of the five mitochondrial complexes (NDUFB8 for CI; SDHB for CII; UQCRC2 for CIII; MTCO1 for CIV; ATP5A for CV) was evaluated by WB on cell lysates. Actin was used as a loading control. Dashed lines indicate that proteins were run on the same gel, but lanes are not contiguous. Quantifications of the different WBs (means ± sem) are given as percentage of signal measured in the respective control cells (Ct or Mock) (min N = 3). ANOVA and Tukey's multiple comparison test.
Figure 4
Figure 4
Assessment of the OXPHOS capacity in primary nerve cultures genetically deleted for PSs. Oxygen consumption rate (OCR) was evaluated by using the Seahorse XF96 bioenergetic analyzer. Experiments were carried out in primary DIV11 neuronal cultures (left panel) and in primary DIV24 astrocyte cultures (right panel). Cell conditions were wild-type non-infected (Ct) vs. PS2KO; control infection (Mock) vs. PS1KD and PSdKO. (A,C,E) General profile of the OCR with vertical lines indicating the time point at which the different compounds have been added: a. Oligomycin (CV inhibitor) b. FCCP (ΔΨ uncoupler) c. Rotenone (CI inhibitor) and antimycin A (CIII inhibitor). Values (means ± sem) are given in pmol O2/min/μg protein (min N = 3). (B,D,F) The basal respiration, the coupling ratio and the spare respiratory capacity were calculated according to the Cell Mito Stress Test kit's recommended protocol. Values (means ± sem) are given as percentage of signal measured in the respective control cells (Ct or Mock) (min N = 3). ANOVA and Tukey's multiple comparison test.
Figure 5
Figure 5
Assessment of the OXPHOS capacity in primary nerve cultures treated with DAPT. OCR was evaluated by using the Seahorse XF96 bioenergetic analyzer. Experiments were performed in primary neurons (DIV11) or primary astrocytes (DIV7) wild-type non-treated (NT or Ct) or treated with DAPT. (A) Accumulation of α-CTF upon treatment with 10 μM of DAPT for 24 h of control primary nerve cultures was evaluated by WB with an antibody targeting the C-terminal region of APP. Tubulin was used as loading control. (B) General profile of the OCR with vertical lines indicate the time point at which the different compounds have been added: a. Oligomycin (CV inhibitor) b. FCCP (ΔΨ uncoupler) c. Rotenone (CI inhibitor) and antimycin A (CIII inhibitor). Values (means ± sem) are given in pmol O2/min/μg protein (N = 3). (C) The basal respiration, the coupling ratio, and the spare respiratory capacity were calculated according to the Cell Mito Stress Test kit's recommended protocol. Values (means ± sem) are given as percentage of signal measured in control cells (Ct). Student's t-test for neurons results (N = 3) and Mann-Whitney test for astrocytes results (N = 2).
Figure 6
Figure 6
Evaluation of ATP levels, NAD+/NADH ratio, and glycolytic flux in primary nerve cultures. Experiments were performed respectively at DIV11 and DIV24 in neuronal (left panel) and astrocytes (right panel) cultures. Cell conditions were wild-type non-infected (Ct) vs. PS2KO; Mock (infection control) vs. PS1KD and PSdKO. (ctr = Ct or Mock). (A) NAD+/NADH ratio was quantified by a bioluminescent kit (min N = 3). (B) Glycolysis rate was determined by the detritiation rate of [3-3H] glucose after a 30 min incubation. Data were normalized to protein content (min N = 3). (C) ATP level was quantified by a bioluminescent kit (min N = 3). ANOVA and Tukey's multiple comparison test.
Figure 7
Figure 7
Expression of mitochondrial fusion and fission proteins in PS-deficient primary nerve cells. Experiments were performed on primary DIV11 neuronal cultures and primary DIV24 astrocytes cultures. Cell conditions were Ct vs. PS2KO, Mock (infection control) vs. PS1KD and PSdKO. (A) Representative WBs and quantifications of DRP1 profile expression; in primary neuronal cell lysates (left panel) and in primary astrocyte cell lysates (right panel). Tubulin was used as a loading control. Results (mean ± sem) are expressed as percentage of the respective control (ctr = Ct or Mock) (min N = 2). Kruskal–Wallis test and Dunn's multiple comparison test. (B) Representative WBs and quantifications of OPA1 profile expression; in primary neuronal cell lysates (left panel) and in primary astrocyte cell lysates (right panel). Tubulin was used as a loading control. Results (mean ± sem) are expressed as percentage of the respective control (ctr = Ct or Mock) (min N = 4). ANOVA and Tukey's multiple comparison test, *p < 0.05.
Figure 8
Figure 8
Evaluation of mitochondrial morphology and content in PS2KO neurons. (A) Mitochondria from wild-type non-infected (Ct) and PS2KO neurons at DIV11 were stained with an anti-TOM20 antibody (green) and mature neurons were identified with MAP2 (red). Confocal microscope images were acquired and TOM20 images were processed using the MiNA toolset to generate accurate mitochondrial skeletons for further analysis. Scale bar = 20 μm. (B) Quantification of individuals (counts) and networks (counts) are shown in the graphs. Results are presented as mean ± sem. Student's t-test (n = 55 from N = 3 independent experiments). (C) RT-qPCR analysis of mitochondrial DNA content (Cyt-b and Nd1 mitochondrial genes) in wild-type non-infected (Ct) and PS2KO neurons at DIV11. Results (mean ± sem) are expressed as percentage of the respective control (Ct) (min N = 4).
Figure 9
Figure 9
Metabolic characterization of PS2 deficient primary MEF. Experiments were carried out in primary MEF derived from E16 WT mice (Ct) or PS2KO mice (PS2KO). (A) Expression profile of PS2 (left panel, up), TOM20 (left panel, down), and representative protein subunits from each of the five mitochondrial complexes (right panel; NDUFB8 for CI; SDHB for CII; UQCRC2 for CIII; MTCO1 for CIV; ATP5A for CV), evaluated by WB on cell lysates. Actin was used as a loading control. Quantifications of the different WBs (means ± sem) are given as percentage of signal measured in control cells (Ct) (min N = 3). Student's t-test. (B) Left panel: General OCR profile of primary MEF Ct vs. PS2KO. Values (means ± sem) are given in pmol O2/min/μg protein. Right panel: The basal respiration, the coupling ratio and the spare respiratory capacity. Values (means ± sem) are given as percentage of signal measured in control cells (Ct) (N = 3). (C) NAD+/NADH ratio was quantified by a bioluminescent kit (N = 4). (D) Glycolytic rate was determined by the detritiation rate of [3-3H] glucose after a 30 min incubation. Data were normalized to protein content (N = 3). Student's t-test.

References

    1. Adav S. S., Park J. E., Sze S. K. (2019). Quantitative profiling brain proteomes revealed mitochondrial dysfunction in Alzheimer's disease. Mol. Brain 12:8. 10.1186/s13041-019-0430-y - DOI - PMC - PubMed
    1. Andersson E. R., Lendahl U. (2014). Therapeutic modulation of notch signalling–are we there yet? Nat. Rev. Drug Discov. 13, 357–378. 10.1038/nrd4252 - DOI - PubMed
    1. Area-Gomez E., de Groof A. J., Boldogh I., Bird T. D., Gibson G. E., Koehler C. M., et al. . (2009). Presenilins are enriched in endoplasmic reticulum membranes associated with mitochondria. Am. J. Pathol. 175, 1810–1816. 10.2353/ajpath.2009.090219 - DOI - PMC - PubMed
    1. Behbahani H., Shabalina I. G., Wiehager B., Concha H., Hultenby K., Petrovic N., et al. . (2006). Differential role of Presenilin-1 and−2 on mitochondrial membrane potential and oxygen consumption in mouse embryonic fibroblasts. J. Neurosci. Res. 84, 891–902. 10.1002/jnr.20990 - DOI - PubMed
    1. Bird M. J., Wijeyeratne X. W., Komen J. C., Laskowski A., Ryan M. T., Thorburn D. R., et al. . (2014). Neuronal and astrocyte dysfunction diverges from embryonic fibroblasts in the Ndufs4fky/fky mouse. Biosci. Rep. 34:e00151. 10.1042/BSR20140151 - DOI - PMC - PubMed