

Modulation of the Gut Microbiota and Liver Transcriptome by Red Yeast Rice and Monascus Pigment Fermented by Purple Monascus SHM1105 in Rats Fed with a High-Fat Diet
- PMID: 33551805
- PMCID: PMC7859525
- DOI: 10.3389/fphar.2020.599760
Modulation of the Gut Microbiota and Liver Transcriptome by Red Yeast Rice and Monascus Pigment Fermented by Purple Monascus SHM1105 in Rats Fed with a High-Fat Diet
Abstract
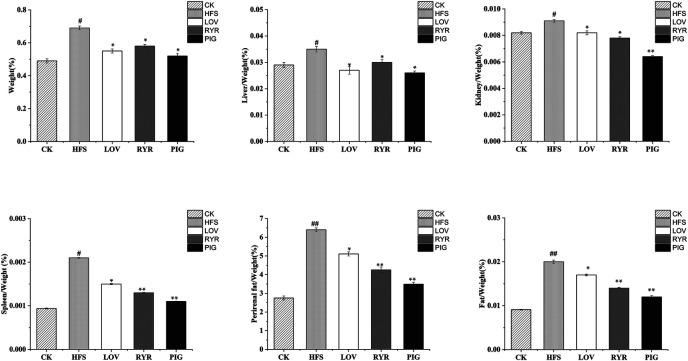
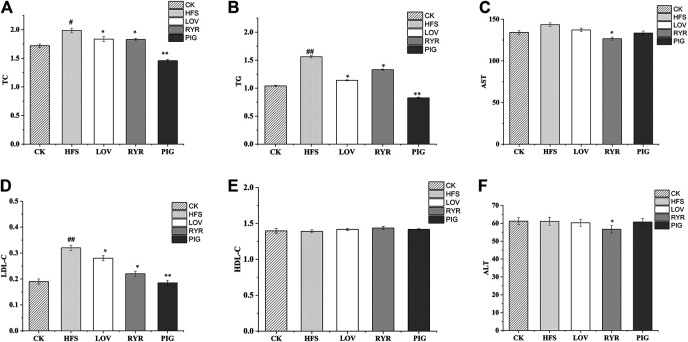
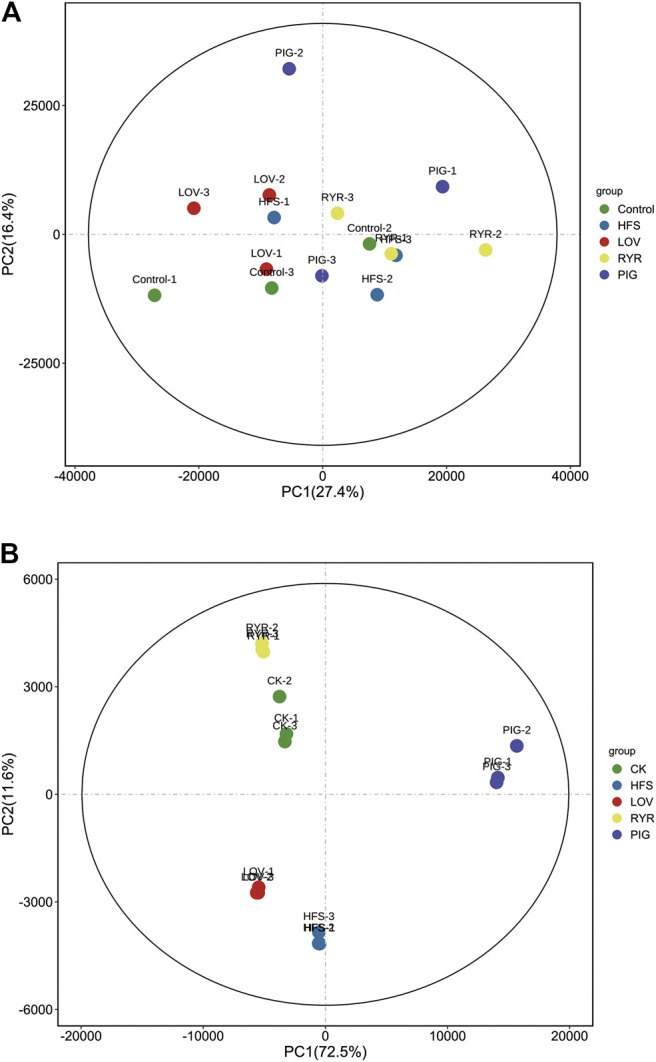
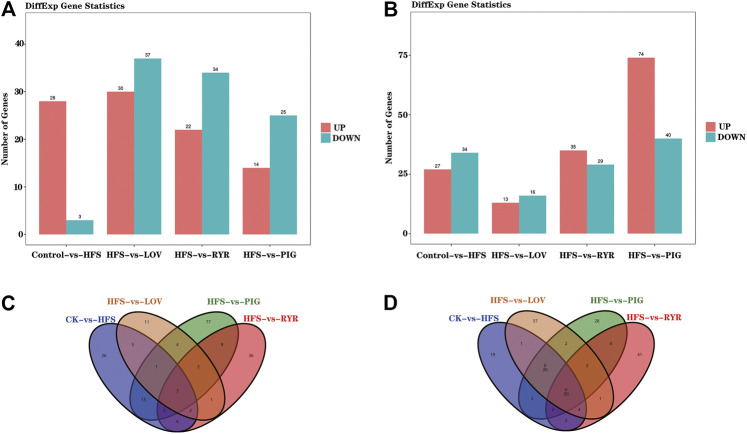
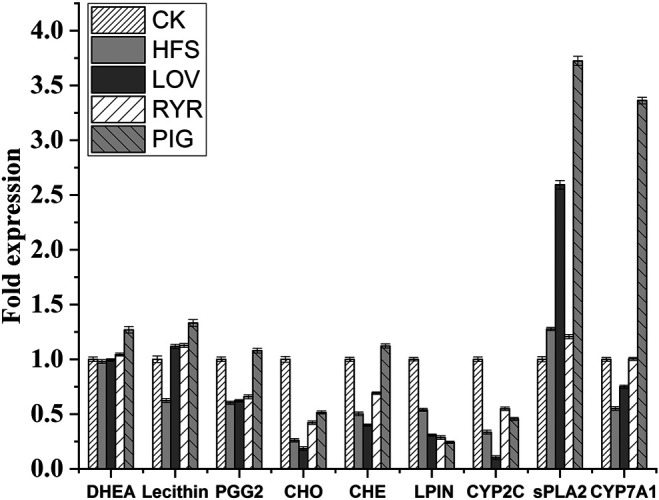
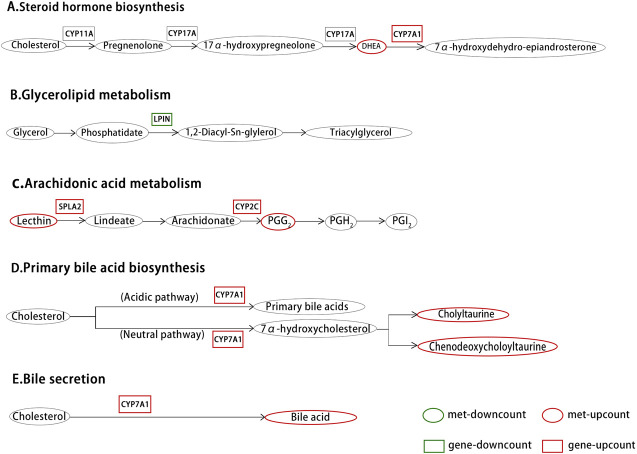
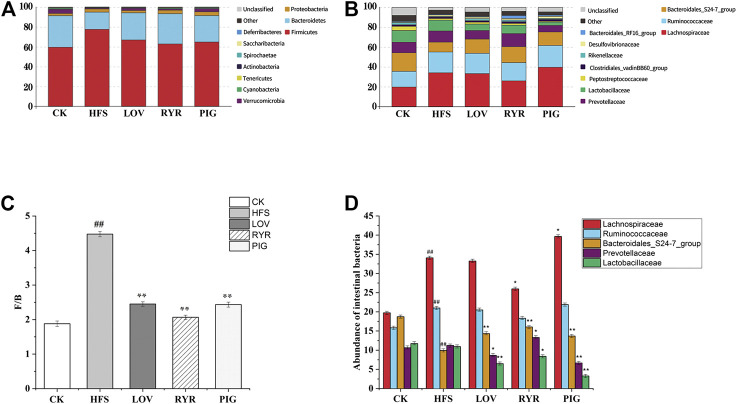
Hyperlipidemia can easily cause atherosclerosis and induce cardiovascular and cerebrovascular diseases. Red yeast rice (RYR) contains a variety of active ingredients and is commonly used as medicine and food, and has pharmacological effects such as lowering blood lipids. In this study, we select Monascus strain SHM1105 with a high yield of Monacolin K and monascus pigment (PIG), and studied the effects of the RYR and PIG fermented by this strain on blood lipids, intestinal flora, and liver transcriptome in hyperlipidemia model rats. The experimental results show that, compared with the high-fat model group, the weight growth rate, liver weight ratio, kidney weight ratio, spleen weight ratio, and fat weight ratio of rats in the gavage lovastatin (LOV), RYR, and PIG group were all significantly decreased (p < 0.05). Intervention with RYR and PIG can significantly reduce the serum TC, TG, and LDL-C levels, which has the effect of lowering blood lipids. The 16SrDNA sequencing results showed that the ratio of Firmicutes/Bacteroidetes decreased significantly (p ≤ 0.01) after the intervention of LOV, RYR, and PIG; the abundance of the ratio of Lachnospiraceae, Ruminococcaceae, Prevotellaceae, and Bacteroidales-S24-7-group also changed. The combined analysis of transcriptome and metabolome showed that lovastatin, RYR, and PIG can all improve lipid metabolism in rats by regulating Steroid hormone biosynthesis, Glycerolipid metabolism, and the Arachidonic acid metabolism pathway. In addition, RYR and PIG also have a unique way of regulating blood lipids. Although a lot of research on the lipid-lowering components of Monascus rice and the single pigment component of Monascus has been carried out, the actual application is RYR and pigments as mixtures, as a mixture of RYR and PIG contains a variety of biologically active ingredients, and each component may have a synergistic effect. Hence it has a lipid-lowering mechanism that lovastatin does not have. Therefore, RYR and PIG are effective in reducing lipid potential development and can be utilized in functional foods.
Keywords: RNA-seq; hyperlipidaemia; intestinal flora; pigment; red yeast rice.
Copyright © 2021 Yang, Pan, Wang, Zheng, Li, Guo and Wang.
Conflict of interest statement
Author RP was employed by Zhejiang Sanhe Bio-Tech Co., Ltd. Zhejiang Sanhe Bio-Tech Co., Ltd. provided technical support for this study, such as strain and lovastatin detection. The remaining authors declare that the research was conducted in the absence of any commercial or financial relationships that could be construed as a potential conflict of interest.
Figures
Similar articles
-
Monascus purpureus-fermented Thai glutinous rice reduces blood and hepatic cholesterol and hepatic steatosis concentrations in diet-induced hypercholesterolemic rats.BMC Complement Altern Med. 2015 Mar 28;15:88. doi: 10.1186/s12906-015-0624-5. BMC Complement Altern Med. 2015. PMID: 25880551 Free PMC article.
-
A Randomized Clinical Efficacy Trial of Red Yeast Rice (Monascus pilosus) Against Hyperlipidemia.Am J Chin Med. 2019;47(2):323-335. doi: 10.1142/S0192415X19500150. Epub 2019 Mar 14. Am J Chin Med. 2019. PMID: 30871361 Clinical Trial.
-
The effect of red yeast rice (Monascus purpureus) in dyslipidemia and other disorders.Complement Ther Med. 2012 Dec;20(6):466-74. doi: 10.1016/j.ctim.2012.07.004. Epub 2012 Aug 17. Complement Ther Med. 2012. PMID: 23131380 Review.
-
Monascus yellow, red and orange pigments from red yeast rice ameliorate lipid metabolic disorders and gut microbiota dysbiosis in Wistar rats fed on a high-fat diet.Food Funct. 2019 Feb 20;10(2):1073-1084. doi: 10.1039/c8fo02192a. Food Funct. 2019. PMID: 30720827
-
Functional food red yeast rice (RYR) for metabolic syndrome amelioration: a review on pros and cons.World J Microbiol Biotechnol. 2016 May;32(5):87. doi: 10.1007/s11274-016-2035-2. Epub 2016 Apr 2. World J Microbiol Biotechnol. 2016. PMID: 27038957 Review.
Cited by
-
Proteomics and Its Combined Analysis with Transcriptomics: Liver Fat-Lowering Effect of Taurine in High-Fat Fed Grouper (Epinephelus coioides).Animals (Basel). 2024 Jul 11;14(14):2039. doi: 10.3390/ani14142039. Animals (Basel). 2024. PMID: 39061501 Free PMC article.
-
Integrated Metabolomic and Transcriptomic Analysis Reveals Potential Gut-Liver Crosstalks in the Lipogenesis of Chicken.Animals (Basel). 2023 May 17;13(10):1659. doi: 10.3390/ani13101659. Animals (Basel). 2023. PMID: 37238090 Free PMC article.
-
Monascus red pigments alleviate high-fat and high-sugar diet-induced NAFLD in mice by modulating the gut microbiota and metabolites.Food Sci Nutr. 2024 May 21;12(8):5762-5775. doi: 10.1002/fsn3.4208. eCollection 2024 Aug. Food Sci Nutr. 2024. PMID: 39139961 Free PMC article.
-
Autoclaving-treated germinated brown rice relieves hyperlipidemia by modulating gut microbiota in humans.Front Nutr. 2024 May 17;11:1403200. doi: 10.3389/fnut.2024.1403200. eCollection 2024. Front Nutr. 2024. PMID: 38826585 Free PMC article.
-
Monascus red pigment influence on hydroxyapatite nanoparticles-mediated renal toxicity in rats.Sci Rep. 2025 Jan 21;15(1):2715. doi: 10.1038/s41598-024-84959-z. Sci Rep. 2025. PMID: 39837868 Free PMC article.
References
-
- Ali A. N., Kim J. J., Pisano M. E., Goad N. T. (2017). Drugs that affect lipid metabolism. Worldwide Yearly Surv. New Data Adverse Drug React. 6 (33), 457–463. 10.1016/bs.seda.2017.06.033 - DOI
LinkOut - more resources
Full Text Sources
Other Literature Sources
Miscellaneous