. 2021 Jan 20:11:573095.
doi: 10.3389/fneur.2020.573095. eCollection 2020.

The Spatial and Cell-Type Distribution of SARS-CoV-2 Receptor ACE2 in the Human and Mouse Brains

Affiliations

The Spatial and Cell-Type Distribution of SARS-CoV-2 Receptor ACE2 in the Human and Mouse Brains

Rongrong Chen et al. Front Neurol. .

Abstract

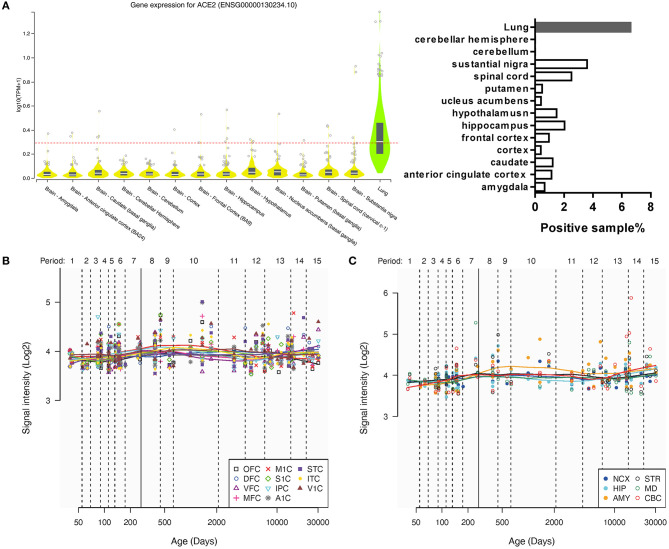
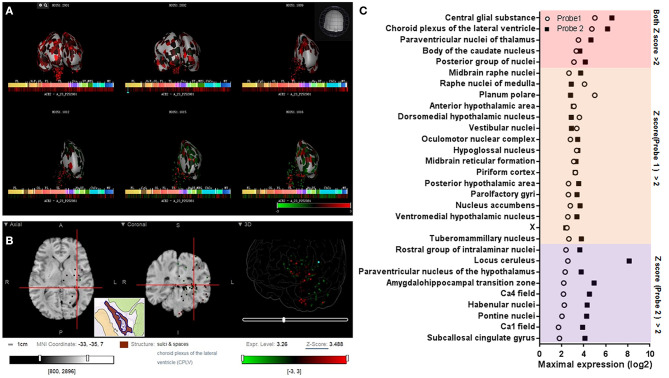
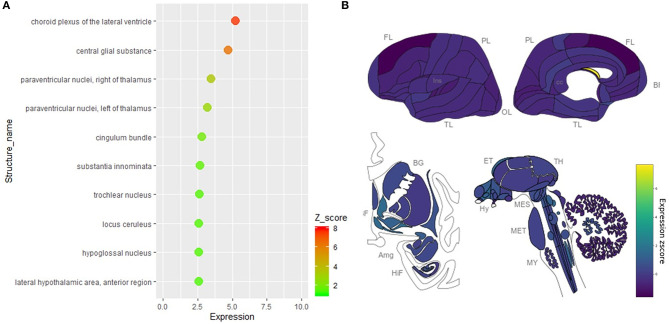
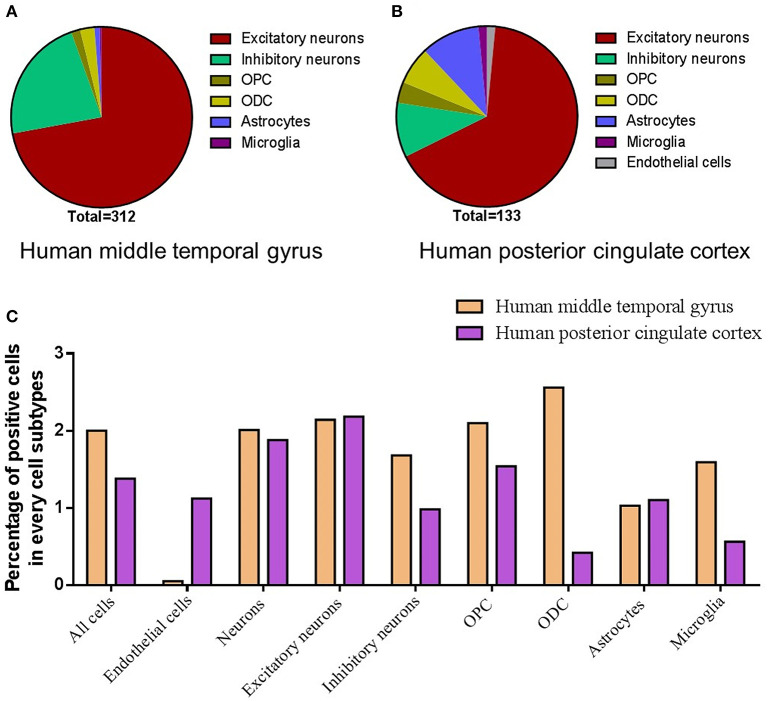
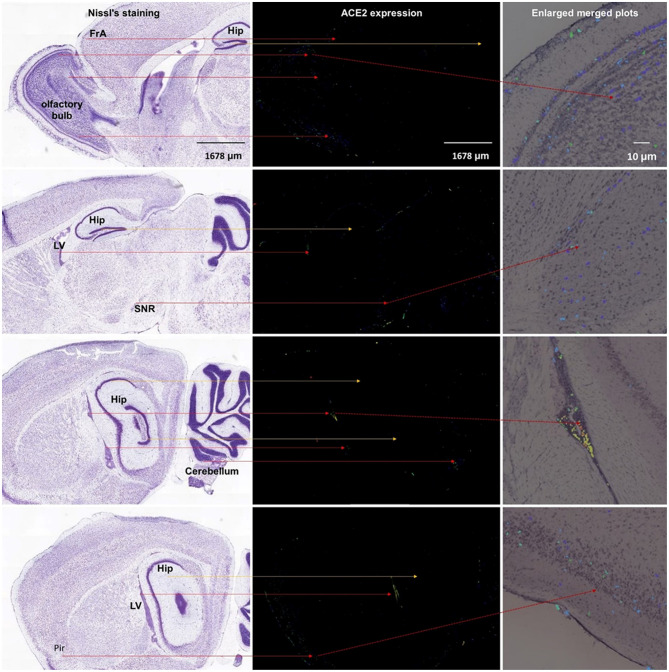
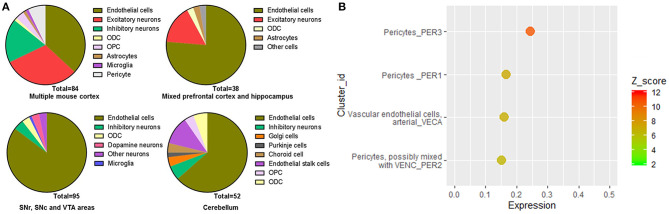
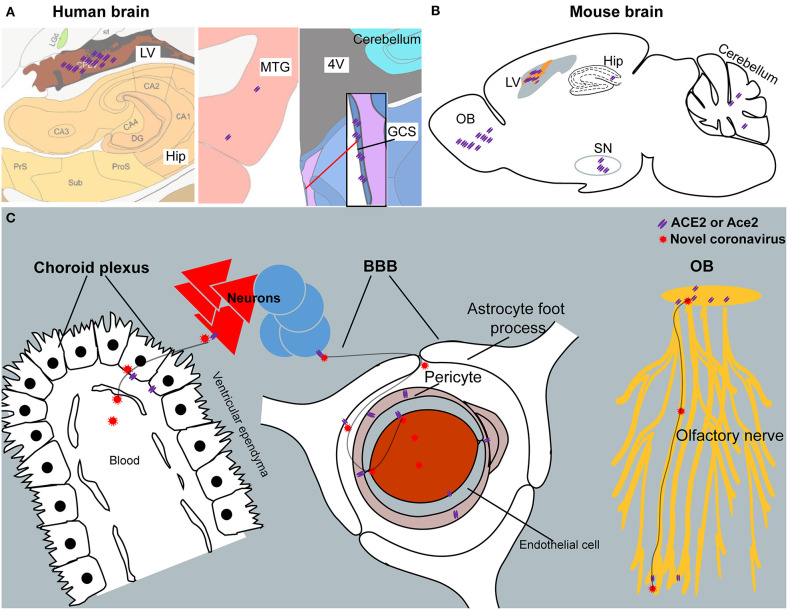
By engaging angiotensin-converting enzyme 2 (ACE2 or Ace2), the novel pathogenic severe acute respiratory syndrome coronavirus 2 (SARS-CoV-2) invades host cells and affects many organs, including the brain. However, the distribution of ACE2 in the brain is still obscure. Here, we investigated the ACE2 expression in the brain by analyzing data from publicly available brain transcriptome databases. According to our spatial distribution analysis, ACE2 was relatively highly expressed in some brain locations, such as the choroid plexus and paraventricular nuclei of the thalamus. According to cell-type distribution analysis, nuclear expression of ACE2 was found in many neurons (both excitatory and inhibitory neurons) and some non-neuron cells (mainly astrocytes, oligodendrocytes, and endothelial cells) in the human middle temporal gyrus and posterior cingulate cortex. A few ACE2-expressing nuclei were found in a hippocampal dataset, and none were detected in the prefrontal cortex. Except for the additional high expression of Ace2 in the olfactory bulb areas for spatial distribution as well as in the pericytes and endothelial cells for cell-type distribution, the distribution of Ace2 in the mouse brain was similar to that in the human brain. Thus, our results reveal an outline of ACE2/Ace2 distribution in the human and mouse brains, which indicates that the brain infection of SARS-CoV-2 may be capable of inducing central nervous system symptoms in coronavirus disease 2019 (COVID-19) patients. Potential species differences should be considered when using mouse models to study the neurological effects of SARS-CoV-2 infection.

Keywords: ACE2; COVID-19; SARS-coronavirus 2; angiotensin-converting enzyme 2; brain.


Conflict of interest statement

The authors declare that the research was conducted in the absence of any commercial or financial relationships that could be construed as a potential conflict of interest.

Figures

Figure 1
Figure 1
The general expression of ACE2 in different human brain areas. (A) The expression of ACE2 in different human brain areas and the lung according to the GTEx Portal database (18). The dotted line means log10(CPM + 1) = 0.3, which means a threshold of the positive sample (>0.3 could be positive). (B,C) Change of intensity of ACE2 expression with age in different human brain areas according to the Human Brain Transcriptome database. Data are expressed as median, interquartile range (IQR), and all sample points in (A), whereas data are expressed as mean and all sample points in (B,C).
Figure 2
Figure 2
Spatial distribution of ACE2 in the human brain according to the Allen Human Brain Atlas. (A) 3D view of the expression of ACE2 in different human brain areas based on the data of probe A_23_P252981 (probe 1). (B) Planar view of the expression of ACE2 in the choroid plexus of the lateral ventricle. The inset shows a sampled area of the choroid plexus of the lateral ventricle (the dark area in the inset). (C) Log2 intensity of ACE2 expression in the 30 brain areas with a z score >2.0 in at least one probe dataset (probe 1: A_23_P252981; probe 2: CUST_16267_PI416261804). All data were generated from the Allen Human Brain Atlas (http://human.brain-map.org/microarray/search). Images in (A,B) were directly from the Allen Human Brain Atlas (© 2010 Allen Institute for Brain Science, Allen Human Brain Atlas, available from: http://human.brain-map.org).
Figure 3
Figure 3
Spatial distribution of ACE2 in the human brain according to the pooled data of the Allen Human Brain Atlas. (A) The expression intensity and z score of ACE2 in the top 10 brain areas of the pooled expression data of the two probes. (B) The distribution view of ACE2 expression in the human brain according to the pooled expression data of the two probes. Original data are available from the Allen Human Brain Atlas (http://human.brain-map.org/microarray/search). Brain region abbreviations: FL, frontal lobe; PL, parietal lobe; TL, temporal lobe; OL, occipital lobe; BF, basal forebrain; BG, basal ganglia; AmG, amygdala; HiF, hippocampal formation; EP, epithalamus; TH, thalamus; Hy, hypothalamus; MES, mesencephalon; MET, metencephalon; MY, myelencephalon.
Figure 4
Figure 4
Cell-type distribution of ACE2 in the human brain. (A) The cell-type proportion of the total positive cells in the human middle temporal gyrus. (B) The cell-type proportion of the total positive cells in the human posterior cingulate cortex. (C) The percentage of positive cells in different cell subtypes in the human middle temporal gyrus and posterior cingulate cortex. Original data are from https://celltypes.brain-map.org/rnaseq/human/mtg and https://singlecell.broadinstitute.org.
Figure 5
Figure 5
Spatial distribution of ACE2 in the mouse brain. The left column means the Nissl staining of mouse brain slice, the middle column means the ACE2 expression by antisense, and the right column means the enlarged merged plots from the Brain Explorer 2.0 software. Hip, hippocampus; LV, lateral ventricle; SNR, substantia nigra pars reticulate; Pir, piriform cortex. All images are from the Allen Mouse Brain Atlas (© 2004 Allen Institute for Brain Science, Allen Mouse Brain Atlas, available from https://mouse.brain-map.org/).
Figure 6
Figure 6
Cell-type distribution of Ace2 in the mice brain. (A) Cell-type distribution of Ace2 according to the Single Cell Portal database (https://singlecell.broadinstitute.org/). (B) Top cell-type cluster expression of Ace2 according to the Mouse Brain Atlas database (http://mousebrain.org).
Figure 7
Figure 7
The summary schematic figure. (A) The distribution of ACE2 in the choroid plexus of the lateral ventricle (LV), hippocampus (Hip), middle temporal gyrus (MTG), and central glial substance (CGS) in the human brain. Pictures are modified from the human brain atlas (http://atlas.brain-map.org/) of the Allen Brain Atlas. (B) Representative ACE2 expression in the olfactory bulb (OB), choroid plexus of the lateral ventricle (LV), hippocampus (Hip), substantia nigra (SN), and cerebellum in the mouse brain. (C) Three potential routes for SARS-CoV-2 entering the CSF and/or spreading around the brain. Another potential route for SARS-CoV-2 entering the CSF from the CGS is not listed because of limited information regarding this brain area.

References

    1. Liu Y, Eggo RM, Kucharski AJ. Secondary attack rate and superspreading events for SARS-CoV-2. Lancet. (2020) 395:e47. 10.1016/S0140-6736(20)30462-1 - DOI - PMC - PubMed
    1. Li YC, Bai WZ, Hashikawa T. The neuroinvasive potential of SARS-CoV2 may play a role in the respiratory failure of COVID-19 patients. J. Med. Virol. (2020) 92:552–5. 10.1002/jmv.25728 - DOI - PMC - PubMed
    1. Mao L, Wang M, Chen S, He Q, Chang J, Hong C, et al. . Neurological manifestations of hospitalized patients with COVID-19 in Wuhan, China: a retrospective case series study. medRxiv 2020.2002.2022.20026500 (2020). 10.2139/ssrn.3544840 - DOI - PubMed
    1. Glass WG, Subbarao K, Murphy B, Murphy PM. Mechanisms of host defense following severe acute respiratory syndrome-coronavirus (SARS-CoV) pulmonary infection of mice. J. Immunol. (2004) 173:4030–9. 10.4049/jimmunol.173.6.4030 - DOI - PubMed
    1. Puelles VG, Lutgehetmann M, Lindenmeyer MT, Sperhake JP, Wong MN, Allweiss L, et al. . Multiorgan and renal tropism of SARS-CoV-2. N. Engl. J. Med. (2020) 383:590–2. 10.1056/NEJMc2011400 - DOI - PMC - PubMed