Unravelling the Role of Rumen Microbial Communities, Genes, and Activities on Milk Fatty Acid Profile Using a Combination of Omics Approaches
- PMID: 33552010
- PMCID: PMC7859430
- DOI: 10.3389/fmicb.2020.590441
Unravelling the Role of Rumen Microbial Communities, Genes, and Activities on Milk Fatty Acid Profile Using a Combination of Omics Approaches
Abstract
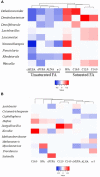
Milk products are an important component of human diets, with beneficial effects for human health, but also one of the major sources of nutritionally undesirable saturated fatty acids (SFA). Recent discoveries showing the importance of the rumen microbiome on dairy cattle health, metabolism and performance highlight that milk composition, and potentially milk SFA content, may also be associated with microorganisms, their genes and their activities. Understanding these mechanisms can be used for the development of cost-effective strategies for the production of milk with less SFA. This work aimed to compare the rumen microbiome between cows producing milk with contrasting FA profile and identify potentially responsible metabolic-related microbial mechanisms. Forty eight Holstein dairy cows were fed the same total mixed ration under the same housing conditions. Milk and rumen fluid samples were collected from all cows for the analysis of fatty acid profiles (by gas chromatography), the abundances of rumen microbiome communities and genes (by whole-genome-shotgun metagenomics), and rumen metabolome (using 500 MHz nuclear magnetic resonance). The following groups: (i) 24 High-SFA (66.9-74.4% total FA) vs. 24 Low-SFA (60.2-66.6%% total FA) cows, and (ii) 8 extreme High-SFA (69.9-74.4% total FA) vs. 8 extreme Low-SFA (60.2-64.0% total FA) were compared. Rumen of cows producing milk with more SFA were characterized by higher abundances of the lactic acid bacteria Lactobacillus, Leuconostoc, and Weissella, the acetogenic Proteobacteria Acetobacter and Kozakia, Mycobacterium, two fungi (Cutaneotrichosporon and Cyphellophora), and at a lesser extent Methanobrevibacter and the protist Nannochloropsis. Cows carrying genes correlated with milk FA also had higher concentrations of butyrate, propionate and tyrosine and lower concentrations of xanthine and hypoxanthine in the rumen. Abundances of rumen microbial genes were able to explain between 76 and 94% on the variation of the most abundant milk FA. Metagenomics and metabolomics analyses highlighted that cows producing milk with contrasting FA profile under the same diet, also differ in their rumen metabolic activities in relation to adaptation to reduced rumen pH, carbohydrate fermentation, and protein synthesis and metabolism.
Keywords: cow; metabolomics; metagenomics; microbial genes; milk fatty acids; rumen microbiome; rumen stress.
Copyright © 2021 Stergiadis, Cabeza-Luna, Mora-Ortiz, Stewart, Dewhurst, Humphries, Watson, Roehe and Auffret.
Conflict of interest statement
The authors declare that the research was conducted in the absence of any commercial or financial relationships that could be construed as a potential conflict of interest.
Figures


Similar articles
-
Multi-omics reveals that the rumen microbiome and its metabolome together with the host metabolome contribute to individualized dairy cow performance.Microbiome. 2020 May 12;8(1):64. doi: 10.1186/s40168-020-00819-8. Microbiome. 2020. PMID: 32398126 Free PMC article.
-
Effects of carbohydrate type or bicarbonate addition to grass silage-based diets on enteric methane emissions and milk fatty acid composition in dairy cows.J Dairy Sci. 2018 Jul;101(7):6085-6097. doi: 10.3168/jds.2017-14041. Epub 2018 Apr 19. J Dairy Sci. 2018. PMID: 29680648
-
Effects of starch-rich or lipid-supplemented diets that induce milk fat depression on rumen biohydrogenation of fatty acids and methanogenesis in lactating dairy cows.Animal. 2019 Jul;13(7):1421-1431. doi: 10.1017/S1751731118003154. Epub 2018 Nov 29. Animal. 2019. PMID: 30488812
-
Association of residual feed intake with peripartal ruminal microbiome and milk fatty acid composition during early lactation in Holstein dairy cows.J Dairy Sci. 2022 Jun;105(6):4971-4986. doi: 10.3168/jds.2021-21454. Epub 2022 Apr 2. J Dairy Sci. 2022. PMID: 35379466
-
Effects of berry seed residues on ruminal fermentation, methane concentration, milk production, and fatty acid proportions in the rumen and milk of dairy cows.J Dairy Sci. 2019 Feb;102(2):1257-1273. doi: 10.3168/jds.2018-15322. Epub 2018 Dec 20. J Dairy Sci. 2019. PMID: 30580953
Cited by
-
Distinguishing the milk microbiota of healthy goats and goats diagnosed with subclinical mastitis, clinical mastitis, and gangrenous mastitis.Front Microbiol. 2022 Aug 25;13:918706. doi: 10.3389/fmicb.2022.918706. eCollection 2022. Front Microbiol. 2022. PMID: 36090116 Free PMC article.
-
Differences in Milk Fatty Acids Profile of Two Breeds of Water Buffaloes Explained by Their Gastrointestinal Microbiota.Animals (Basel). 2024 Jul 23;14(15):2146. doi: 10.3390/ani14152146. Animals (Basel). 2024. PMID: 39123672 Free PMC article.
-
Spatial profiles of the bacterial microbiota throughout the gastrointestinal tract of dairy goats.Appl Microbiol Biotechnol. 2024 Jun 1;108(1):356. doi: 10.1007/s00253-024-13200-8. Appl Microbiol Biotechnol. 2024. PMID: 38822843 Free PMC article.
-
Life at the borderlands: microbiomes of interfaces critical to One Health.FEMS Microbiol Rev. 2024 Mar 1;48(2):fuae008. doi: 10.1093/femsre/fuae008. FEMS Microbiol Rev. 2024. PMID: 38425054 Free PMC article. Review.
-
Associations among Farm, Breed, Lactation Stage and Parity, Gene Polymorphisms and the Fatty Acid Profile of Milk from Holstein, Simmental and Their Crosses.Animals (Basel). 2021 Nov 17;11(11):3284. doi: 10.3390/ani11113284. Animals (Basel). 2021. PMID: 34828016 Free PMC article.
References
-
- Agricultural and Food Research Council (1993). Energy and Protein Requirements of Ruminants. Wallingford, UK: CAB International.
-
- Aue W. P., Bartholdi E., Ernst R. R. (1975). Two-dimensional spectroscopy. application to nuclear magnetic resonance. J. Chem. Phys. 64:2229 10.1063/1.432450 - DOI
LinkOut - more resources
Full Text Sources
Other Literature Sources

