

Database Mining to Unravel the Ecology of the Phylum Chloroflexi in Methanogenic Full Scale Bioreactors
- PMID: 33552017
- PMCID: PMC7854539
- DOI: 10.3389/fmicb.2020.603234
Database Mining to Unravel the Ecology of the Phylum Chloroflexi in Methanogenic Full Scale Bioreactors
Abstract
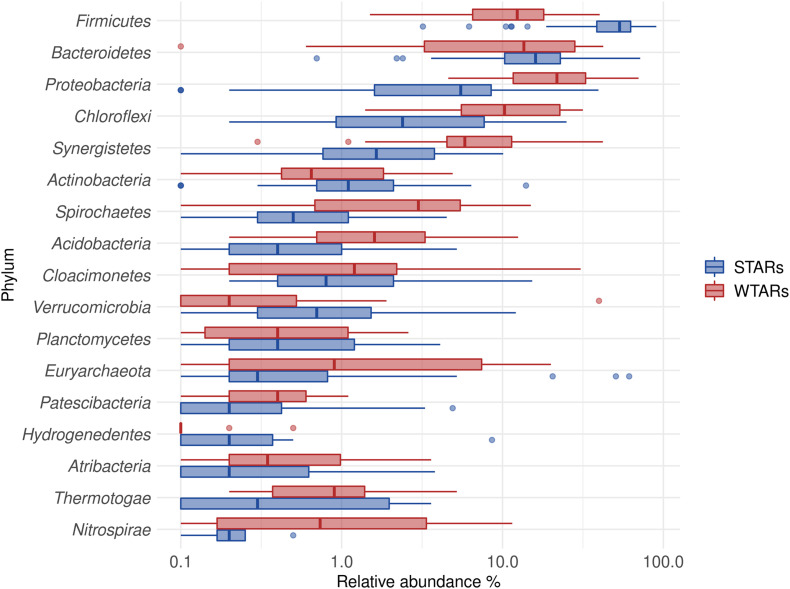
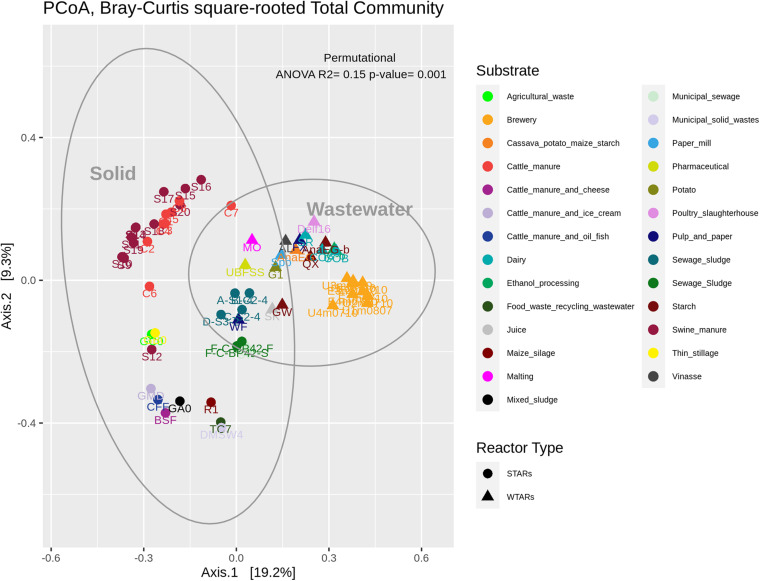
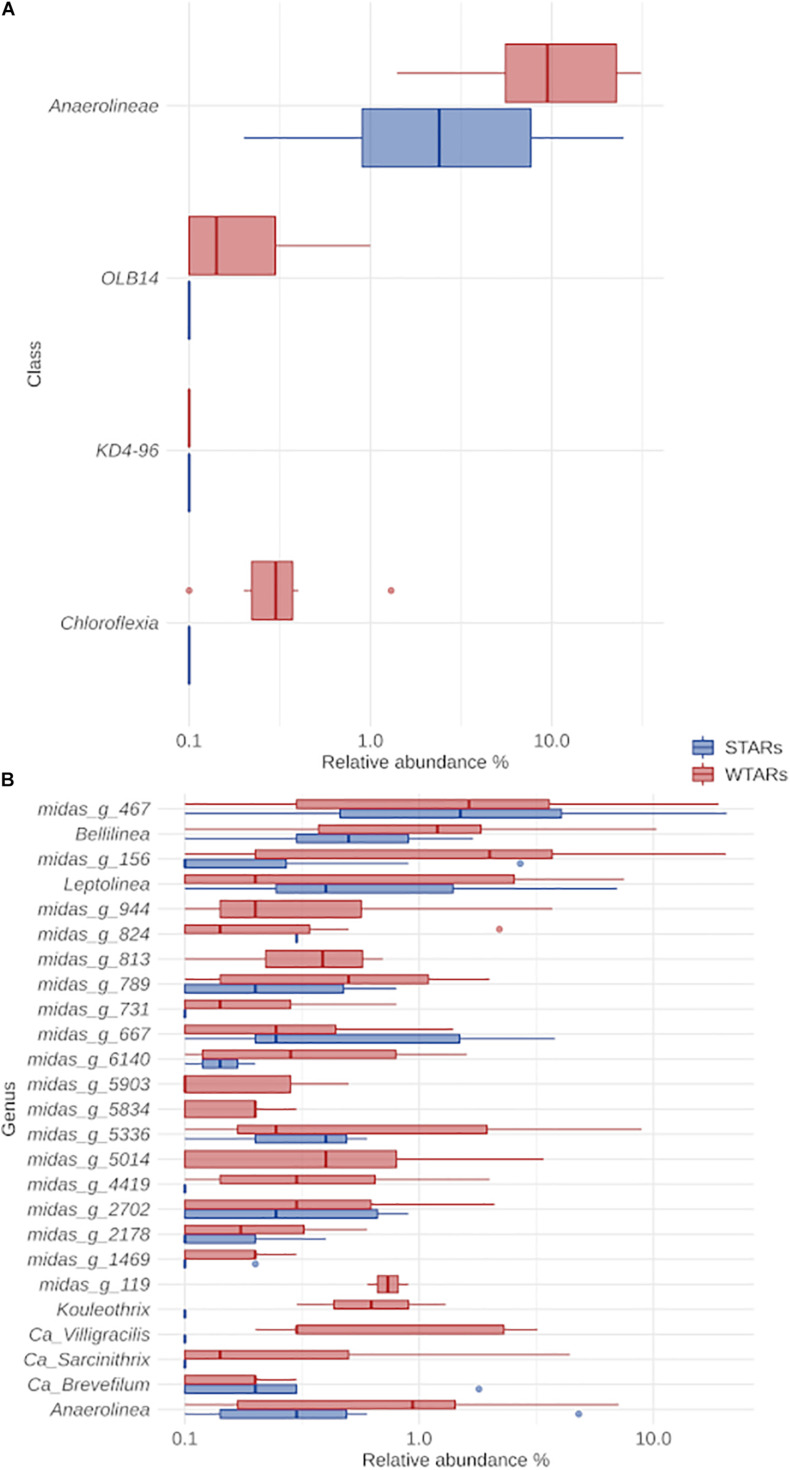
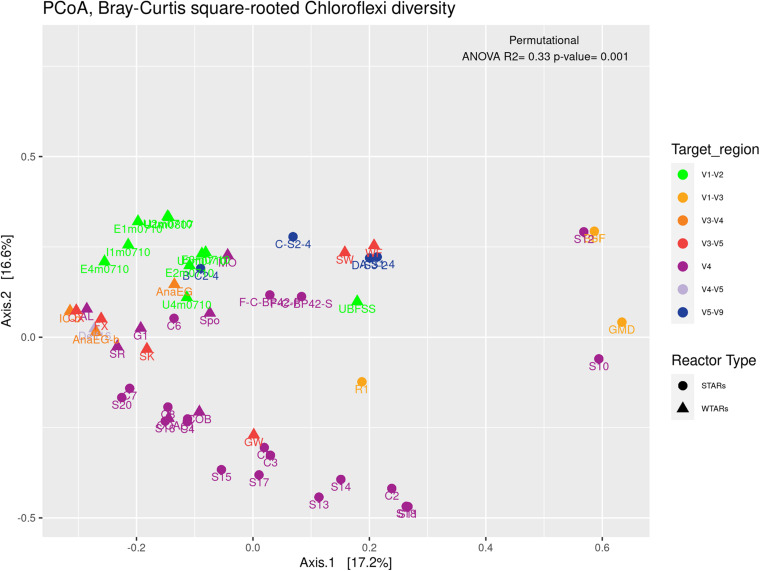
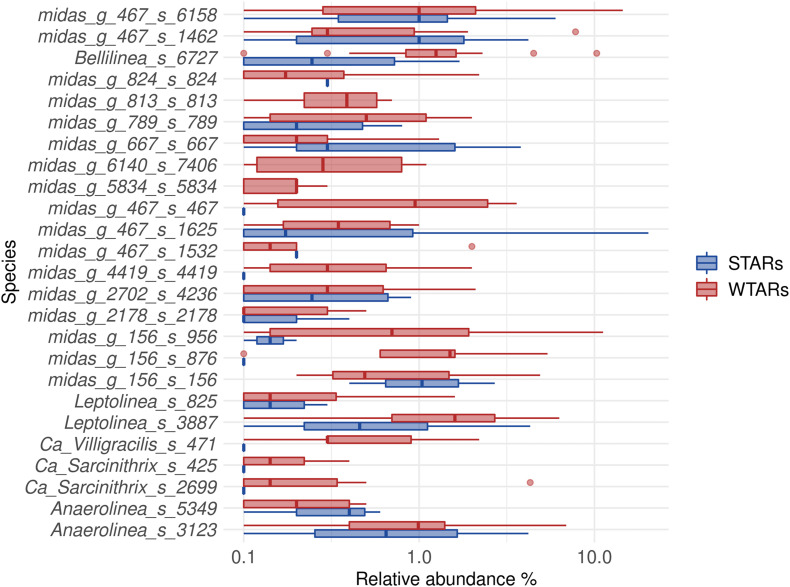
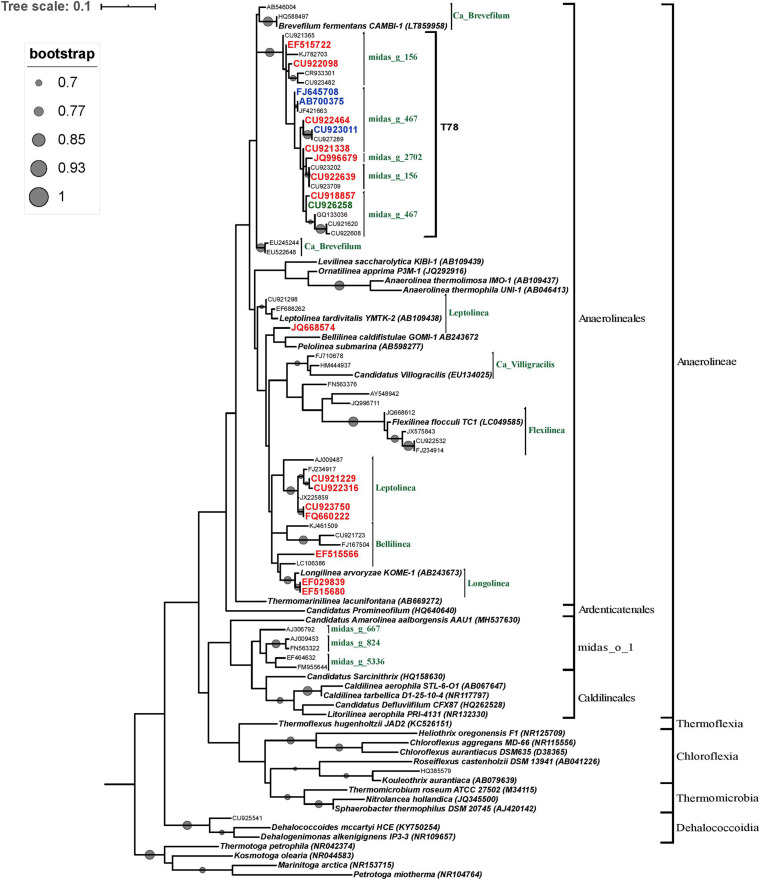
Although microbial communities of anaerobic bioreactors have been extensively studied using DNA-based tools, there are still several knowledge gaps regarding the microbiology of the process, in particular integration of all generated data is still limited. One understudied core phylum within anaerobic bioreactors is the phylum Chloroflexi, despite being one of the most abundant groups in anaerobic reactors. In order to address the abundance, diversity and phylogeny of this group in full-scale methanogenic reactors globally distributed, a compilation of 16S ribosomal RNA gene sequence data from 62 full-scale methanogenic reactors studied worldwide, fed either with wastewater treatment anaerobic reactors (WTARs) or solid-waste treatment anaerobic reactors (STARs), was performed. One of the barriers to overcome was comparing data generated using different primer sets and different sequencing platforms. The sequence analysis revealed that the average abundance of Chloroflexi in WTARs was higher than in STARs. Four genera belonging to the Anaerolineae class dominated both WTARs and STARs but the core populations were different. According to the phylogenetic analysis, most of the sequences formed clusters with no cultured representatives. The Anaerolineae class was more abundant in reactors with granular biomass than in reactors with disperse biomass supporting the hypothesis that Anaerolineae play an important role in granule formation and structure due to their filamentous morphology. Cross-study comparisons can be fruitfully used to understand the complexity of the anaerobic digestion process. However, more efforts are needed to standardize protocols and report metadata information.
Keywords: 16S rRNA amplicon sequence; Chloroflexi; filamentous bacteria; full-scale methanogenic reactors; meta-analysis; wastewater.
Copyright © 2021 Bovio-Winkler, Cabezas and Etchebehere.
Conflict of interest statement
The authors declare that the research was conducted in the absence of any commercial or financial relationships that could be construed as a potential conflict of interest.
Figures
References
-
- Andersen M. H., McIlroy S. J., Nierychlo M., Nielsen P. H., Albertsen M. (2018). Genomic insights into Candidatus Amarolinea aalborgensis gen. nov., sp. nov., associated with settleability problems in wastewater treatment plants. Syst. Appl. Microbiol 42 77–84. 10.1016/j.syapm.2018.08.001 - DOI - PubMed
-
- Appels L., Lauwers J., Degrve J., Helsen L., Lievens B., Willems K., et al. (2011). Anaerobic digestion in global bio-energy production: potential and research challenges. Renew. Sustain. Energy Rev. 15 4295–4301. 10.1016/j.rser.2011.07.121 - DOI
LinkOut - more resources
Full Text Sources
Other Literature Sources