. 2021 Jan 20:11:618097.
doi: 10.3389/fmicb.2020.618097. eCollection 2020.

Development of a Fast SARS-CoV-2 IgG ELISA, Based on Receptor-Binding Domain, and Its Comparative Evaluation Using Temporally Segregated Samples From RT-PCR Positive Individuals

Affiliations

Development of a Fast SARS-CoV-2 IgG ELISA, Based on Receptor-Binding Domain, and Its Comparative Evaluation Using Temporally Segregated Samples From RT-PCR Positive Individuals

Farha Mehdi et al. Front Microbiol. .

Abstract

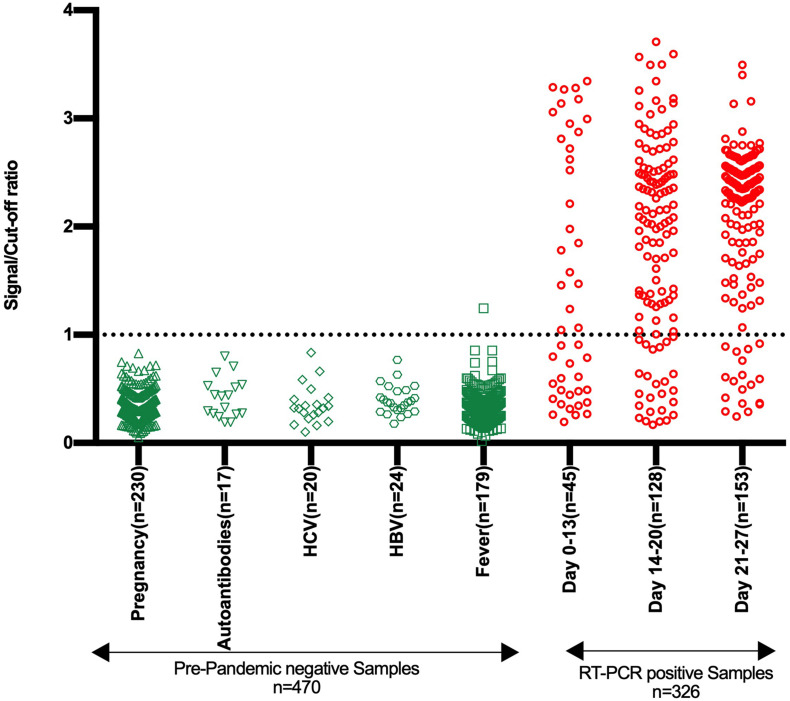
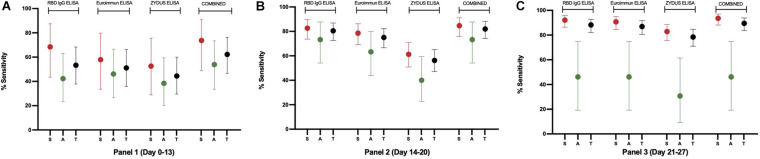
SARS-CoV-2 antibody detection assays are crucial for gathering seroepidemiological information and monitoring the sustainability of antibody response against the virus. The SARS-CoV-2 Spike protein's receptor-binding domain (RBD) is a very specific target for anti-SARS-CoV-2 antibodies detection. Moreover, many neutralizing antibodies are mapped to this domain, linking antibody response to RBD with neutralizing potential. Detection of IgG antibodies, rather than IgM or total antibodies, against RBD is likely to play a larger role in understanding antibody-mediated protection and vaccine response. Here we describe a rapid and stable RBD-based IgG ELISA test obtained through extensive optimization of the assay components and conditions. The test showed a specificity of 99.79% (95% CI: 98.82-99.99%) in a panel of pre-pandemic samples (n = 470) from different groups, i.e., pregnancy, fever, HCV, HBV, and autoantibodies positive. Test sensitivity was evaluated using sera from SARS-CoV-2 RT-PCR positive individuals (n = 312) and found to be 53.33% (95% CI: 37.87-68.34%), 80.47% (95% CI: 72.53-86.94%), and 88.24% (95% CI: 82.05-92.88%) in panel 1 (days 0-13), panel 2 (days 14-20) and panel 3 (days 21-27), respectively. Higher sensitivity was achieved in symptomatic individuals and reached 92.14% (95% CI: 86.38-96.01%) for panel 3. Our test, with a shorter runtime, showed higher sensitivity than parallelly tested commercial ELISAs for SARS-CoV-2-IgG, i.e., Euroimmun and Zydus, even when equivocal results in the commercial ELISAs were considered positive. None of the tests, which are using different antigens, could detect anti-SARS-CoV-2 IgGs in 10.5% RT-PCR positive individuals by the fourth week, suggesting the lack of IgG response.

Keywords: COVID-19; ELISA; RBD; SARS-CoV-2; SARS-CoV-2 IgG antibodies; diagnostics; receptor binding domain.


Conflict of interest statement

The authors declare that the research was conducted in the absence of any commercial or financial relationships that could be construed as a potential conflict of interest.

Figures

FIGURE 1
FIGURE 1
Identification of suitable blocking agent, assay buffer, incubation temperature and time. The scatter plots represent the reactivity of 14 RT-PCR positive and 15 pre-pandemic negative samples with RBD in 16 sets of conditions evaluated. The four blocking agent cum component of assay buffer assessed simultaneously were NFDM (condition 1, 5, 9, 13), BSA-Sigma (condition 2, 6, 10, 14), BSA-MP Biomedicals (condition 3, 7, 11, 15), and Casein (condition 4, 8, 12, 16). The incubation of diluted samples was performed either at 37°C or RT (23 ± 2°C) for 30 or 60 min. Red scatter dots represent the binding profile of positive samples, and green dots represent the binding of negative samples to the coated RBD in each condition. Unpaired T-test was used to compare the geometric mean value of absorbance from the positive and negative sets from each assay condition; ‘a’ represents the geometric mean value of absorbance from positive samples, and ‘b’ represents the geometric mean value of absorbance from negative samples for each set of analyzed condition. Absolute p-values are also reported for each set of conditions.
FIGURE 2
FIGURE 2
Detailed analysis of shortlisted assay conditions to assess the effect of different wash cycles. The Scatter plots represent the reactivity of 35 RT-PCR positive and 53 pre-pandemic negative samples with RBD in 8 sets of conditions. The two blocking agents cum component of assay buffer were assessed simultaneously: NFDM (condition 1–4) and Casein (condition 5–8). All the incubation steps were performed at RT (23 ± 2°C) with sample incubation time of 30 min (condition 1, 2, 5, and 6) or 60 min (condition 3, 4, 7, and 8). The plates were washed 3-times (condition 1, 3, 5, and 7) or 6-times (condition 2, 4, 6, and 8) between the incubation steps. Red and green scatter dots represents the binding profile of positive and negative samples with RBD. Unpaired T-test was used to compare the geometric mean value of absorbance from the positive and negative sets from each assay condition; “a” represents the geometric mean value of absorbance from positive samples and “b” represents the geometric mean value of absorbance from negative samples for each set of condition. p-values reported as (****) were < 0.0001.
FIGURE 3
FIGURE 3
Comparison of NFDM and Casein as a component of blocking and sample diluent. The Scatter plots represent the reactivity of 19 RT-PCR positive and 20 pre-pandemic negative samples with RBD in 4 conditions where NFDM and Casein were evaluated for their effectiveness as a suitable blocker for the RBD coated wells, as sample diluent, and as conjugate diluent. RBD coated wells were blocked with either 3% NFDM (condition 1) or 2% Casein (condition 2–4). Samples were diluted to 1:50 in 1% NFDM (condition 1, 2), 3% NFDM (condition 3) and 1% Casein (condition 4) based sample diluent. The anti-human IgG-HRP conjugate was diluted in either 1% NFDM (condition 1) or 1% Casein (condition 2-4). Unpaired T-test was used to compare the geometric mean value of absorbance from the positive and negative sets from each assay condition; “a” represents the geometric mean value of absorbance from positive samples and “b” represents the geometric mean value of absorbance from negative samples for each set of condition. p-values reported as (****) were < 0.0001. SD, Sample Diluent; CD, Conjugate Diluent.
FIGURE 4
FIGURE 4
Specificity and sensitivity analysis of stabilized RBD IgG ELISA kit. The Scatter plot represents the reactivity of pre-pandemic negative samples (n = 470) and samples from SARS-CoV-2 RT-PCR positive individuals (n = 326) in the developed RBD based SARS-CoV-2 IgG ELISA kit. The negative samples belong to five groups, as depicted. The samples from SARS-CoV-2 RT-PCR positive individuals are divided into three groups based on the duration from symptom onset or RT-PCR testing and comprise both symptomatic and asymptomatic category. The reactivity is shown in terms of the signal/cut-off ratio (Y-axis). Signal/cut-off ratio ≥ 1 is considered positive, and this point is denoted using a dotted line intersecting the Y-axis.
FIGURE 5
FIGURE 5
The sensitivity plot of each assay on samples from RT-PCR confirmed individuals. Percent sensitivity is plotted with 95% CI for Symptomatic (S, red), Asymptomatic (A, green), and Total (T, black) samples derived from 31, 128, and 153 RT-PCR positive individuals in Panel 1, Panel 2, and Panel 3, respectively. For this plot, samples that scored equivocal in Euroimmun and Zydus ELISA were considered positive for the sensitivity analysis. Samples found positive in any of the three ELISAs were included in the combined results.

References

    1. Amanat F., Stadlbauer D., Strohmeier S., Nguyen T. H. O., Chromikova V., Mcmahon M., et al. (2020). A serological assay to detect SARS-CoV-2 seroconversion in humans. Nat. Med. 26 1033–1036. 10.1038/s41591-020-0913-5 - DOI - PMC - PubMed
    1. Burbelo P. D., Riedo F. X., Morishima C., Rawlings S., Smith D., Das S., et al. (2020). Sensitivity in detection of antibodies to nucleocapsid and spike proteins of severe acute respiratory syndrome coronavirus 2 in patients with coronavirus disease 2019. J. Infect. Dis. 222 206–213. 10.1093/infdis/jiaa273 - DOI - PMC - PubMed
    1. Byrt T., Bishop J., Carlin J. B. (1993). Bias, prevalence and kappa. J. Clin. Epidemiol. 46 423–429. 10.1016/0895-4356(93)90018-v - DOI - PubMed
    1. Chen Y., Liu Q., Guo D. (2020). Emerging coronaviruses: Genome structure, replication, and pathogenesis. J. Med. Virol. 92 418–423. 10.1002/jmv.25681 - DOI - PMC - PubMed
    1. Cheng M. P., Papenburg J., Desjardins M., Kanjilal S., Quach C., Libman M., et al. (2020). Diagnostic testing for severe acute respiratory syndrome-related coronavirus-2: a narrative review. Ann. Intern. Med. 172 726–734. 10.7326/m20-1301 - DOI - PMC - PubMed

LinkOut - more resources