. 2021 Jan 20:11:608850.
doi: 10.3389/fpls.2020.608850. eCollection 2020.

Localization and Composition of Fructans in Stem and Rhizome of Agave tequilana Weber var. azul

Affiliations

Localization and Composition of Fructans in Stem and Rhizome of Agave tequilana Weber var. azul

Arely V Pérez-López et al. Front Plant Sci. .

Abstract

Methodology combining mass spectrometry imaging (MSI) with ion mobility separation (IMS) has emerged as a biological imaging technique due to its versatility, sensitivity and label-free approach. This technique has been shown to separate isomeric compounds such as lipids, amino acids, carboxylic acids and carbohydrates. This report describes mass spectrometry imaging in combination with traveling-wave ion mobility separation and matrix-assisted laser desorption/ionization (MALDI). Positive ionization mode was used to locate fructans on tissue printed sections of Agave rhizome and stem tissue and distinguished fructan isoforms. Here we show the location of fructans ranging from DP3 to DP17 to be differentially abundant across the stem tissue and for the first time, experimental collision cross sections of endogenous fructan structures have been collected, revealing at least two isoforms for fructans of DP4, DP5, DP6, DP7, DP8, DP10, and DP11. This demonstrates that complex fructans such as agavins can be located and their isoforms resolved using a combination of MALDI, IMS, and MSI, without the need for extraction or derivatization. Use of this methodology uncovered patterns of fructan localization consistent with functional differences where higher DP fructans are found toward the central section of the stem supporting a role in long term carbohydrate storage whereas lower DP fructans are concentrated in the highly vascularized central core of rhizomes supporting a role in mobilization of carbohydrates from the mother plant to developing offsets. Tissue specific patterns of expression of genes encoding enzymes involved in fructan metabolism are consistent with fructan structures and localization.

Keywords: Agave tequilana; collision cross section; degree of polymerization; fructan; fructan isoform; fructan metabolism; ion mobility separation; mass spectrometry imaging.


Conflict of interest statement

The authors declare that the research was conducted in the absence of any commercial or financial relationships that could be construed as a potential conflict of interest.

Figures

FIGURE 1
FIGURE 1
Periodic Acid-Schiff (PAS) and Lugol staining of agave stem and rhizome tissue. (A) (a-left) Cross section of agave stem tissue, dotted red triangle indicates the area shown in (Ba–c) (a-right). Transverse section of rhizome tissue from (Be,f) were obtained. (Ab) Example of rhizomes attached to stem tissue, dotted red line indicates a transverse section. (Ba) Unstained, (b) lugol stained (indicated by arrows), and (c) PAS stained triangular slices of transverse sections of stem tissue (d) Higher magnification of PAS stained stem tissue [blue square in (c), showing vascular tissue (vb), vacuole (v), and apoplast (ap)]. (e) Periodic Acid-Schiff (PAS) stained triangular slices of transverse sections of rhizome indicating vascular tissue (vb), (f) Higher magnification of rhizome tissue corresponding to non-vascular tissue indicated by * in (Be), arrows in (Bf) indicate strongly PAS stained bodies.
FIGURE 2
FIGURE 2
Fructan distribution in A. tequilana stem and rhizome tissue determined by MALDI-MSI on tissue printed nylon membrane. (A) Stem sections as shown in Figure 1Aa, sample sprayed matrix and analyzed in SYNAPT G2 spectrometer. Detection of disaccharide and fructooligosaccharides from DP3 to DP9 is indicated. (B) Rhizome sections as shown in Figure 1Ab, sublimated matrix and run in AB equipment. Dotted circles indicate the periphery of the sections. Detection of disaccharide and fructooligosaccharides from DP3 to DP8 is indicated. Both adducts [M+Na]+ and [M+K]+ were merged for each disaccharide to fructan DP9 while abundance is shown as a change in color intensity. Scale bar is 5 mm.
FIGURE 3
FIGURE 3
MS spectra of fructans from A. tequilana stem sections. (A) Examples of transverse and longitudinal sections of A. tequilana stem tissue. Colors indicate different dissections of the stem from which fructans were extracted. (B) Positive ionization mass spectra of fructans of spotted extracts from A. tequilana stem in relation to the dissected areas shown in (A). Similar spectra were generated for a total of four individual plants, the image shown is representative of the data obtained.
FIGURE 4
FIGURE 4
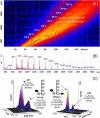
Structural diversity of fructans in A. tequilana stem (3 years old plants), using Mass Spectrometry Imaging and Ion Mobility Mass Spectrometry. (A) Mobilogram plotted in DriftScope 2.8 (Waters Corporation, Milford, MA, United States), red dots are ions with a specific x: drift time [ms], and y: m/z ratio (B) MALDI mass spectrum, in red fructan ions of plot A with their relative abundances. (C) 3D Plot mobilogram of observed isoforms and predicted isoform structures (x: drift time [ms], y: signal intensity [counts], z: m/z ratio, a zoom into DP7 [M+Na]+ and DP8 [M+K]+, where experimental CCS values (Ωe) of fructans, m/z and dt data were obtained with a SYNAPT G1 using poly-(D/L)-alanine as calibrant, and N2 as drift gas. Cartoon structures are drawn based in theoretical CCS values (Ωth) calculated for energy minimized isoforms.
FIGURE 5
FIGURE 5
Putative predicted structures of fructans identified in A. tequilana stem. Cartoon structures are drawn based in theoretical CCS values (Ωth) calculated for energy minimized isoforms. Where G refers to glucose, i inulin and L levan type fructan.
FIGURE 6
FIGURE 6
RT-PCR Expression analysis of genes involved in fructan metabolism. (A) Atq1-SST2: sucrose-sucrose 1 fructosyl transferase isoform 2, (B) AtqFEH4: fructosyl exo-hydrolases isoform 4, (C,D) Atq6G-FFT1/2: fructan-fructan 6G fructosyltransferases isoforms 1 and 2. Rhizome tissue is indicated and all other tissues correspond to stem dissections indicated in Figure 3A.

References

    1. Acosta-Domínguez L., Alamilla-Beltrán L., Calderón-Domínguez G., Jiménez-Aparicio A. R., Gutiérrez-López G. F., Azuara-Nieto E. (2018). Determination Of Total And Incipient Solubilization Point Of Fructans Extracted Of A. tequilana Weber var. azul. Rev. Mexic. Ingen. Quím. 17 379–388. 10.24275/uam/izt/dcbi/revmexingquim/2018v17n1/acosta - DOI
    1. Antonio C., Larson T., Gilday A., Graham I., Bergström E., Thomas-Oates J. (2008). Hydrophilic interaction chromatography/electrospray mass spectrometry analysis of carbohydrate-related metabolites from Arabidopsis thaliana leaf tissue. Rap. Commun. Mass Spectr. RCM 22 1399–1407. 10.1002/rcm.3519 - DOI - PubMed
    1. Arrizon J., Morel S., Gschaedler A., Monsan P. (2010). Comparison of the water-soluble carbohydrate composition and fructan structures of Agave tequilana plants of different ages. Food Chem. 122 123–130. 10.1016/j.foodchem.2010.02.028 - DOI
    1. Avila de Dios E., Vargas A. D. G., Santos M. L. D., Simpson J. (2015). New insights into plant glycoside hydrolase family 32 in Agave species. Front. Plant Sci. 6:594. 10.3389/fpls.2015.00594 - DOI - PMC - PubMed
    1. Bhatia I. S., Nandra K. S. (1979). Studies on fructosyl transferase from Agave americana. Phytochemistry 18 923–927. 10.1016/s0031-9422(00)91450-x - DOI

LinkOut - more resources