

The Price of the Induced Defense Against Pests: A Meta-Analysis
- PMID: 33552106
- PMCID: PMC7859116
- DOI: 10.3389/fpls.2020.615122
The Price of the Induced Defense Against Pests: A Meta-Analysis
Abstract
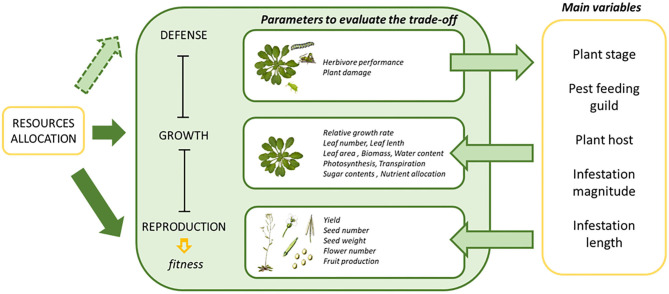
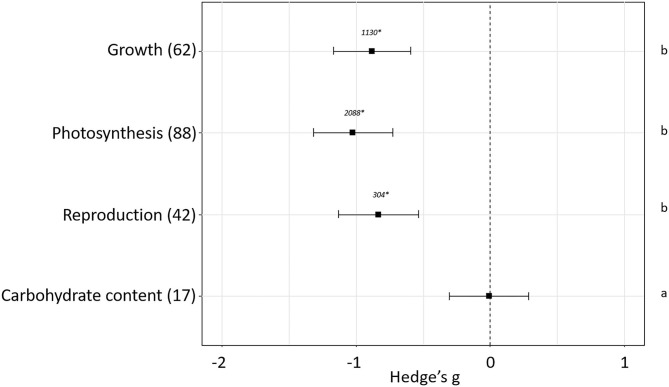
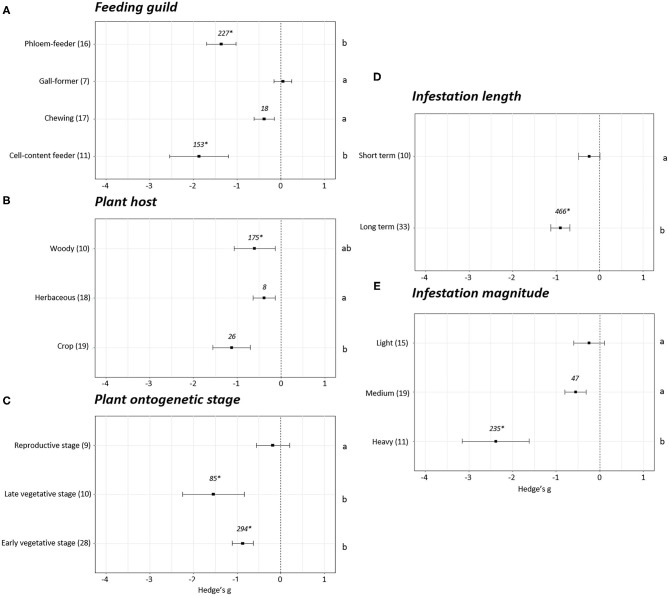
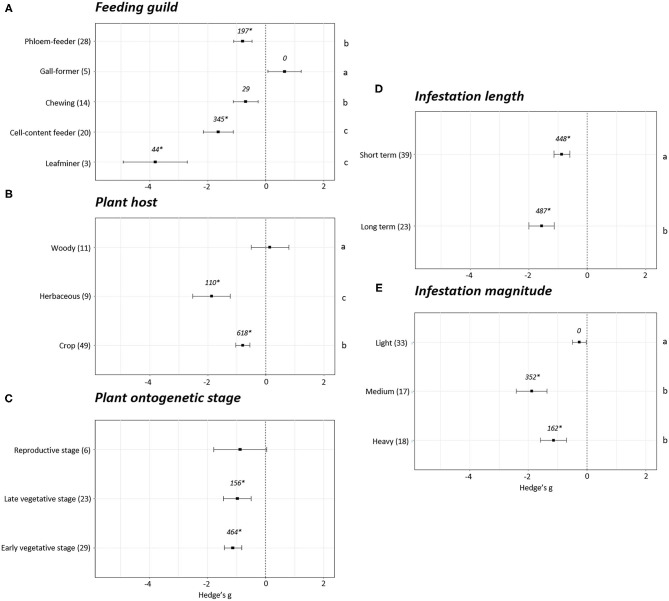
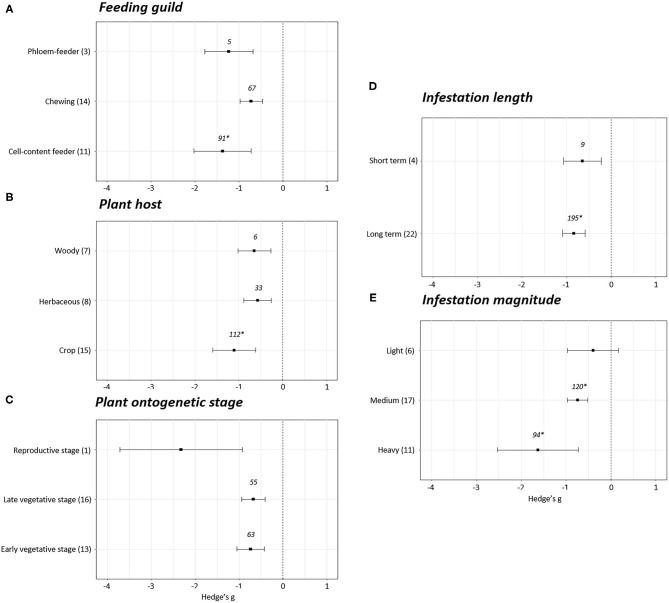
Plants and phytophagous arthropods have co-evolved for millions of years. During this long coexistence, plants have developed defense mechanisms including constitutive and inducible defenses. In an effort to survive upon herbivore attack, plants suffer a resource reallocation to facilitate the prioritization of defense toward growth. These rearrangements usually end up with a penalty in plant growth, development or reproduction directly linked to crop losses. Achieving the balance to maximize crop yield requires a fine tune regulation specific for each host-arthropod combination, which remains to be fully elucidated. The purpose of this work is to evaluate the effects of induced plant defenses produced upon pest feeding on plant fitness and surrogate parameters. The majority of the studies are focused on specific plant-pest interactions based on artificial herbivory damage or simulated defoliation on specific plant hosts. In this meta-analysis, the relevance of the variables mediating plant-pest interactions has been studied. The importance of plant and pest species, the infestation conditions (plant age, length/magnitude of infestation) and the parameters measured to estimate fitness (carbohydrate content, growth, photosynthesis and reproduction) in the final cost have been analyzed through a meta-analysis of 209 effects sizes from 46 different studies. Herbivore infestation reduced growth, photosynthesis and reproduction but not carbohydrate content. When focusing on the analyses of the variables modulating plant-pest interactions, new conclusions arise. Differences on the effect on plant growth and photosynthesis were observed among different feeding guilds or plant hosts, suggesting that these variables are key players in the final effects. Regarding the ontogenetic stage of a plant, negative effects were reported only in infestations during the vegetative stage of the plant, while no effect was observed during the reproductive stage. In addition, a direct relation was found between the durability and magnitude of the infestation, and the final negative effect on plant fitness. Among the parameters used to estimate the cost, growth and photosynthesis revealed more differences among subgroups than reproduction parameters. Altogether, this information on defense-growth trade-offs should be of great help for the scientific community to design pest management strategies reducing costs.
Keywords: fitness; growth; induced defenses; photosynthesis; phytophagous; plant; reproduction; trade-off.
Copyright © 2021 Garcia, Martinez, Diaz and Santamaria.
Conflict of interest statement
The authors declare that the research was conducted in the absence of any commercial or financial relationships that could be construed as a potential conflict of interest.
Figures
Similar articles
-
Plant ontogeny determines strength and associated plant fitness consequences of plant-mediated interactions between herbivores and flower visitors.J Ecol. 2020 May;108(3):1046-1060. doi: 10.1111/1365-2745.13370. Epub 2020 Apr 4. J Ecol. 2020. PMID: 32421019 Free PMC article.
-
MAPK-dependent JA and SA signalling in Nicotiana attenuata affects plant growth and fitness during competition with conspecifics.BMC Plant Biol. 2012 Nov 13;12:213. doi: 10.1186/1471-2229-12-213. BMC Plant Biol. 2012. PMID: 23148462 Free PMC article.
-
Plant Defense against Herbivorous Pests: Exploiting Resistance and Tolerance Traits for Sustainable Crop Protection.Front Plant Sci. 2016 Jul 29;7:1132. doi: 10.3389/fpls.2016.01132. eCollection 2016. Front Plant Sci. 2016. PMID: 27524994 Free PMC article. Review.
-
Contrasting plant transcriptome responses between a pierce-sucking and a chewing herbivore go beyond the infestation site.BMC Plant Biol. 2024 Feb 19;24(1):120. doi: 10.1186/s12870-024-04806-1. BMC Plant Biol. 2024. PMID: 38369495 Free PMC article.
-
Plant-Herbivore Interactions: A Case of an Extreme Generalist, the Two-Spotted Spider Mite Tetranychus urticae.Mol Plant Microbe Interact. 2017 Dec;30(12):935-945. doi: 10.1094/MPMI-07-17-0168-CR. Epub 2017 Oct 23. Mol Plant Microbe Interact. 2017. PMID: 28857675 Review.
Cited by
-
Testing intra-species variation in allocation to growth and defense in rubber tree (Hevea brasiliensis).PeerJ. 2024 Aug 8;12:e17877. doi: 10.7717/peerj.17877. eCollection 2024. PeerJ. 2024. PMID: 39131614 Free PMC article.
-
Bringing Fundamental Insights of Induced Resistance to Agricultural Management of Herbivore Pests.J Chem Ecol. 2023 Jun;49(5-6):218-229. doi: 10.1007/s10886-023-01432-3. Epub 2023 May 4. J Chem Ecol. 2023. PMID: 37138167 Free PMC article. Review.
-
Fine-tuning plant valuable secondary metabolite biosynthesis via small RNA manipulation: strategies and potential.Planta. 2024 Sep 10;260(4):89. doi: 10.1007/s00425-024-04521-z. Planta. 2024. PMID: 39254898 Review.
-
The Laccase Gene Family Mediate Multi-Perspective Trade-Offs during Tea Plant (Camellia sinensis) Development and Defense Processes.Int J Mol Sci. 2021 Nov 21;22(22):12554. doi: 10.3390/ijms222212554. Int J Mol Sci. 2021. PMID: 34830436 Free PMC article.
-
A comprehensive meta-analysis reveals the key variables and scope of seed defense priming.Front Plant Sci. 2023 Jul 20;14:1208449. doi: 10.3389/fpls.2023.1208449. eCollection 2023. Front Plant Sci. 2023. PMID: 37546267 Free PMC article.
References
-
- Bardner R. (1968). Wheat bulb fly, Leptohylemyia coarctata Fall., and its effect on the growth and yield of wheat. Ann. Appl. Biol. 61, 1–11. 10.1111/j.1744-7348.1968.tb04504.x - DOI
-
- Bazzaz F. A., Hiariello N. C. R., Coley P. D., Pitelka L. F. (1987). Allocating resources to reproduction and defense. Bioscience 37, 58–67. 10.2307/1310178 - DOI
Publication types
LinkOut - more resources
Full Text Sources
Other Literature Sources