

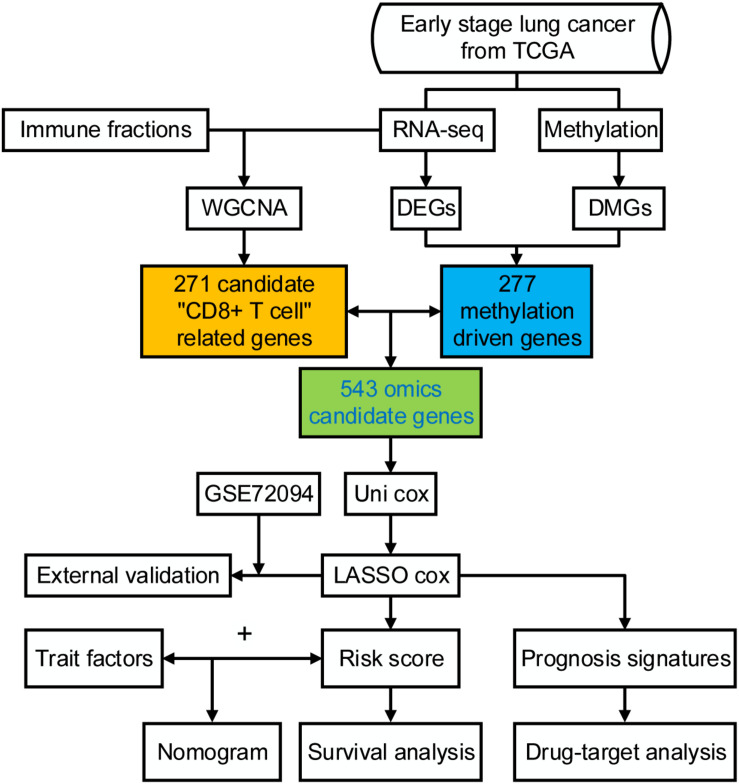
A Novel Prognostic Model of Early-Stage Lung Adenocarcinoma Integrating Methylation and Immune Biomarkers
- PMID: 33552145
- PMCID: PMC7859522
- DOI: 10.3389/fgene.2020.634634
A Novel Prognostic Model of Early-Stage Lung Adenocarcinoma Integrating Methylation and Immune Biomarkers
Abstract
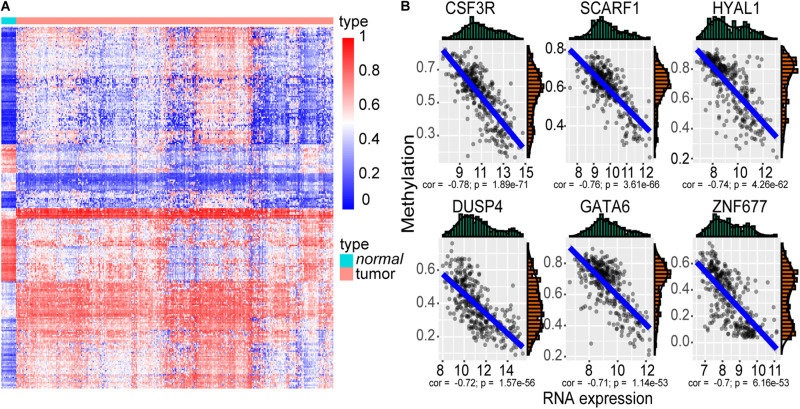
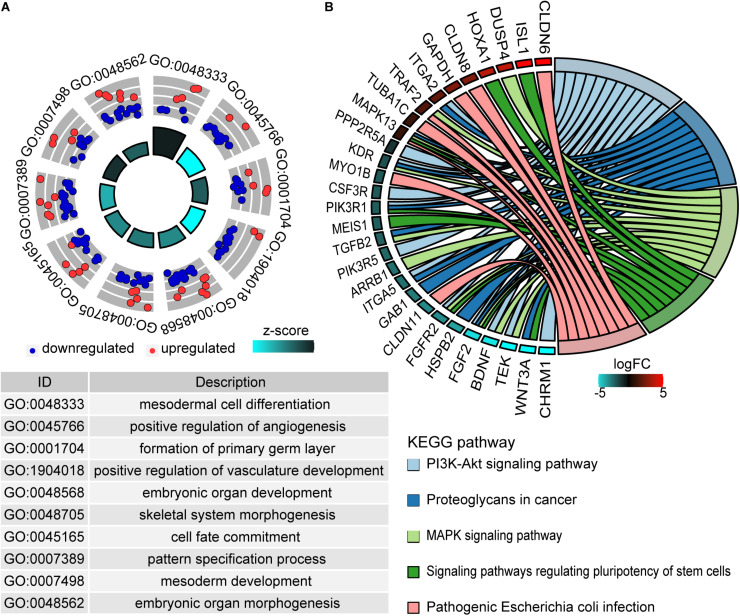
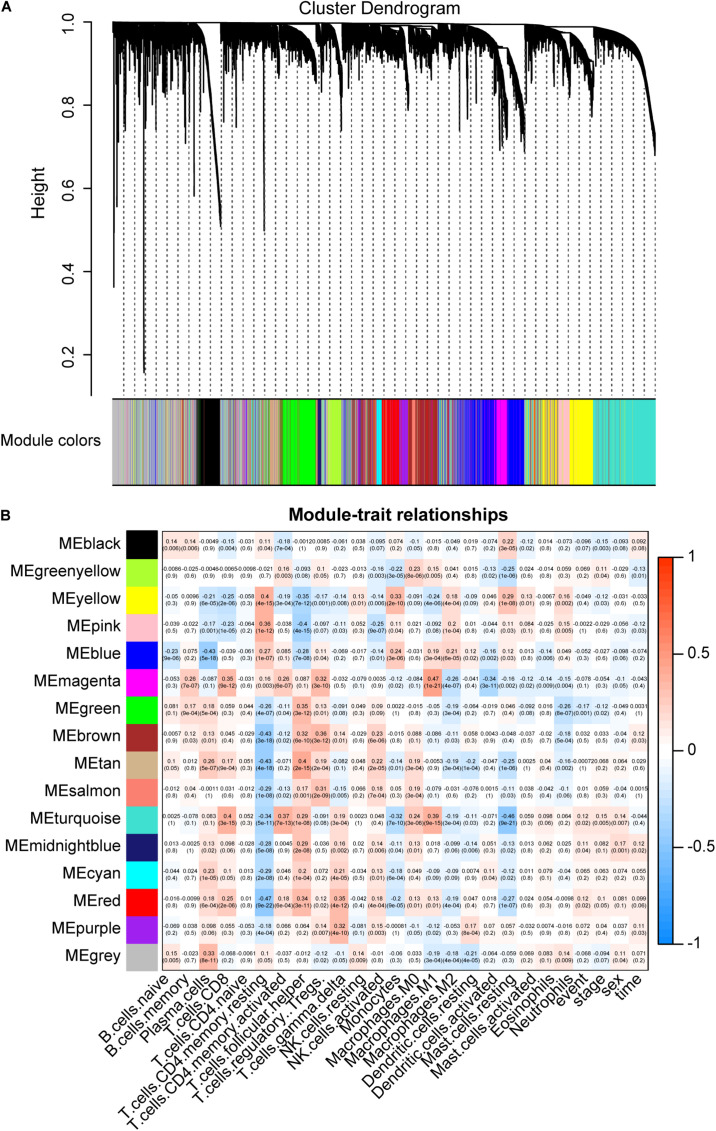
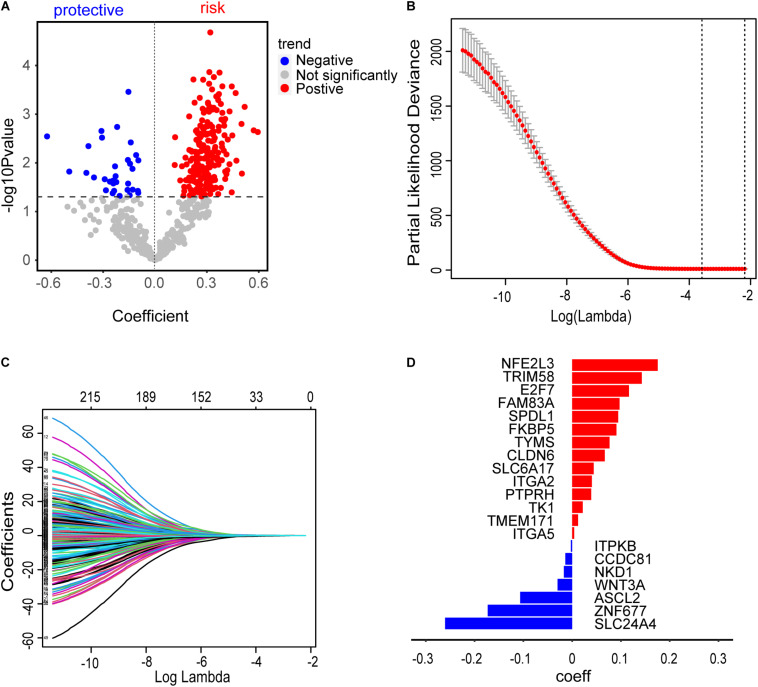
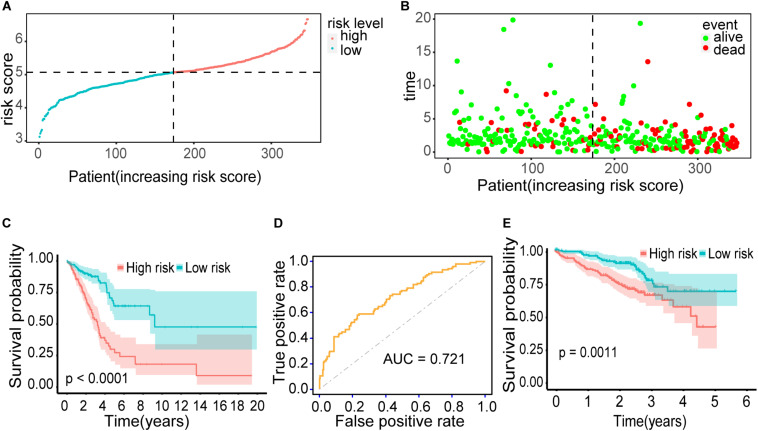
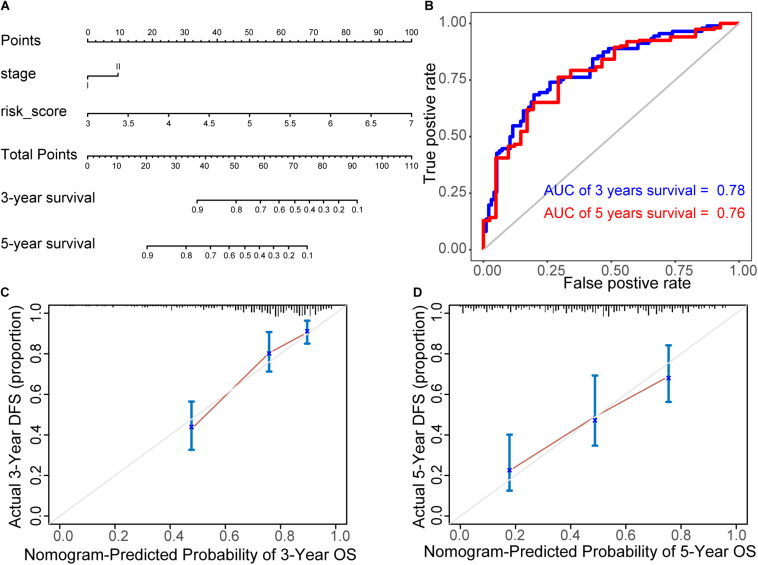
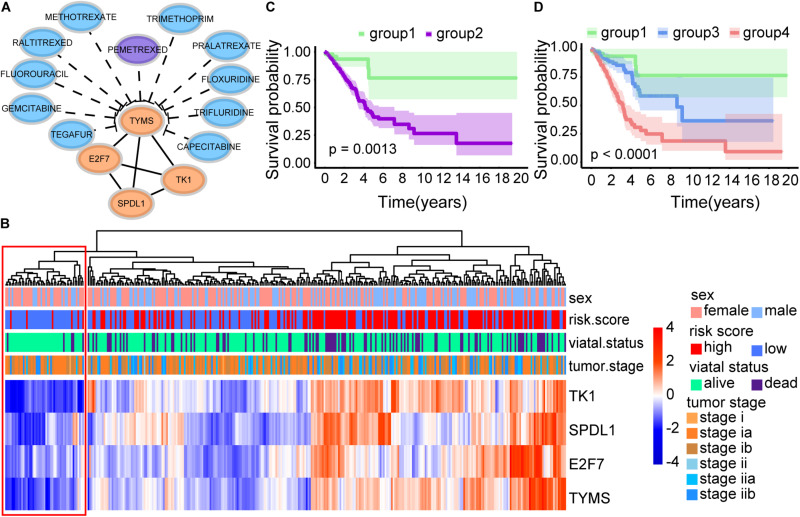
Lung adenocarcinoma (LUAD) is caused by multiple biological factors. Therefore, it will be more meaningful to study the prognosis from the perspective of omics integration. Given the significance of epigenetic modification and immunity in tumorigenesis and development, we tried to combine aberrant methylation and tumor infiltration CD8 T cell-related genes to build a prognostic model, to explore the key biomarkers of early-stage LUAD. On the basis of RNA-seq and methylation microarray data downloaded from The Cancer Genome Atlas (TCGA), differentially expressed genes and aberrant methylated genes were calculated with "DEseq2" and "ChAMP" packages, respectively. A Chi-square test was performed to obtain methylation driver genes. Weighted correlation network analysis (WGCNA) was utilized to mine cancer biomarkers related to CD8 T cells. With the consequences of univariate Cox proportional hazards analysis and least absolute shrinkage and selection operator (LASSO) COX regression analysis, the prognostic index based on 17 methylation driver genes (ZNF677, FAM83A, TRIM58, CLDN6, NKD1, NFE2L3, FKBP5, ITGA5, ASCL2, SLC24A4, WNT3A, TMEM171, PTPRH, ITPKB, ITGA2, SLC6A17, and CCDC81) and four CD8 T cell-related genes (SPDL1, E2F7, TK1, and TYMS) was successfully established, which could make valuable predictions for the survival risk of patients with early-stage LUAD.
Keywords: CD8 T cell; lung adenocarcinoma; methylation; prognostic model; survival analysis.
Copyright © 2021 Ren, Yang, Li, Xie, Hu, Qin and Zhang.
Conflict of interest statement
The authors declare that the research was conducted in the absence of any commercial or financial relationships that could be construed as a potential conflict of interest.
Figures
References
-
- Azimi F., Scolyer R. A., Rumcheva P., Moncrieff M., Murali R., McCarthy S. W., et al. (2012). Tumor-infiltrating lymphocyte grade is an independent predictor of sentinel lymph node status and survival in patients with cutaneous melanoma. J. Clin. Oncol. 30 2678–2683. 10.1200/jco.2011.37.8539 - DOI - PubMed
-
- Blanche P., Dartigues J. F., Jacqmin-Gadda H. (2013). Estimating and comparing time-dependent areas under receiver operating characteristic curves for censored event times with competing risks. Stat. Med. 32 5381–5397. - PubMed
LinkOut - more resources
Full Text Sources
Other Literature Sources
Research Materials
Miscellaneous