. 2021;57(4):741-756.
doi: 10.1007/s13143-021-00232-7. Epub 2021 Feb 1.

Pandemic induced lockdown as a boon to the Environment: trends in air pollution concentration across India

Affiliations

Pandemic induced lockdown as a boon to the Environment: trends in air pollution concentration across India

Alok Sagar Gautam et al. Asia Pac J Atmos Sci. 2021.

Abstract

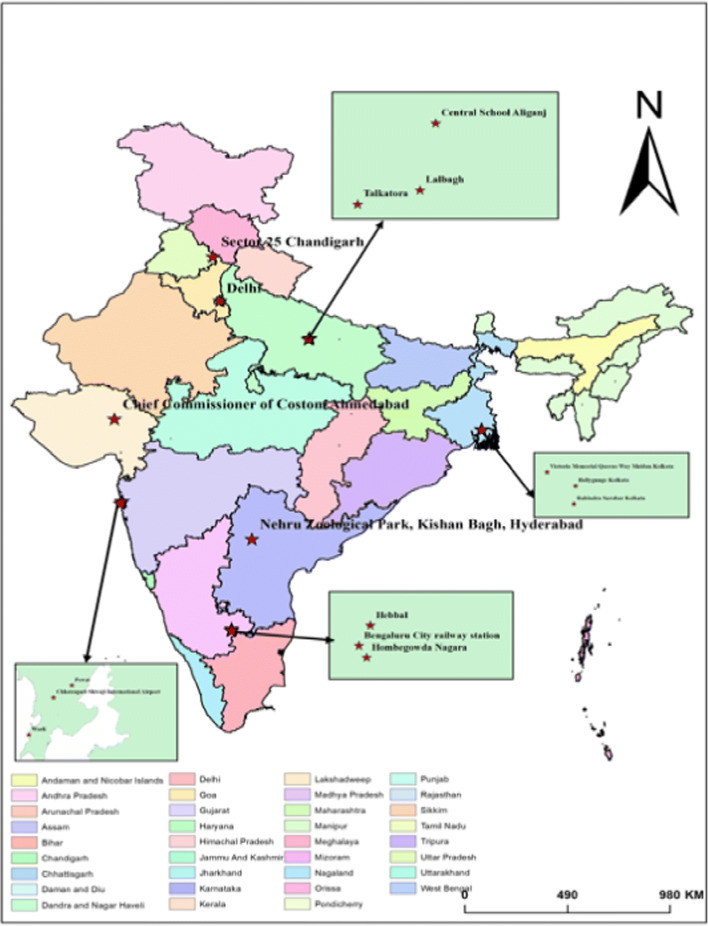
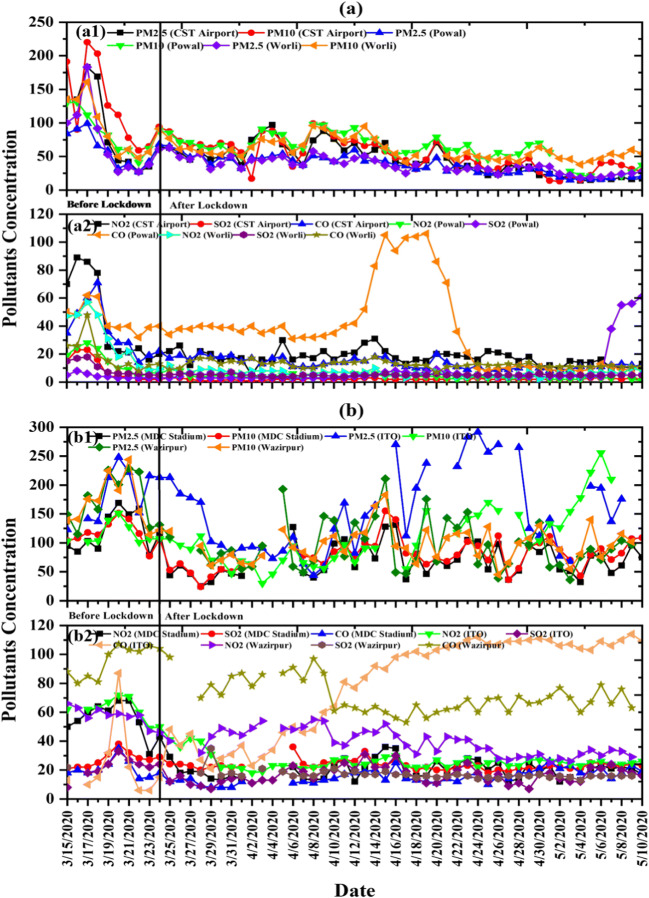
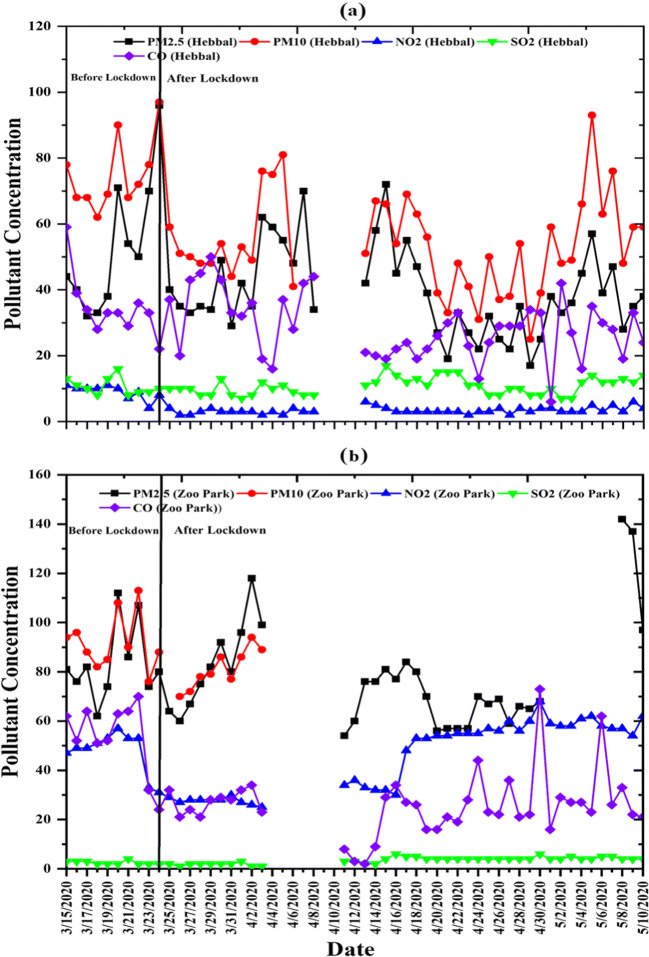
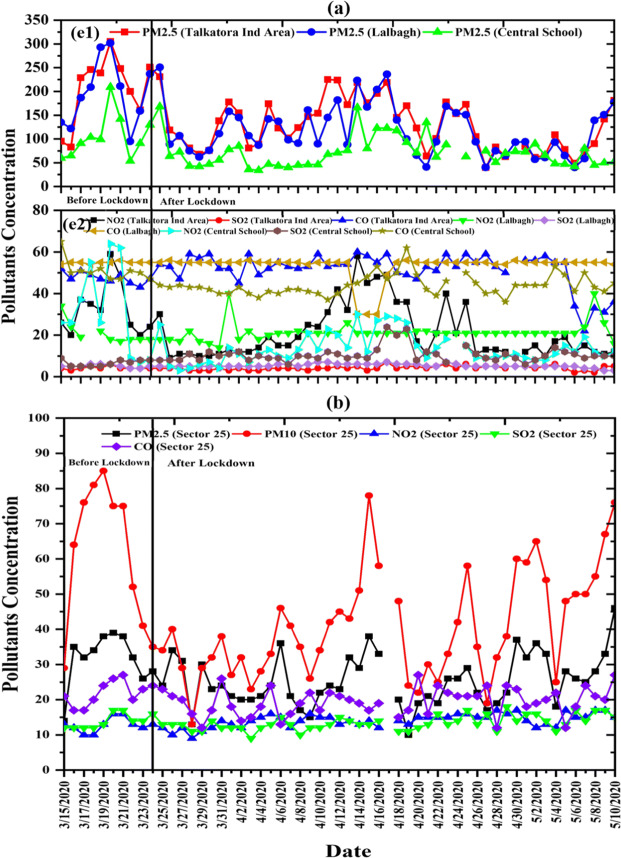
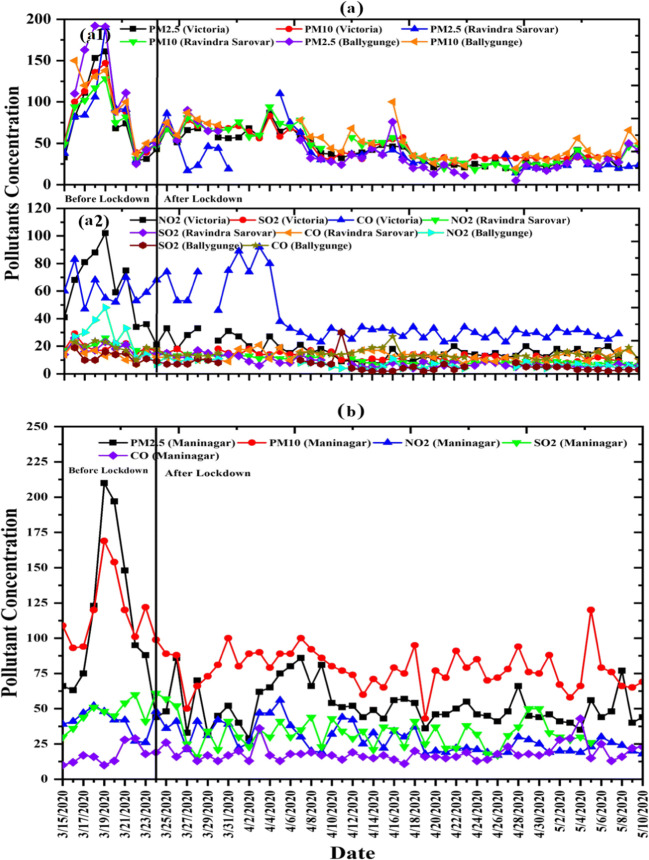
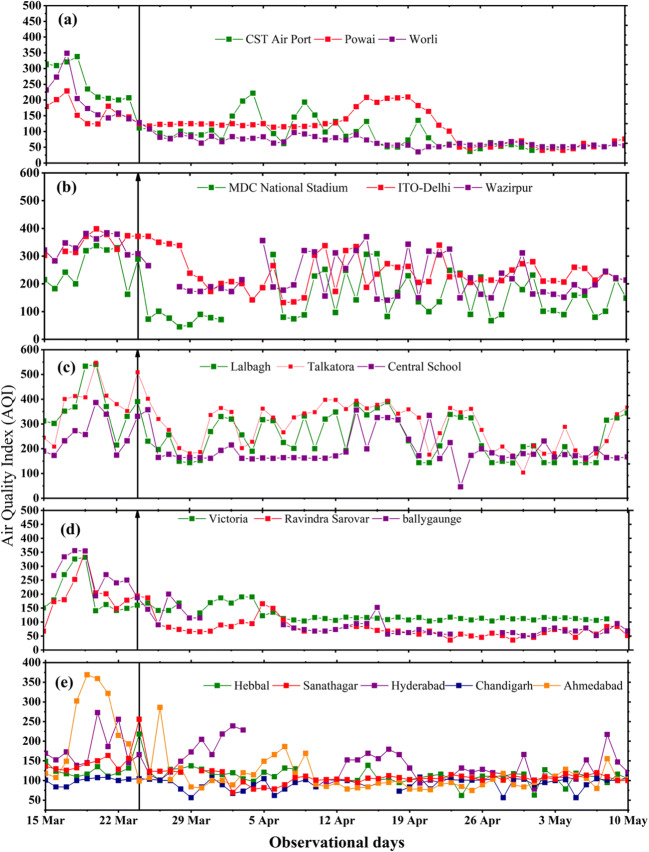
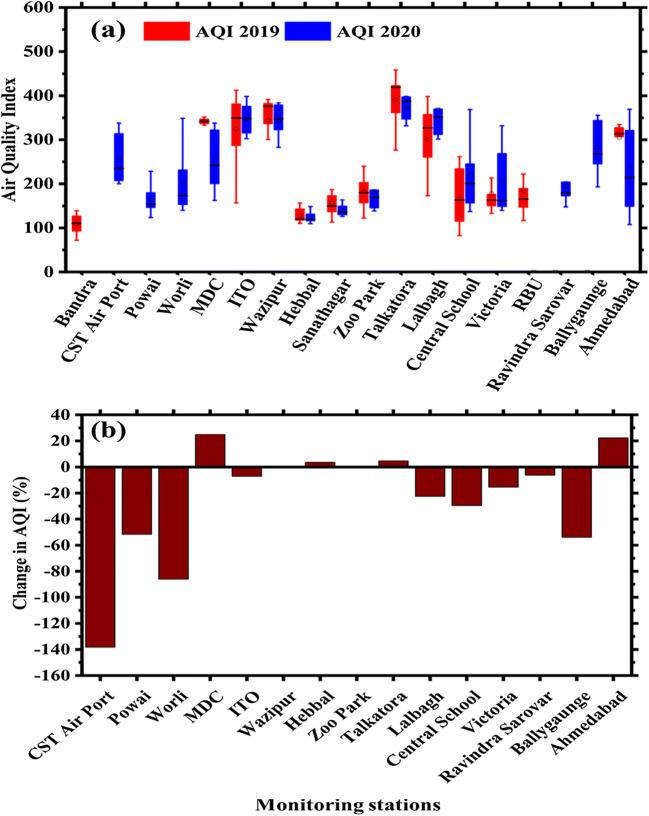
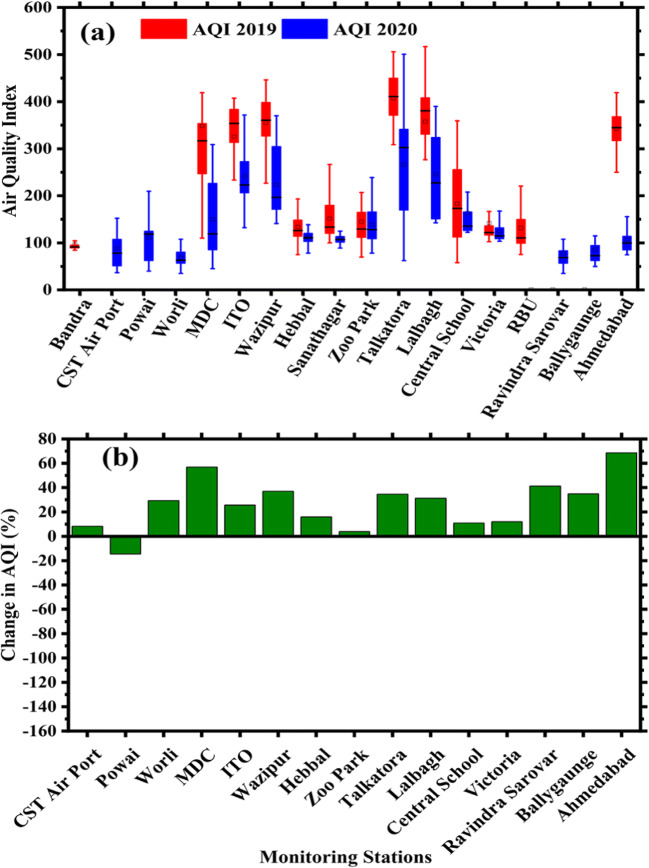
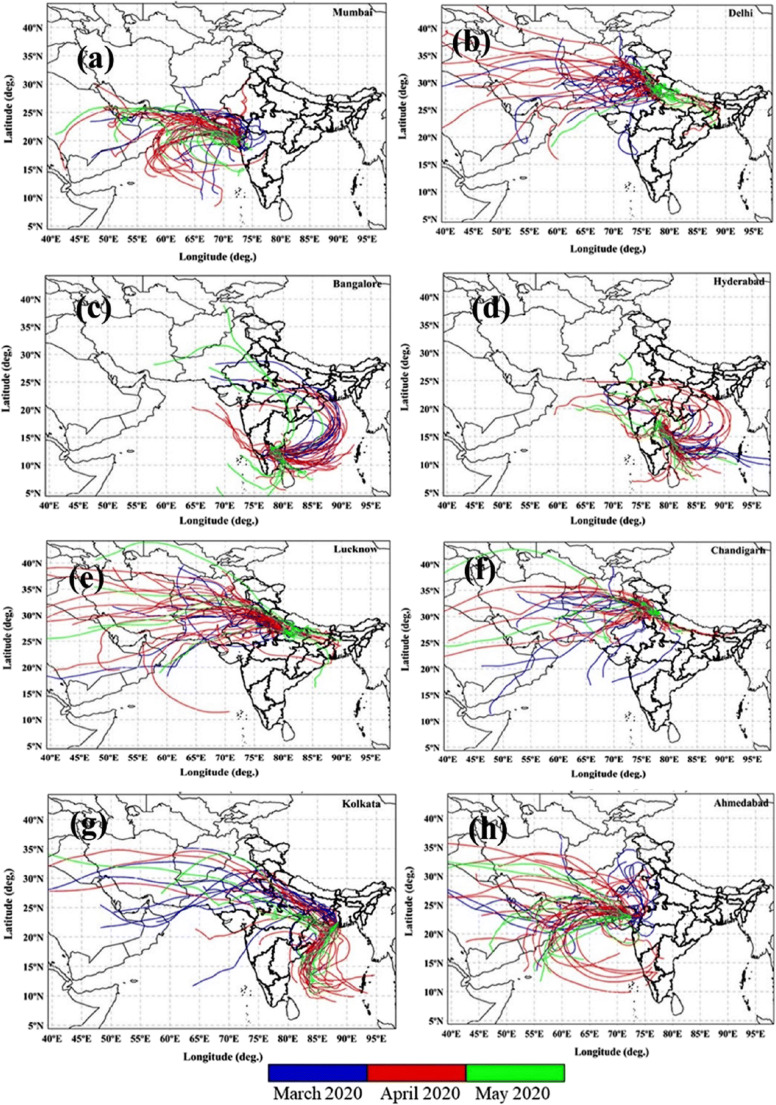
The present paper designed to understand the variations in the atmospheric pollutants viz. PM10, PM2.5, SO2, NO2, and CO during the COVID-19 pandemic over eight most polluted Indian cities (Mumbai, Delhi, Bangalore, Hyderabad, Lucknow, Chandigarh, Kolkata, and Ahmedabad). A significant reduction in the PM2.5 (63%), PM10 (56%), NO2 (50%), SO2 (9%), and CO (59%) were observed over Major Dhyan Chand Stadium. At Chhatrapati Shivaji International Airport, a decline of 44% in PM2.5 and 50% in PM10 was seen just a week during the initial phase of the lockdown. Gaseous pollutants (NO2, SO2 & CO) dropped up-to 36, 16, and 41%, respectively. The Air Quality Index (AQI) shows a dramatic change from 7% to 67% during observation at Chandigarh and Ballygunge during the inspection. Whereas, Ahmedabad, Worli, Income Tax Office, Talkatora, Lalbagh, and Ballygaunge have showed a significant change in AQI from 25.76% to 68.55%. However, Zoo Park, CST, Central School, and Victoria show relatively low variation in AQI in the range of 3.0% to 14.50% as compare to 2019 after lockdown. Hybrid Single-Particle Lagrangian Integrated Trajectory (HYSPLIT) analysis suggested that long range transportation of pollutants were also a part and parcel contributing to changes in AQI which were majorly coming from the regions of Iran, Afghanistan, Saudi Arabia, as well as a regional grant from Indian Gangatic plains and Delhi Non-capital region.

Keywords: Air quality index; Back trajectories; COVID-19; Coronavirus; India.


Conflict of interest statement

Declaration of competing interestAll authors declare that they have no known competing financial interests or personal relationships that can affect the reported work in the presented manuscript.

Figures

Fig. 1
Fig. 1
Location of observational sites across India
Fig. 2
Fig. 2
Daily variation of atmospheric pollutant over (a) Mumbai (a1; PM10, & PM 2.5, and a2; NO2, SO2 & CO) and (b) Delhi (b1; PM10, & PM 2.5, and b2; NO2, SO2 & CO) during 15 March 2020 to 10 April 2020. A dark black line is used to distinguish the before (before 24 March 2020) and after (after 24 March 2020) lockdown period
Fig. 3
Fig. 3
Daily variation of atmospheric pollutant over (a) Bangalore and (b) Hyderabad during 15 March 2020 to 10 April 2020. A dark black line is used to distinguish the before (before 24 March 2020) and after (after 24 March 2020) lockdown period
Fig. 4
Fig. 4
Daily variation of atmospheric pollutant over (a) Lucknow (a1; PM10, & PM 2.5, and a2; NO2, SO2 & CO) and (b) Chandigarh during 15 March 2020 to 10 April 2020. A dark black line is used to distinguish the before (before 24 March 2020) and after (after 24 March 2020) lockdown period
Fig. 5
Fig. 5
Daily variation of pollution parameters (a) Kolkata (a1; PM10, PM 2.5 & a2: NO2, SO2 & CO) and (b) Ahmedabad during 15 March 2020 to 10 April 2020. A dark black line is used to distinguish the before (before 24 March 2020) and after (after 24 March 2020) lockdown period
Fig. 6
Fig. 6
Daily variation Air Quality Index for (a) Mumbai, (b) Delhi, (c) Lucknow, (d) Kolkata, and (e) Bangalore, Sanathagar, Hyderabad, Chandigarh & Ahmedabad before lockdown (before 24 March 2020) and after lockdown (after 24 March 2020 to 10 May 2020)
Fig. 7
Fig. 7
Before-lockdown (10 March 2020 to 24 March 2020) period (a) variation of Air Quality Index during (AQI) during 2019 & 2020 over monitoring stations and (b) the percentage change in AQI
Fig. 8
Fig. 8
After lockdown (25 March 2020 to 10 May 2020) period (a) variation of Air Quality Index during (AQI) during 2019 & 2020 over monitoring stations and (b) the percentage change in AQI year 2019
Fig. 9
Fig. 9
Air Back Mass trajectory over (a) Mumbai, (b) Delhi, (c) Bangalore, (d) Hyderabad, (e) Lucknow, (f) Chandigarh, (g) Kolkata and (h) Ahmedabad at 500 m during 15 March 2020 to 10 May 2020

References

    1. Akolkar, A.M.S.B.: National air quality index. Cent. Pollut. Control Board. 1–44 (2016)
    1. Azuma K, Kagi N, Kim H, Hayashi M. Impact of climate and ambient air pollution on the epidemic growth during COVID-19 outbreak in Japan. Environ. Res. 2020;190:110042. doi: 10.1016/j.envres.2020.110042. - DOI - PMC - PubMed
    1. Bao R, Zhang A. Does lockdown reduce air pollution ? Evidence from 44 cities in northern China. Sci. Total Environ. 2020;731:139052. doi: 10.1016/j.scitotenv.2020.139052. - DOI - PMC - PubMed
    1. Berman JD, Ebisu K. Changes in U.S. air pollution during the COVID-19 pandemic. Sci. Total Environ. 2020;739:139864. doi: 10.1016/j.scitotenv.2020.139864. - DOI - PMC - PubMed
    1. Chauhan A, Singh RP. Decline in PM 2 . 5 concentrations over major cities around the world associated with COVID-19. Environ. Res. 2020;187:109634. doi: 10.1016/j.envres.2020.109634. - DOI - PMC - PubMed

LinkOut - more resources