. 2020 Dec 20;8(3):2001802.
doi: 10.1002/advs.202001802. eCollection 2021 Feb.

Fast Permeation of Small Ions in Carbon Nanotubes

Affiliations

Fast Permeation of Small Ions in Carbon Nanotubes

Steven F Buchsbaum et al. Adv Sci (Weinh). .

Abstract

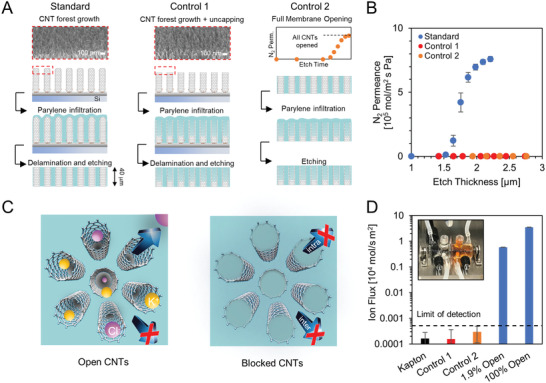
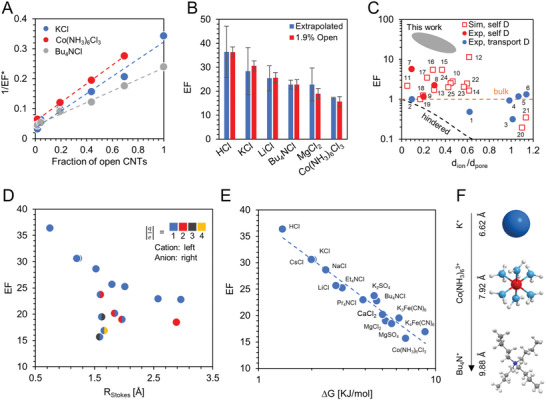
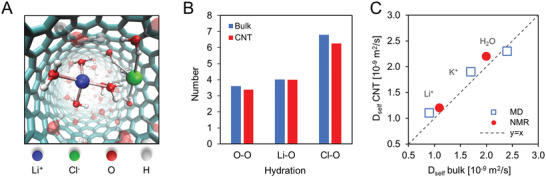
Simulations and experiments have revealed enormous transport rates through carbon nanotube (CNT) channels when a pressure gradient drives fluid flow, but comparatively little attention has been given to concentration-driven transport despite its importance in many fields. Here, membranes are fabricated with a known number of single-walled CNTs as fluid transport pathways to precisely quantify the diffusive flow through CNTs. Contrary to early experimental studies that assumed bulk or hindered diffusion, measurements in this work indicate that the permeability of small ions through single-walled CNT channels is more than an order of magnitude higher than through the bulk. This flow enhancement scales with the ion free energy of transfer from bulk solutions to a nanoconfined, lower-dielectric environment. Reported results suggest that CNT membranes can unlock dialysis processes with unprecedented efficiency.

Keywords: anomalous transport; carbon nanotubes; fast ion permeation; flow enhancement; nanofluidics.


Conflict of interest statement

The authors declare no conflict of interest.

Figures

Figure 1
Figure 1
Absence of leakage pathways in fully opened CNT membranes. A) Fabrication steps for a standard membrane (left column), C1 (middle), and C2 (right) controls. Scanning electron microscopy images show the forest top layer following growth (left) and plus a 5 min air plasma etch (middle). The graph in the right column shows a representative opening curve for the membranes used in C2 control fabrication. B) Nitrogen permeance plotted as a function of etching time for a standard membrane (blue) and controls (C1 red and C2 orange). Error bars represent the standard deviation for three membranes. C) Schematic representation of the standard (left) and control (right) membranes with open and blocked CNTs, respectively. D) KCl flux measured under a 50 mm concentration gradient at 25 °C through control membranes (orange and red), a solid piece of Kapton polyimide (black), and standard CNT membranes with 1.9% and 100% of the CNTs opened (blue). The limit of detection is defined as the flux through the polyimide plus 3 × the standard error (dashed line). Error bars represent the standard error from the linear fit of permeate conductivity versus time. Inset: Schematic of the diffusion set up (Figure S4, Supporting Information).
Figure 2
Figure 2
Fast ion diffusion through CNTs. A) 1/EF* versus the percentage of open CNTs for KCl (blue), Bu4NCl (grey), and Co(NH3)6Cl3 (red). Dashed lines represent a linear fit with Equation (1). Error bars are calculated from the standard deviation of the maximum N2 permeance for the three fully opened membranes (x direction) and from three repeated diffusion experiments with the same membrane (y direction) and are smaller than the data points. B) Comparison of EF obtained by extrapolation from the entire dataset of membranes with varying degree of opening (blue) and from a single 1.9% open membrane (red). Error bars come from the quality of the linear fit to 1/EF* versus percentage of CNTs open (extrapolated dataset, dashed line in panel A) and from three repeated experiments using the same membrane (1.9% open dataset). C) Partial summary of published literature indicating that ion diffusion may be enhanced under graphitic nanoconfinement (CNTs, graphene slits, or pores in activated carbon; see Table S2, Supporting Information). Hydrated ion size is used for data collected in aqueous environments, and d pore is taken as the smallest nanochannel dimension. Red squares and circles are self‐diffusion data from simulations and experiments, respectively; blue circles are transport diffusion from experiments which assumed K H2O − mem equal to 1; orange dashed line is bulk diffusion; black dashed line is predictions from hindered diffusion model; gray oval shows results from this work. D) EF plotted versus the Stokes radius for the salt, R Stokes =  (r cat ν cat + r an ν an)/(ν cat + ν an). Coloring of the left and right datapoint halves represent the absolute value of the anion and cation charge number z, respectively (blue = 1, red = 2, dark gray = 3, orange = 4). E) EF plotted as a function of the energy penalty calculated for a charged hard sphere moving from bulk water to water confined in a CNT (Equations (2) and (3)). In (D) and (E) all data points are taken from a single 1.9% open membrane for which R BL is negligible. F) Molecular model of three cations tested with their corresponding hydrated diameter and charge.
Figure 3
Figure 3
Computational predictions and NMR analysis of ion self‐diffusion. A) Molecular dynamics (MD) snapshot showing Li+ (blue), Cl (green) ions, and their solvation shells (indicated by visible water molecules) inside of a 1.5 nm diameter CNT filled with water. B) Hydration numbers of the first solvent shell for water, Li+ and Cl from MD simulations in bulk (blue) and inside a CNT (red). The first minima in the radial distribution function (RDF) between the ion and water oxygens were used as the distance cutoff for determination of the hydration number of the first ion solvation shell, which is 2.7 and 3.8 Å for Li+ and Cl, respectively. C) Comparison of the self‐diffusion found from NMR (Li+, H2O) and MD simulations (Li+, K+, H2O) in bulk and under CNT confinement. Plots of mean square displacement (MSD) for self‐diffusion coefficient determination, RDF, and ion coordination number are shown in Figure S11, Supporting Information.

References

    1. Marbach S., Bocquet L., Chem. Soc. Rev. 2019, 48, 3102. - PubMed
    1. Luo J., Fan J.‐B., Wang S., Small 2020, 16, 1904076. - PubMed
    1. Wang L., Boutilier M. S. H., Kidambi P. R., Jang D., Hadjiconstantinou N. G., Karnik R., Nat. Nanotechnol. 2017, 12, 509. - PubMed
    1. Bocquet L., Nat. Mater. 2020, 19, 254. - PubMed
    1. a) Siria A., Poncharal P., Biance A. L., Fulcrand R., Blase X., Purcell S. T., Bocquet L., Nature 2013, 494, 455; - PubMed
    2. b) Feng J., Graf M., Liu K., Ovchinnikov D., Dumcenco D., Heiranian M., Nandigana V., Aluru N. R., Kis A., Radenovic A., Nature 2016, 536, 197. - PubMed

LinkOut - more resources