

Clustering and Healthcare Costs With Multiple Chronic Conditions in a US Study
- PMID: 33553094
- PMCID: PMC7859629
- DOI: 10.3389/fpubh.2020.607528
Clustering and Healthcare Costs With Multiple Chronic Conditions in a US Study
Abstract
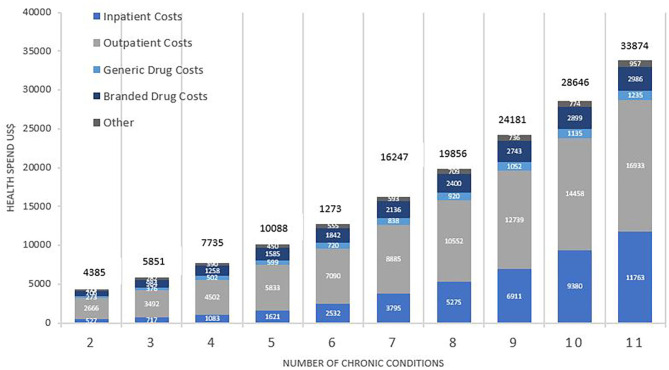
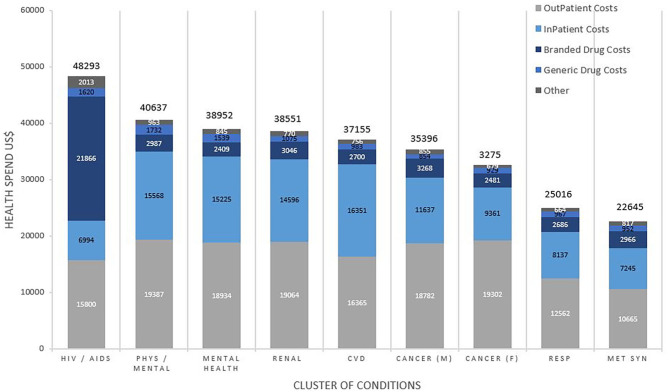
Objective: To investigate healthcare costs and contributors to costs for multiple chronic conditions (MCCs), common clusters of conditions and their impact on cost and utilization. Methods: This was a cross-sectional analysis of US financial claims data representative of the US population, including Medicare, Medicaid, and Commercial insurance claims in 2015. Outcome measures included healthcare costs and contributors; ranking of clusters of conditions according to frequency, strength of association and unsupervised (k-means) analysis; the impact of clustering on costs and contributors to costs. Results: Of 1,878,951 patients, 931,045(49.6%) had MCCs, 56.5% weighted to the US population. Mean age was 53.0 years (SD16.7); 393,121(42.20%) were male. Mean annual healthcare spending was $12,601, ranging from $4,385 (2 conditions) to $33,874 (11 conditions), with spending increasing by 22-fold for inpatient services, 6-fold for outpatient services, 4.5-fold for generic drugs, and 4.2-fold for branded drugs. Cluster ranking using the 3 methodologies yielded similar results: highest ranked clusters included metabolic syndrome (12.2% of US insured patients), age related diseases (7.7%), renal failure (5.6%), respiratory disorders (4.5%), cardiovascular disease(CVD) (4.3%), cancers (4.1-4.3%), mental health-related clusters (1.0-1.5%), and HIV/AIDS (0.2%). Highest spending was in HIV/AIDS clusters ($48,293), mental health-related clusters ($38,952-$40,637), renal disease ($38,551), and CVD ($37,155); with 89.9% of spending on outpatient and inpatient care combined, and 10.1% on medication. Conclusion and Relevance: Over 57% of insured patients in the US may have MCCs. MCC Clustering is frequent and is associated with healthcare utilization. The findings favor health system redesign toward a multiple condition approach for clusters of chronic conditions, alongside other cost-containment measures for MCCs.
Keywords: cancer; cardiovascular disease; chronic disease; disease clustering; healthcare costs; mental health; multimorbidity.
Copyright © 2021 Hajat, Siegal and Adler-Waxman.
Conflict of interest statement
CH and YS received funding from TEVA Pharmaceutical Industries Ltd for their time to conduct the study but did not receive funding to publish the study. AA-W is an employee of TEVA Pharmaceutical Industries Ltd. CH has received consulting fees from ECLAT, a spin-off of the University of Catania for tobacco harm reduction research, and was a paid member by Sustainability of the Advisory Panel for the Tobacco Transformation Index.
Figures
References
MeSH terms
LinkOut - more resources
Full Text Sources
Other Literature Sources