. 2021 Jan 21:8:620409.
doi: 10.3389/fcell.2020.620409. eCollection 2020.

Assessing Autophagy in Muscle Stem Cells

Affiliations

Assessing Autophagy in Muscle Stem Cells

Silvia Campanario et al. Front Cell Dev Biol. .

Abstract

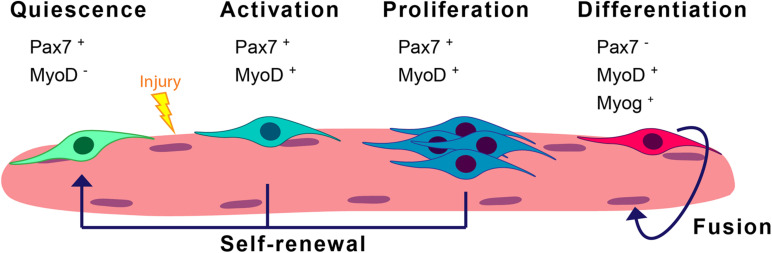
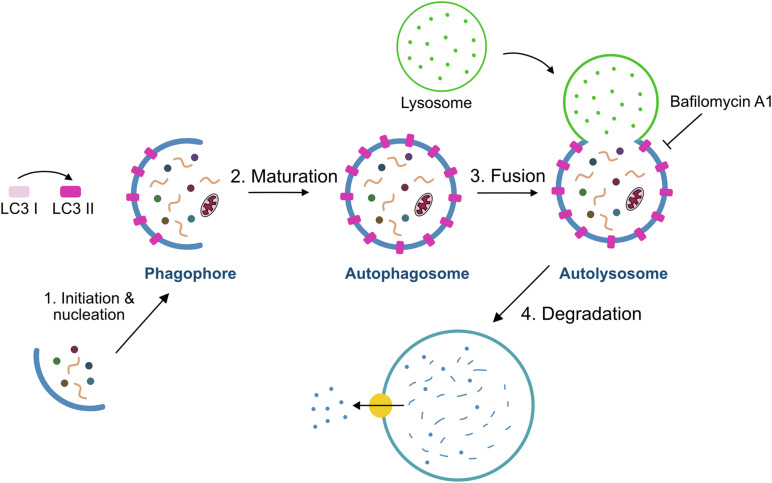
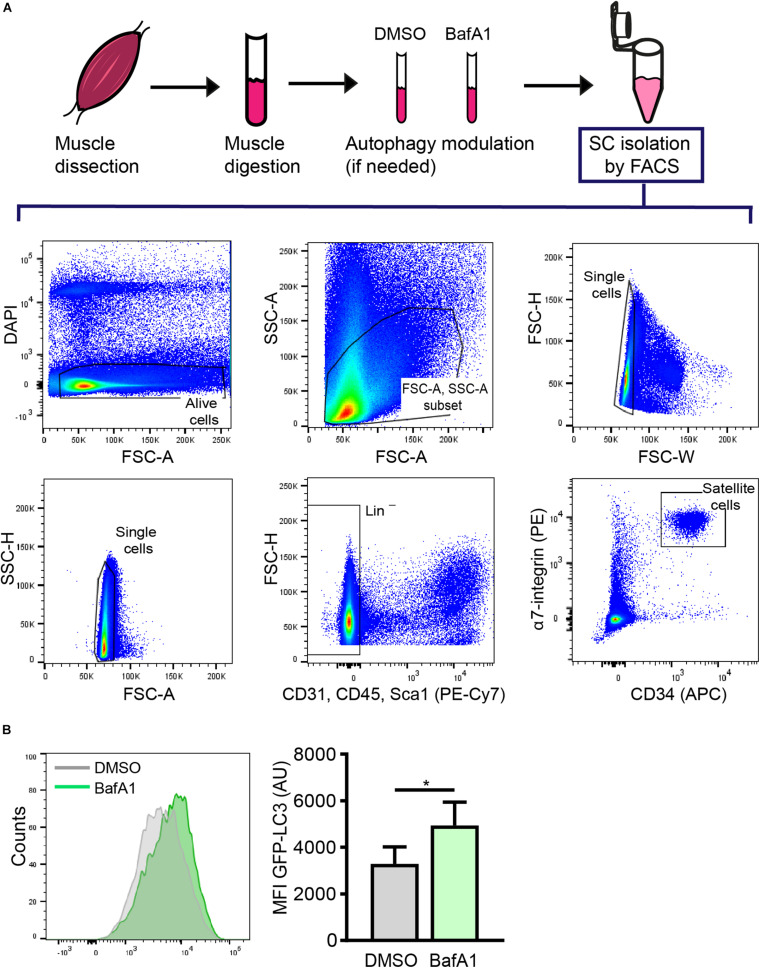
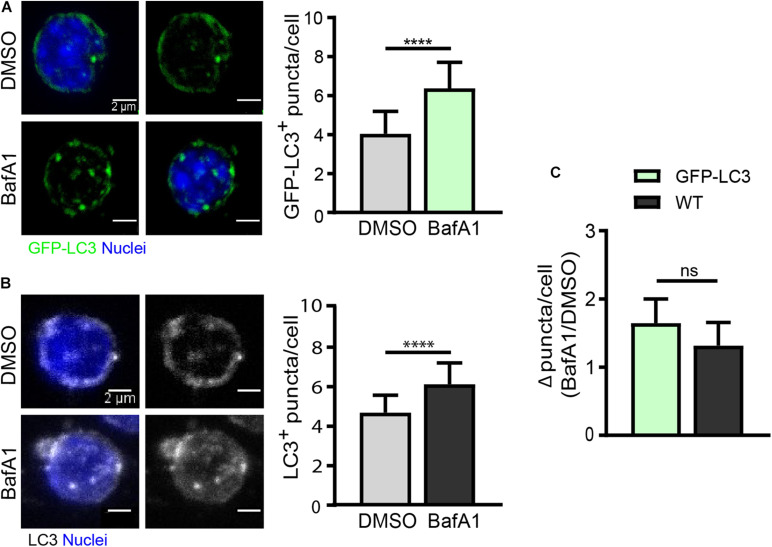
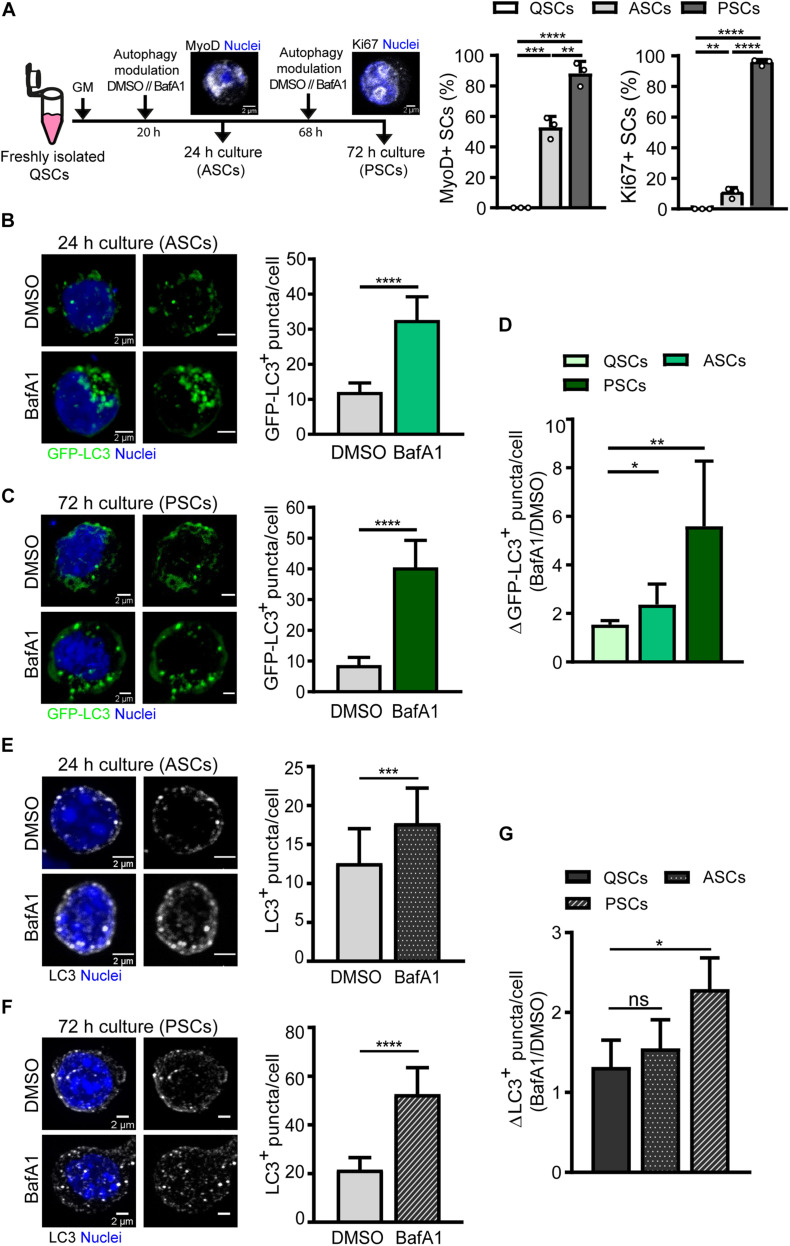
The skeletal muscle tissue in the adult is relatively stable under normal conditions but retains a striking ability to regenerate by its resident stem cells (satellite cells). Satellite cells exist in a quiescent (G0) state; however, in response to an injury, they reenter the cell cycle and start proliferating to provide sufficient progeny to form new myofibers or undergo self-renewal and returning to quiescence. Maintenance of satellite cell quiescence and entry of satellite cells into the activation state requires autophagy, a fundamental degradative and recycling process that preserves cellular proteostasis. With aging, satellite cell regenerative capacity declines, correlating with loss of autophagy. Enhancing autophagy in aged satellite cells restores their regenerative functions, underscoring this proteostatic activity's relevance for tissue regeneration. Here we describe two strategies for assessing autophagic activity in satellite cells from GFP-LC3 reporter mice, which allows direct autophagosome labeling, or from non-transgenic (wild-type) mice, where autophagosomes can be immunostained. Treatment of GFP-LC3 or WT satellite cells with compounds that interfere with autophagosome-lysosome fusion enables measurement of autophagic activity by flow cytometry and immunofluorescence. Thus, the methods presented permit a relatively rapid assessment of autophagy in stem cells from skeletal muscle in homeostasis and in different pathological scenarios such as regeneration, aging or disease.

Keywords: autophagy; flow cytometry; immunofluorescence; quiescence; regeneration; satellite cell; skeletal muscle; stem cell.


Conflict of interest statement

The authors declare that the research was conducted in the absence of any commercial or financial relationships that could be construed as a potential conflict of interest.

Figures

FIGURE 1
FIGURE 1
Scheme of the satellite cell myogenic program. SCs are normally in quiescence and enter a myogenic cycle upon stress conditions such as injury. In the steady-state, they express Pax7. Activation of SCs can be determined by the co-expression of Pax7 and the myogenic regulatory factor MyoD. Proliferating SCs later differentiate into differentiated/committed progenitors characterized by the downregulation of Pax7 expression and the induction of Myog expression. These differentiated cells will eventually fuse into myofibers. A subset of the proliferating SCs will return to quiescence through the process of self-renewal.
FIGURE 2
FIGURE 2
Schematic model of the autophagy process. The process of autophagy includes four steps: (i) initiation/nucleation where the phagophore is formed and starts engulfing the cargo, (ii) formation of the phagosome by elongation and maturation of the phagophore, (iii) fusion of the phagosome with the lysosome, and (iv) degradation of the internal material by lysosomal hydrolases. Bafilomycin A1 is used to measure autophagy flux through the inhibition of autophagolysosome formation.
FIGURE 3
FIGURE 3
Satellite cell isolation by FACS and subsequent analysis of autophagy through flow cytometry. (A) Representative example of the FACS strategy and gating scheme to isolate quiescent SCs (QSCs) rom resting muscles. (B) Representative example of histogram of LC3-GFP intensity (left panel) and analysis of the mean fluorescence intensity (MFI) by flow cytometry (right panel) in QSCs treated for 4 h with vehicle (DMSO) or BafA1 prior to their isolation by FACS (n = 4). Mean ± SD; two-tailed unpaired t-test. *p < 0.05.
FIGURE 4
FIGURE 4
Autophagy flux analysis in quiescent satellite cells by immunofluorescence. (A) Representative images of GFP+-autophagosomes (green) and nuclei (blue) in freshly isolated QSCs from GFP-LC3 reporter mice (left panel) with the corresponding quantification of GFP-LC3+ puncta per cell (right panel). Treatment with vehicle (DMSO) or BafA1 was performed for 4 h prior QSC isolation by FACS (n = 4). Scale bar, 2 μm. (B) Representative images of LC3-stained autophagosomes and nuclei (blue) in freshly isolated QSCs from WT mice (left panel) with its corresponding quantification of LC3+ puncta per cell (right panel). Treatment with vehicle (DMSO) or BafA1 was performed for 4 h prior QSC isolation by FACS (n = 3). Scale bar, 2 μm. (C) Comparison of autophagy flux in GFP-LC3 or WT QSCs. Autophagy flux was determined as the ratio of the number of autophagosome puncta in BafA1 treated QSCs divided by the number of autophagosome puncta in vehicle (DMSO) treated QSCs (for GFP-LC3: n = 4; for WT: n = 3). Means ± SD; two-tailed unpaired t-test. ****p < 0.0001.
FIGURE 5
FIGURE 5
Autophagy flux analysis in activated and proliferating satellite cells by immunofluorescence. (A) Right panel: Scheme of the process followed for autophagy flux assessment in (1) activated SCs (ASCs), characterized by the presence of MyoD protein and still lacking cell-cycle proteins such as Ki67, and (2) proliferating SCs (PSCs), marked by the expression of the proliferative marker Ki67. Left panels: quantification of the percentage of MyoD+ and Ki67+ cultured SCs at 24 and 72 h time points. (B,C) Representative images of GFP+-autophagosomes (green) and nuclei (blue) in ASCs (B) and PSCs (C) from GFP-LC3 reporter mice (left panels) with the corresponding quantification of GFP-LC3+ puncta per cell (right panels). Treatment with vehicle (DMSO) or BafA1 was performed for 4 h prior fixation (n = 3). Scale bar, 2 μm. (D) Autophagy flux represented as the ratio of GFP-LC3+ puncta in BafA1 and vehicle (DMSO) along SC myogenesis in vitro (n = 3–6). (E,F) Representative images of LC3 + -autophagosomes (gray scale) and nuclei (blue) in ASCs (E) and PSCs (F) from WT mice (left panels) with the corresponding quantification of LC3+ puncta per cell (right panels). Treatment with vehicle (DMSO) or BafA1 was performed as in panels (B,C) (n = 4). Scale bar, 2 μm. (G) Autophagy flux, depicted as the ratio of LC3+ puncta in BafA1 and vehicle (DMSO), along SC myogenesis in vitro (n = 4). Means ± SD; two-tail unpaired t-test. *p < 0.05, **p < 0.01, ***p < 0.001, and ****p < 0.0001.

References

    1. Chang N. C., Sincennes M.-C., Chevalier F. P., Brun C. E., Lacaria M., Segalés J., et al. (2018). The Dystrophin Glycoprotein Complex Regulates the Epigenetic Activation of Muscle Stem Cell Commitment. Cell Stem Cell 22 755–768.e6. 10.1016/j.stem.2018.03.022 - DOI - PMC - PubMed
    1. Dumont N. A., Wang Y. X., von Maltzahn J., Pasut A., Bentzinger C. F., Brun C. E., et al. (2015). Dystrophin expression in muscle stem cells regulates their polarity and asymmetric division. Nat. Med. 21 1455–1463. 10.1038/nm.3990 - DOI - PMC - PubMed
    1. Evano B., Tajbakhsh S. (2018). Skeletal muscle stem cells in comfort and stress. NPJ Regen. Med. 3 1–13. 10.1038/s41536-018-0062-3 - DOI - PMC - PubMed
    1. Feige P., Brun C. E., Ritso M., Rudnicki M. A. (2018). Orienting Muscle Stem Cells for Regeneration in Homeostasis, Aging, and Disease. Cell Stem Cell 23 653–664. 10.1016/j.stem.2018.10.006 - DOI - PMC - PubMed
    1. Fiacco E., Castagnetti F., Bianconi V., Madaro L., De Bardi M., Nazio F., et al. (2016). Autophagy regulates satellite cell ability to regenerate normal and dystrophic muscles. Cell Death Differ. 23 1839–1849. 10.1038/cdd.2016.70 - DOI - PMC - PubMed

LinkOut - more resources