. 2020 Dec 23:20:366-378.
doi: 10.1016/j.omtm.2020.12.006. eCollection 2021 Mar 12.

Rapid evolution of blood-brain-barrier-penetrating AAV capsids by RNA-driven biopanning

Affiliations

Rapid evolution of blood-brain-barrier-penetrating AAV capsids by RNA-driven biopanning

Mathieu Nonnenmacher et al. Mol Ther Methods Clin Dev. .

Abstract

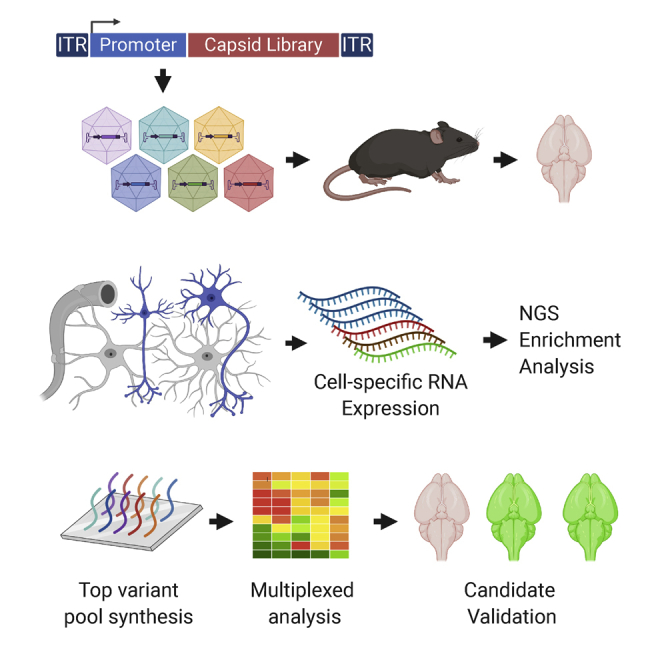
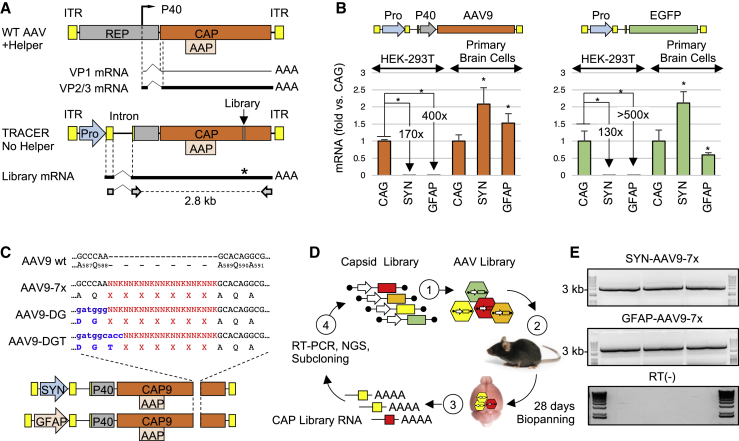
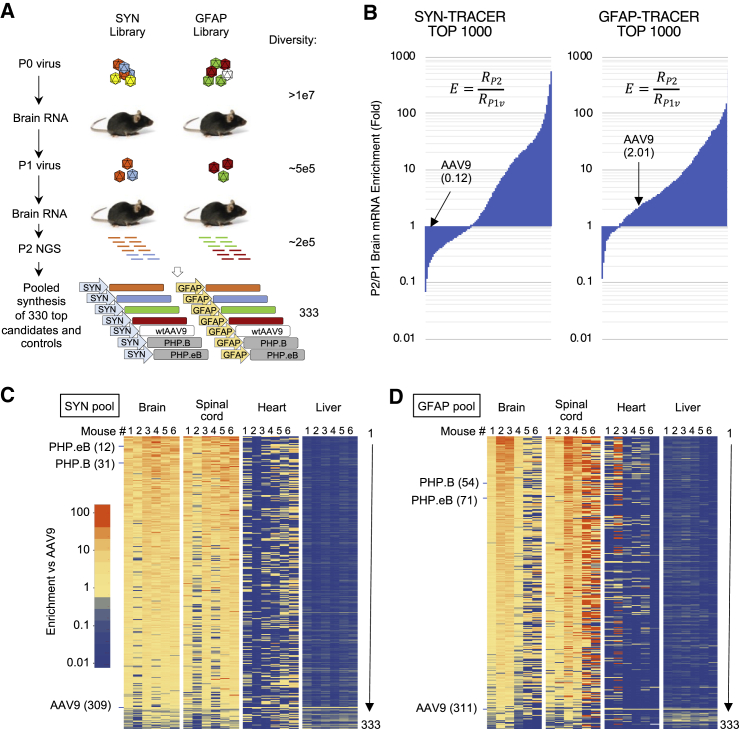
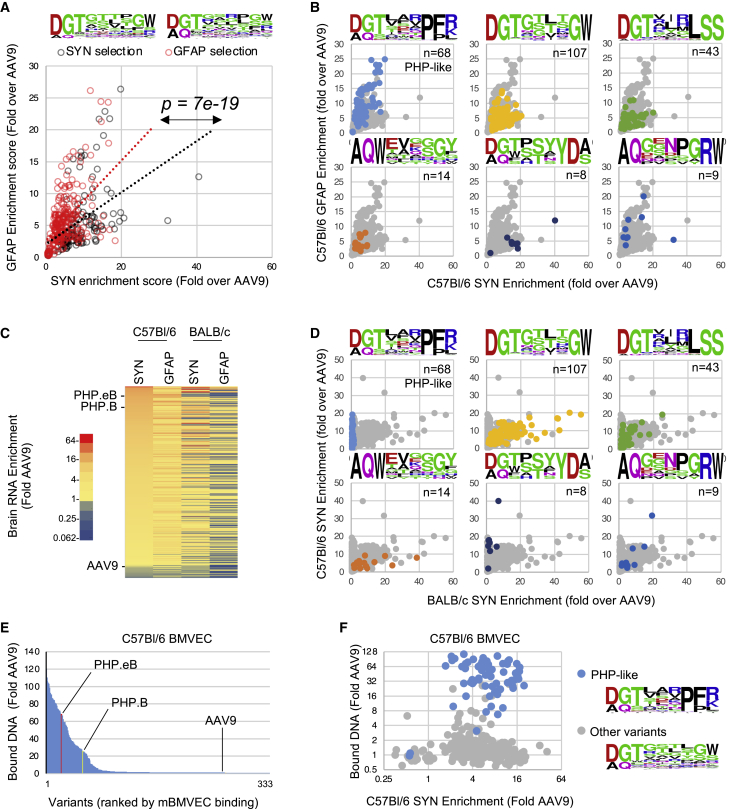
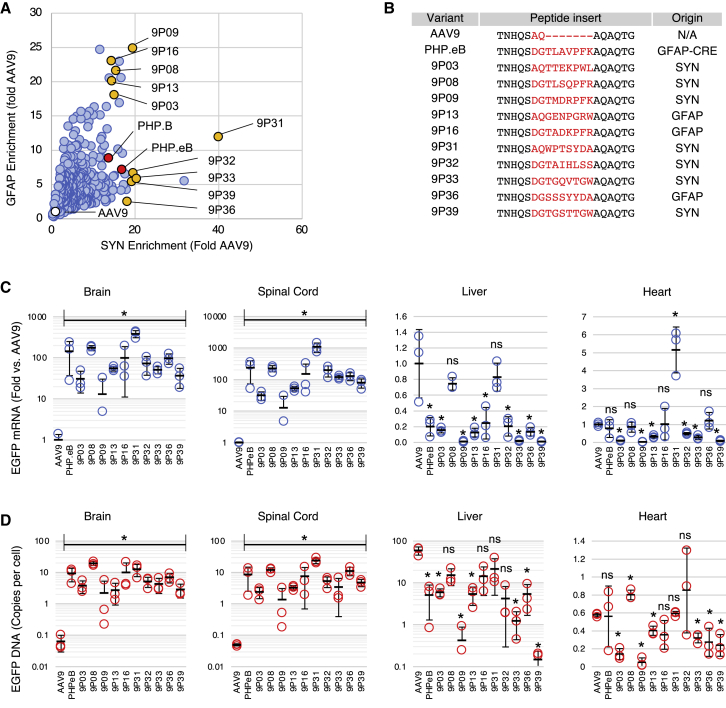
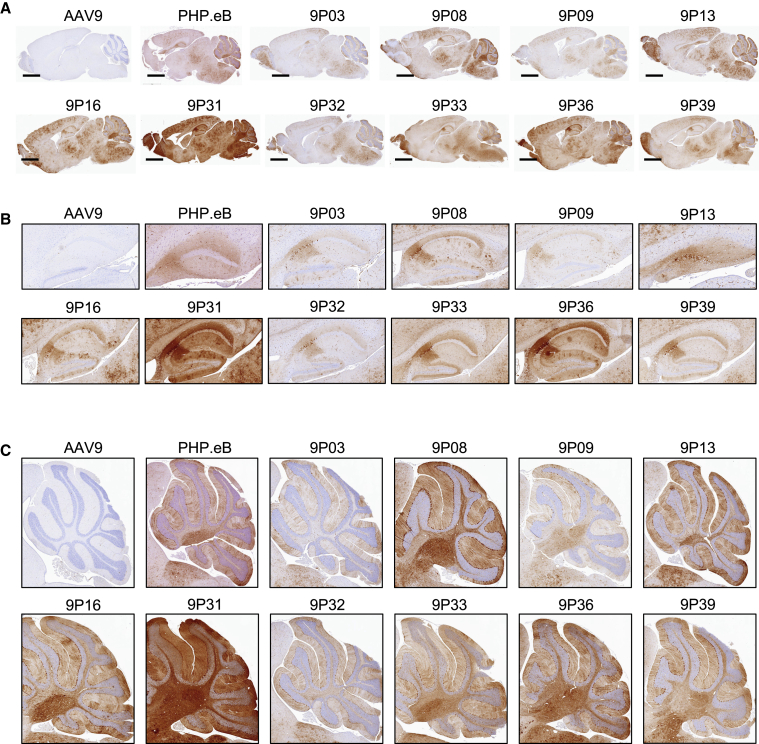
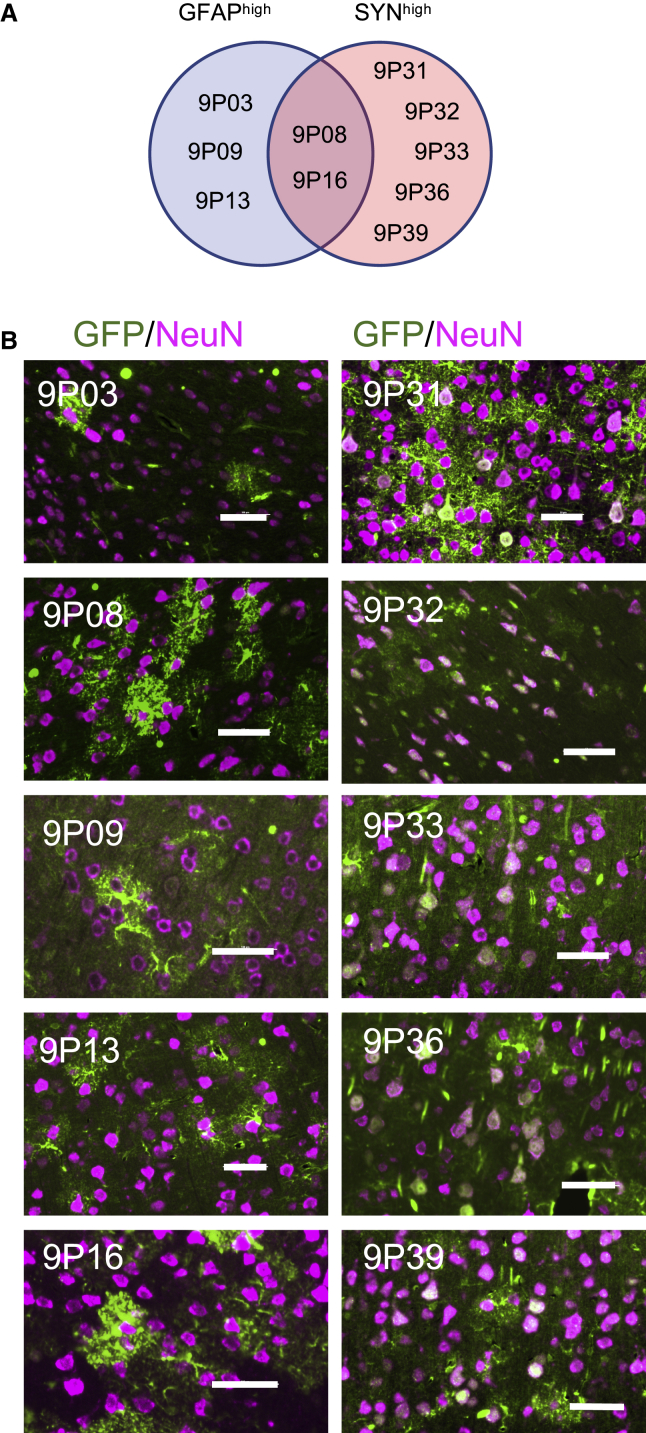
Therapeutic payload delivery to the central nervous system (CNS) remains a major challenge in gene therapy. Recent studies using function-driven evolution of adeno-associated virus (AAV) vectors have successfully identified engineered capsids with improved blood-brain barrier (BBB) penetration and CNS tropism in mouse. However, these strategies require transgenic animals and thus are limited to rodents. To address this issue, we developed a directed evolution approach based on recovery of capsid library RNA transcribed from CNS-restricted promoters. This RNA-driven screen platform, termed TRACER (Tropism Redirection of AAV by Cell-type-specific Expression of RNA), was tested in the mouse with AAV9 peptide display libraries and showed rapid emergence of dominant sequences. Ten individual variants were characterized and showed up to 400-fold higher brain transduction over AAV9 following systemic administration. Our results demonstrate that the TRACER platform allows rapid selection of AAV capsids with robust BBB penetration and CNS tropism in non-transgenic animals.

Keywords: AAV; Adeno-associated virus; Blood-Brain barrier; Brain; CNS; Capsid library; Directed evolution.


Conflict of interest statement

M.N., W.W., M.A.C., X.-Q.R., C.H., A.Z.R., J.T., K.B., K.T., N.P., C.H.-Y.C., and J.H. are paid employees of Voyager Therapeutics Inc. Voyager has filed a patent application related to the subject matter of this paper: WO2020072683. S.M.P. currently serves on the board of Voyager Therapeutics, Sage Therapeutics, Karuna Therapeutics, and Alnylam Pharmaceuticals.

Figures

None
Graphical abstract
Figure 1
Figure 1
Design of RNA recovery strategy for cell-specific biopanning (A) Map of wild-type AAV (top) and TRACER library vectors (bottom). ITR, inverted terminal repeat. Pro, promoter. Dashed lines indicate AAV intron (top) or synthetic CMV-globin intron (bottom), solid lines represent minor (thin line) and major (thick line) capsid transcripts. Primers used for the recovery of the 2.8-kb capsid library amplicon are indicated at the bottom. (B) Activity of CAG, SYN, and GFAP promoters in TRACER tandem configuration (left panel) or single promoter configuration (right panel). Depicted transgenes were packaged in AAV9 capsid and tested in HEK293T cells or primary mouse brain cells (1e5 VG/cell, n = 3). RNA was quantified by real-time RT-PCR 48 h post-treatment. Values indicate RNA expression normalized to CAG vectors in each cell type (mean ± SD). ∗p < 0.05 (t test). (C) Construction of peptide display libraries. Randomized sequences preceded by AQ, DG, or DGT residues were introduced in AAV9 VP1 at the indicated positions in vectors containing SYN or GFAP promoter. (D) Overview of the in vivo selection process. (1) DNA libraries are used to produce a virus library, (2) virus libraries are injected intravenously (i.v.) into mice (1e12VG per mouse), (3) bulk RNA is recovered from whole brains 28 days post-injection, (4) capsid fragments encoding the peptide library are amplified by RT-PCR, analyzed by next-generation sequencing (NGS), and cloned into TRACER vectors for another round of selection. (E) Example of RT-PCR products obtained from three mice 28 days after injection with SYN-driven and GFAP-driven library (top and middle panel, respectively). The 3-kb band from the molecular weight marker is indicated. Bottom panel: RT-negative controls.
Figure 2
Figure 2
NGS-driven evolution of TRACER libraries in C57BL/6 mice (A) TRACER workflow and library diversity through successive rounds of evolution and pooled synthesis. Values indicate the number of unique variants detected by NGS. (B) Enrichment analysis of P2 brain RNA. Enrichment score E indicates the relative RNA abundance of each variant (RP2) normalized to P1 virus stock (RP1v). Top 1,000 variants of SYN and GFAP libraries are depicted. (C and D) Fitness analysis of SYN-driven (C) and GFAP-driven (D) pool of 330 capsid candidates plus AAV9, PHP.B, and PHP.eB controls. Heatmaps represent relative RNA enrichment score in brain and spinal cord and DNA enrichment score in heart and liver. Values are normalized to AAV9 control. Numbered columns represent individual animals (n = 6). Values represent the average of two codon variants for each mutant and are ranked according the average of 6 brains. Ranking of control capsids is indicated.
Figure 3
Figure 3
Genotype-to-phenotype analysis of synthetic capsid pool from C57BL/6 CNS biopanning (A) Comparative neuron and astrocyte fitness of the capsid variants originating from SYN- or GFAP-driven library biopanning (black and red circles, respectively). Each data point represents the average neuron (SYN-driven) and astrocyte (GFAP-driven) RNA enrichment score in i.v.-dosed C57BL/6 mice (n = 6), normalized to AAV9. Linear regression trendline of each population is indicated. p value indicates the statistical difference between the average GFAP-to-SYN score ratio of each subpopulation (unpaired t test). Frequency plots of peptides from SYN- and GFAP-evolved subpools are indicated on top. (B) Enrichment scores of each capsid sequence family in GFAP- (y axis) and SYN-driven RNA assays (x axis). The frequency plots and number of variants in each group are indicated. (C) Comparative brain RNA enrichment of 330 variants in C57BL/6 mice (n = 6) and BALB/c mice (n = 6) following i.v. injection. Color scale indicates the average RNA enrichment score normalized to AAV9. Variants are ranked by SYN-driven RNA enrichment score in C57BL/6 mice. (D) Comparative SYN-driven RNA enrichment score of distinct capsid families in C57BL/6 and BALB/c mice. The frequency plots and number of variants of each group are indicated. (E) Multiplexed binding assay of synthetic capsid pool to C57BL/6 mouse primary brain microvascular endothelial cells (BMVECs). Values indicate bound viral DNA enrichment score relative to AAV9. Ranking of reference PHP.eB, PHP.B, and AAV9 capsids is indicated. (F) Scatterplot presenting the correlation between virus binding to mouse BMVECs and C57BL/6 brain RNA enrichment scores. The PHP-like capsid variants are indicated by blue dots, all other variants by gray dots.
Figure 4
Figure 4
Individual characterization of TRACER capsid candidates (A) Brain RNA enrichment score of pooled synthetic variants in the SYN- and GFAP-driven assay. Values are normalized to AAV9. Yellow dots indicate candidates chosen for individual testing; red and white dots indicate the PHP and AAV9 control capsids, respectively. (B) Sequence of capsids selected for individual characterization. The right column indicates the biopanning method used to evolve each variant. (C) Real-time RT-PCR analysis of EGFP transgene RNA expression in the brain, spinal cord, liver, and heart 28 days after i.v. injection of each capsid in C57BL/6 mice (4e11 VG per mouse, n = 3). Values indicate mean ± SD (n = 3), normalized to AAV9. ∗p < 0.05 relative to AAV9 (unpaired t test); ns, not significant. (D) AAV genome biodistribution measured by qPCR. Values indicate mean ± SD (n = 3) EGFP copies per diploid cell. ∗p < 0.05 relative to AAV9 (unpaired t test); ns, not significant. All brain and spinal cord samples were statistically different from AAV9.
Figure 5
Figure 5
Brain transduction profile of TRACER capsid candidates in adult mice EGFP was detected by immunohistochemistry (IHC) from formalin-fixed paraffin-embedded (FFPE) sections in the brain of adult C57BL/6 mice 28 days after i.v. infusion with 4e11 VG per mouse. (A–C) Representative images of whole-brain sagittal sections (A), hippocampus (B), and cerebellum (C) are shown. Scale bar in (A), 2 mm.
Figure 6
Figure 6
Cortical neuron transduction by TRACER capsid candidates in adult mice (A) Relative fitness of TRACER capsids in the GFAP-driven and SYN-driven library NGS assay. (B) EGFP (green) and NeuN (magenta) were detected by IHC from FFPE sections in the brain of adult C57BL/6 mice 28 days after intravascular infusion with 4e11 VG per mouse. Representative images of cortex are shown. Bar, 50 μm.

References

    1. Deverman B.E., Ravina B.M., Bankiewicz K.S., Paul S.M., Sah D.W.Y. Gene therapy for neurological disorders: progress and prospects. Nat. Rev. Drug Discov. 2018;17:641–659. - PubMed
    1. Gray S.J., Woodard K.T., Samulski R.J. Viral vectors and delivery strategies for CNS gene therapy. Ther. Deliv. 2010;1:517–534. - PMC - PubMed
    1. Mendell J.R., Al-Zaidy S., Shell R., Arnold W.D., Rodino-Klapac L.R., Prior T.W., Lowes L., Alfano L., Berry K., Church K. Single-dose gene-replacement therapy for spinal muscular atrophy. N. Engl. J. Med. 2017;377:1713–1722. - PubMed
    1. Ellsworth J.L., Gingras J., Smith L.J., Rubin H., Seabrook T.A., Patel K., Zapata N., Olivieri K., O’Callaghan M., Chlipala E. Clade F AAVHSCs cross the blood brain barrier and transduce the central nervous system in addition to peripheral tissues following intravenous administration in nonhuman primates. PLoS One. 2019;14:e0225582. - PMC - PubMed
    1. Wang D., Tai P.W.L., Gao G. Adeno-associated virus vector as a platform for gene therapy delivery. Nat. Rev. Drug Discov. 2019;18:358–378. - PMC - PubMed