

Open Data to Support Agricultural Diversification (version October 2020)
- PMID: 33553528
- PMCID: PMC7844438
- DOI: 10.1016/j.dib.2021.106781
Open Data to Support Agricultural Diversification (version October 2020)
Abstract
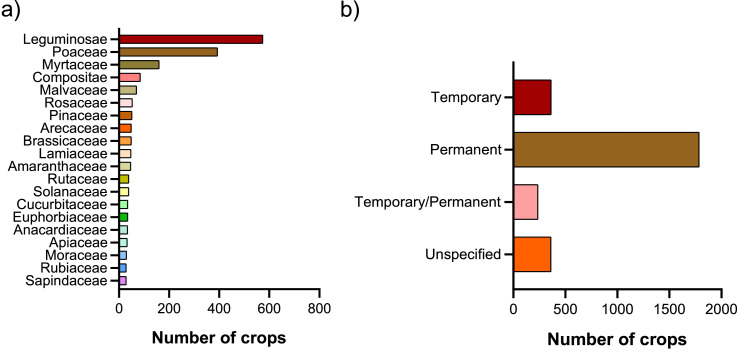
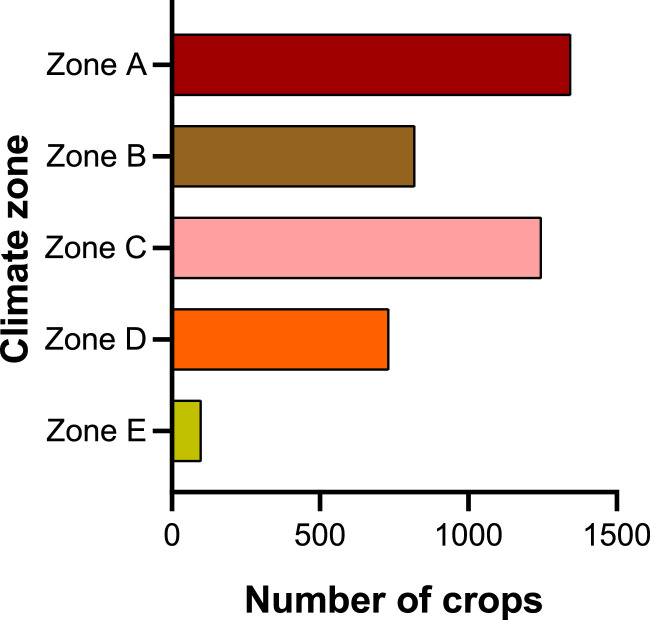
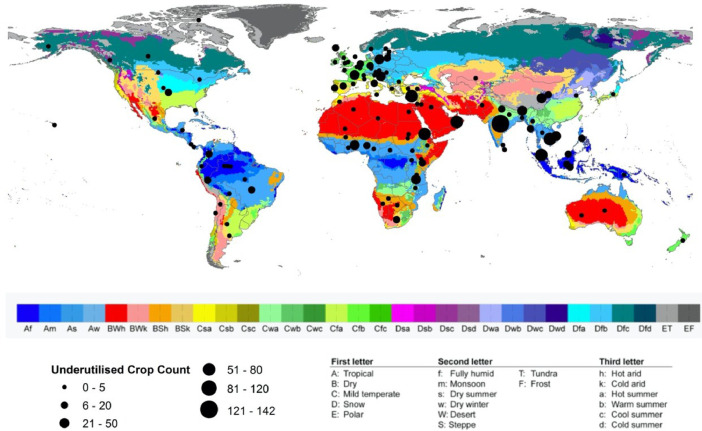
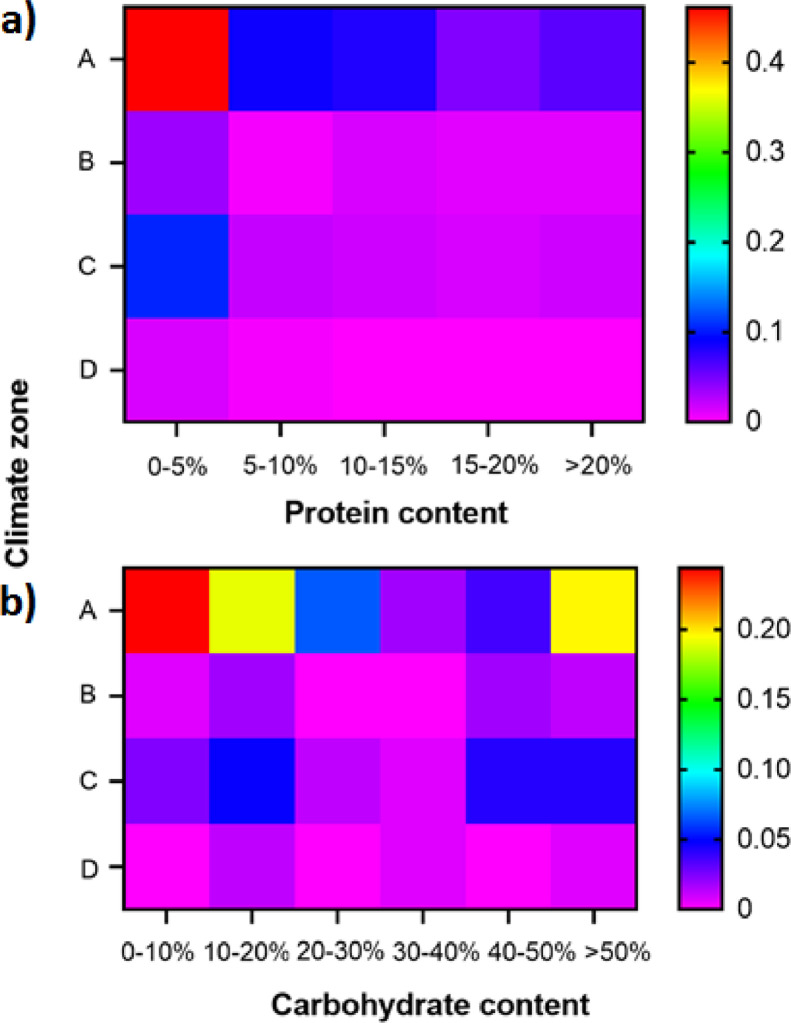
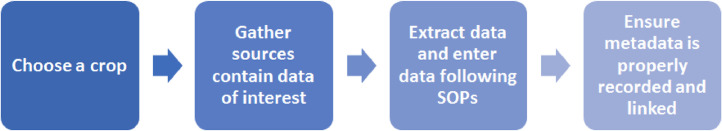
Following the development of a database that was specifically designed to store value chain information, particularly for underutilised crops, this article describes the data that are currently stored in the database and accessible through its web portal. The data includes various datasets on utilisation status, agro-ecological requirements and season lengths, potential yield and nutritional composition of crops. The data are stored in the form of tables with fixed data elements (column attributes). This article outlines the standard procedures (SOPs) that were developed in-house for data collection, metadata creation and data curation. These processes were used to ensure the quality and reusability of the data that is made available publicly through the database interface. Various statistics and example visualisations are provided to demonstrate the significance of such data for developing solutions for sustainable agricultural diversification.
Keywords: Agro-ecological data; Crop nutrition composition; Neglected and underutilised crops; Potential yield.
© 2021 Published by Elsevier Inc.
Conflict of interest statement
The authors declare that they have no known competing financial interests or personal relationships which have, or could be perceived to have, influenced the work reported in this article.
Figures

References
-
- FAO Crop ecological requirements database (ECOCROP) 2020 http://www.fao.org/land-water/land/land-governance/land-resources-planni... (accessed 04 August 2020)
-
- USDA-ARS FoodData Central. 2019 https://fdc.nal.usda.gov/ (accessed 04 August 2020)
-
- FAO Crops statistics - concepts, definitions and classifications. 2020 http://www.fao.org/economic/the-statistics-division-ess/methodology/meth... (accessed 04 August 2020)
-
- Grieser J., Gommes R., Cofield S., Bernardi M. New gridded maps of Koeppen's climate classification. 2006 http://www.fao.org/nr/climpag/globgrids/KC_classification_en.asp (accessed 04 August 2020)
-
- FAO World programme for the census of agriculture. Classification of crops. 2010 http://www.fao.org/fileadmin/templates/ess/documents/world_census_of_agr... (accessed 04 August 2020)
LinkOut - more resources
Full Text Sources
Other Literature Sources
