Case Reports
. 2021 Jan 20:22:100315.
doi: 10.1016/j.ensci.2021.100315. eCollection 2021 Mar.

Chemoradiation induced multiple sclerosis-like demyelination

Affiliations
Case Reports

Chemoradiation induced multiple sclerosis-like demyelination

Alexandra Borges et al. eNeurologicalSci. .

Abstract

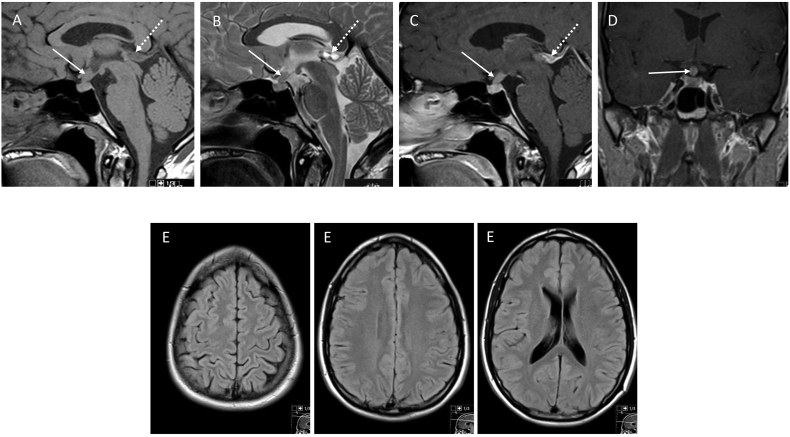
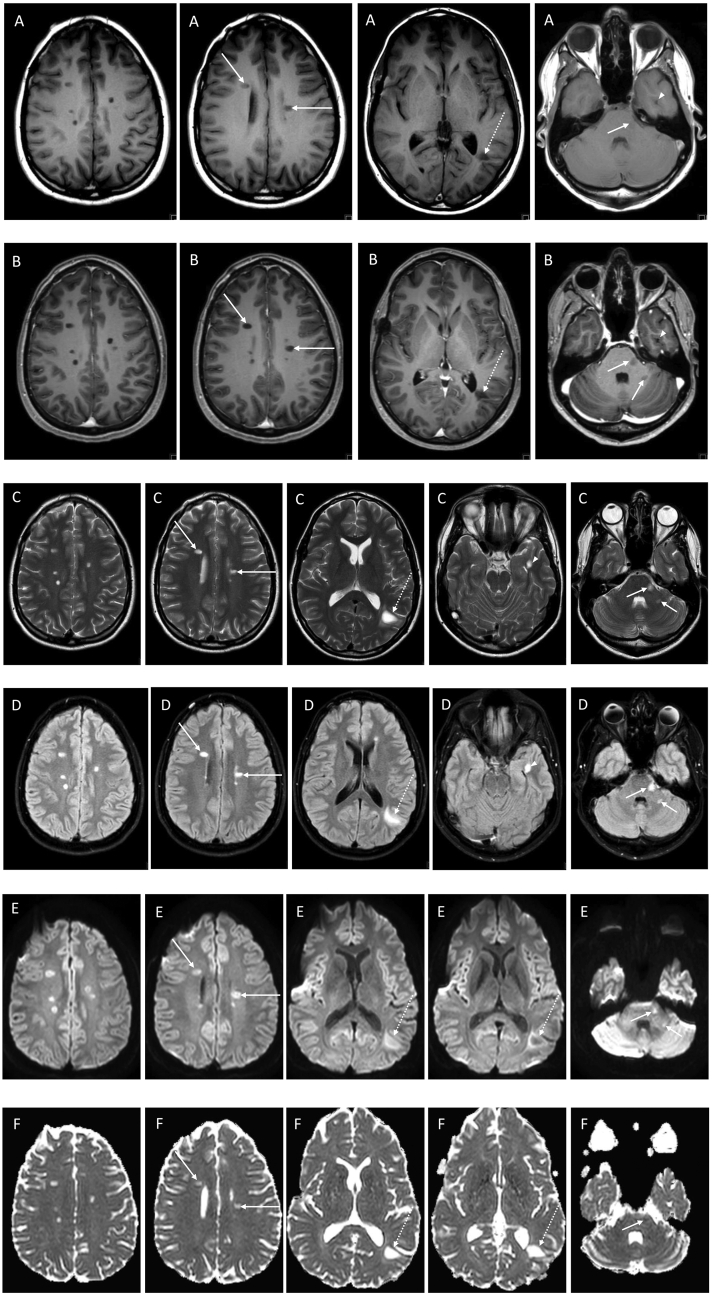
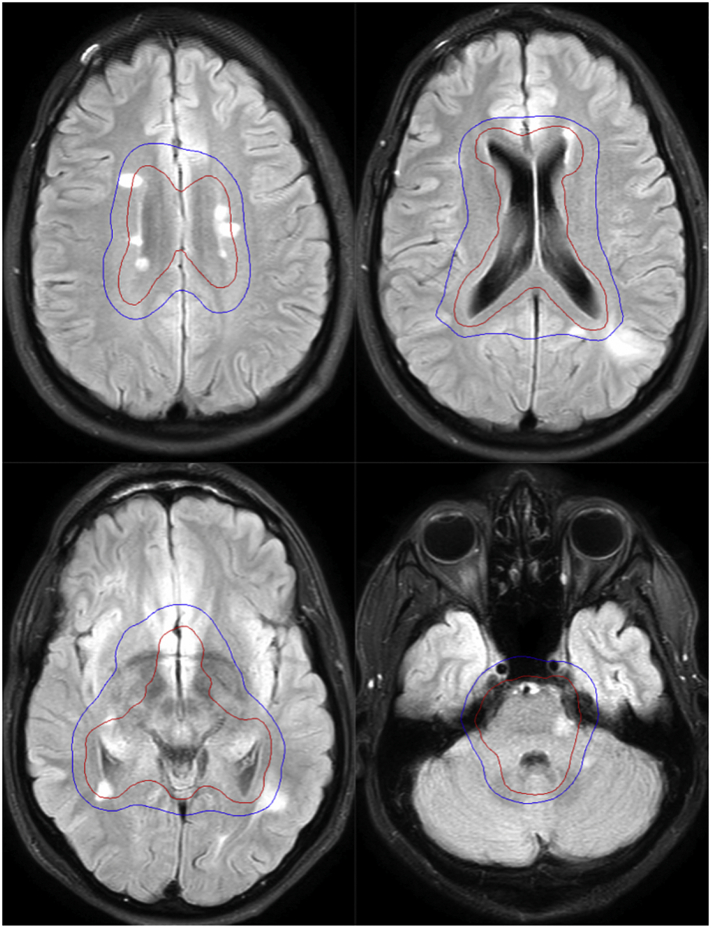
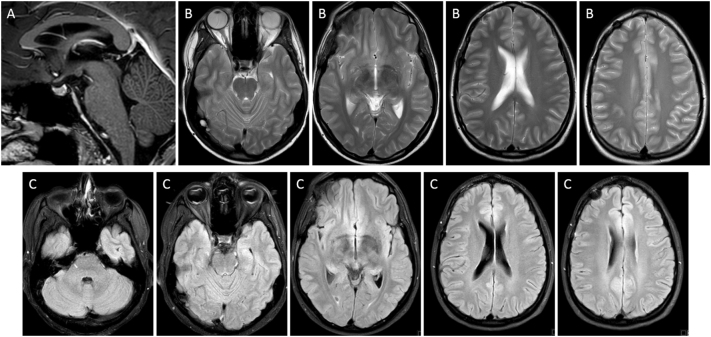
We report the case of a 28-year-old man, diagnosed with a non-secreting, non-metastatic suprasellar germinoma treated with chemoradiation who developed, four months after completion of radiation therapy, multiple discrete demyelinating lesions mimicking multiple sclerosis (MS). The patient had no previous diagnosis of MS and the neuroimaging studies performed both at the time of diagnosis and after chemotherapy, pre-irradiation, showed no evidence of white matter lesions. He remained asymptomatic, with no focal neurological deficits. Biochemical analysis of the CSF was positive for the intrathecal synthesis of IgG with oligoclonal bands. Follow-up MRI six months later showed a spontaneous decrease in lesion size and resolution of associated inflammatory signs, with lesions remaining stable in number. We discuss the potential origin of these white matter lesions, which may correspond to MS-like late-delayed demyelination secondary to chemoradiation therapy, in a previously predisposed patient.

Keywords: Chemorradiation-induced demyelination; Chemorradiation-induced neurotoxicity; MRI; Multiple sclerosis-like demyelination; Neuro-oncology.


Conflict of interest statement

None.

Figures

Fig. 1
Fig. 1
MRI of the brain at diagnosis: Sagittal T1W (A), T2W (B) and CE T1W (C) and coronal CE T1W (D) images demonstrate an enhancing mass lesion in the infundibulum and pituitary stalk protruding into the suprasellar cistern (arrows). An incidental peripheral enhancing epiphyseal cyst is also noted (dashed arrows). Axial FLAIR images (E) throughout the brain at this stage were unremarkable with no evidence of demyelinating WM lesions.
Fig. 2
Fig. 2
MRI of the brain 3 months after completion of the CRT protocol: Pre- (A) and post‑gadolinium (B) axial T1W, axial T2W (C), axial FLAIR (D) and DWI images, b1000 (E) and ADC maps (F) demonstrate the interval appearance of multiple discrete deep and periventricular white matter lesions hypointense on T1 and hyperintense on T2W images, with no contrast enhancement on post‑gadolinium T1W images, most with facilitated diffusion and a few with a thin rim of restricted diffusion. Most lesions are located in the deep white matter of the centrum semi-ovale, some affecting the pericallosal region oriented perpendicular to the body of the lateral ventricles (arrows), with the largest lesion in the peri-atrial white matter on the left side (dashed arrows). This lesion shows a peripheral digitiform T2W/FLAIR hyperintense rim consistent with peripheral edema with no significant mass effect upon the ventricular trigone or adjacent sulci. Also noted are 2 lesions in the posterior fossa, one in the left lateral aspect of the pons and the other in the posterior aspect of the middle cerebellar peduncle (short arrows) and a lesion in the left temporal lobe adjacent to the lateral margin of the temporal horn (arrowhead).
Fig. 3
Fig. 3
Dose distribution after registration of CT planning upon axial FLAIR images of the follow-up MRI scan obtained 3 months after treatment. The 24 Gy isodose curve (red) shows the volume irradiated with the prescribed dose. The 20 Gy isodose curve (blue) represents the volume that received at least 20 Gy. (For interpretation of the references to colour in this figure legend, the reader is referred to the web version of this article.)
Supplementary Fig. 1
MRI of the brain after 4 cycles of chemotherapy (cisplatin, etoposide and ifosfamide) and before radiation therapy: Sagittal T1W (A), Axial T2W (B) and FLAIR (C) images throughout the brain show complete macroscopic response of the pituitary stalk lesion and no signs of treatment complication namely, no evidence of white matter lesions.

References

    1. Gibson E.M., Nagaraja S., Ocampo A., Tam L.T., Wood L.S., Pallegar P.N. Methotrexate chemotherapy induces persistent triglial dysregulation that underlies chemotherapy-related cognitive impairment. Cell. 2019;176(1–2):43–55. doi: 10.1016/j.cell.2018.10.049. - DOI - PMC - PubMed
    1. Helson L. Radiation-induced demyelination and remyelination in the central nervous system: a literature review. Anticancer Res. 2018;38(9):4999–5002. doi: 10.21873/anticanres.12818. - DOI - PubMed
    1. Zrzavy T., Hametner S., Wimmer I., Butovsky O., Weiner H.L., Lassmann H. Loss of ‘homeostatic’ microglia and patterns of their activation in active multiple sclerosis. Brain. 2017;140:1900–1913. - PMC - PubMed
    1. Dagher N.N., Najafi A.R., Kayala K.M., Elmore M.R., White T.E., Medeiros R., West B.L., Green K.N. Colony-stimulating factor 1 receptor inhibition prevents microglial plaque association and improves cognition in 3xTg-AD mice. J. Neuroinflammation. 2015;12:139. - PMC - PubMed
    1. Seigers R., Schagen S.B., Coppens C.M., van der Most P.J., van Dam F.S., Koolhaas J.M., Buwalda B. Methotrexate decreases hippocampal cell proliferation and induces memory deficits in rats. Behav. Brain Res. 2009;201:279–284. - PubMed

Publication types

LinkOut - more resources