Review
. 2021 Feb 8;13(1):4.
doi: 10.1186/s13089-020-00202-6.

The role of ultrasound imaging in vascular compression syndromes

Affiliations
Review

The role of ultrasound imaging in vascular compression syndromes

Renato Farina et al. Ultrasound J. .

Abstract

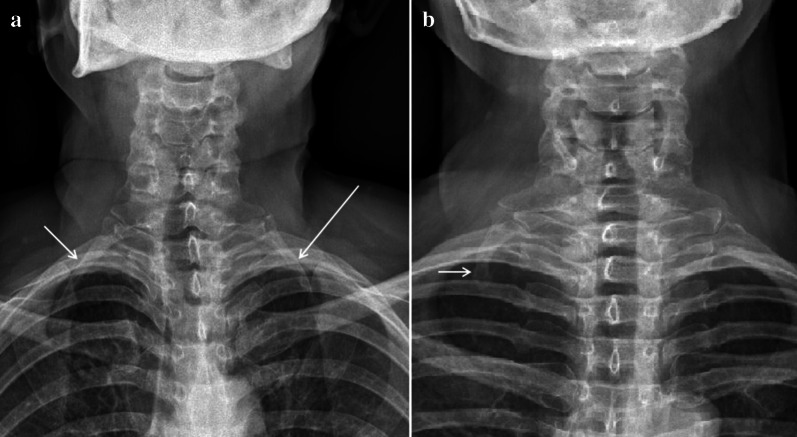
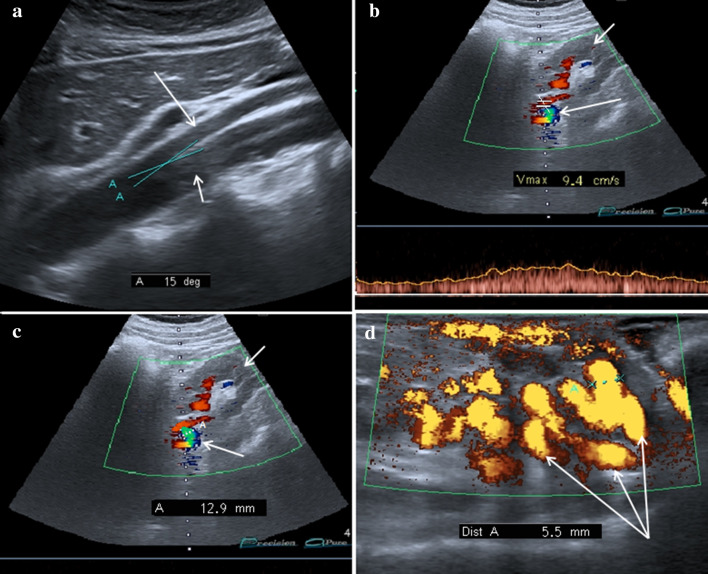
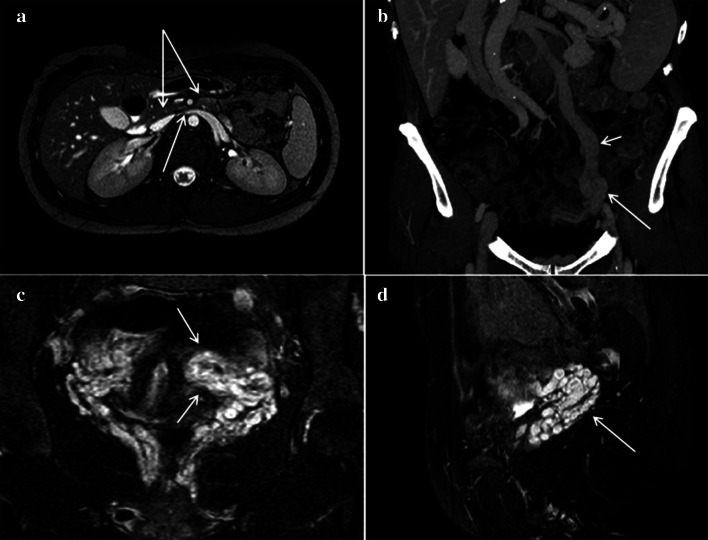
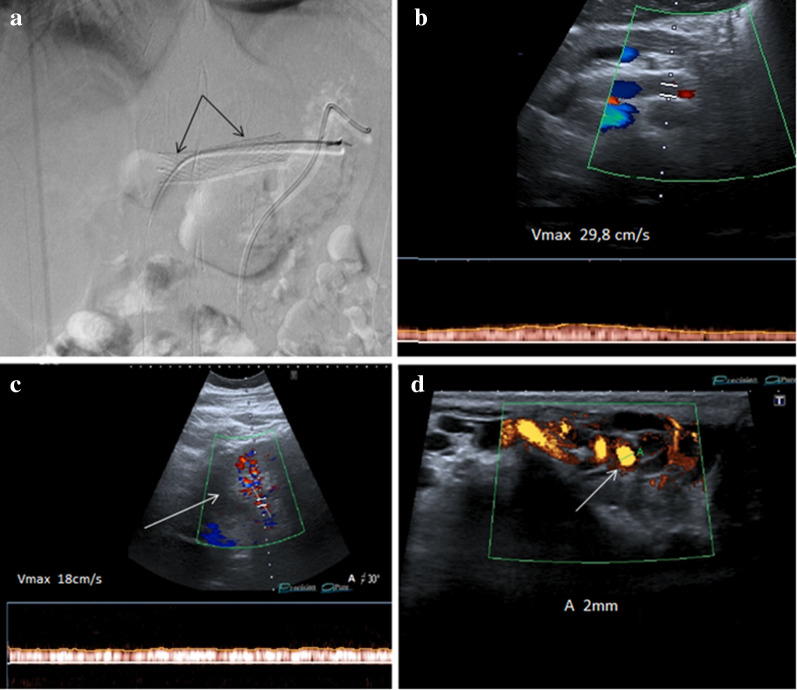
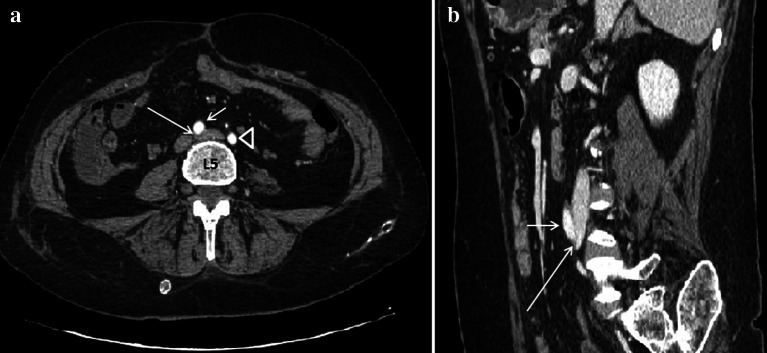
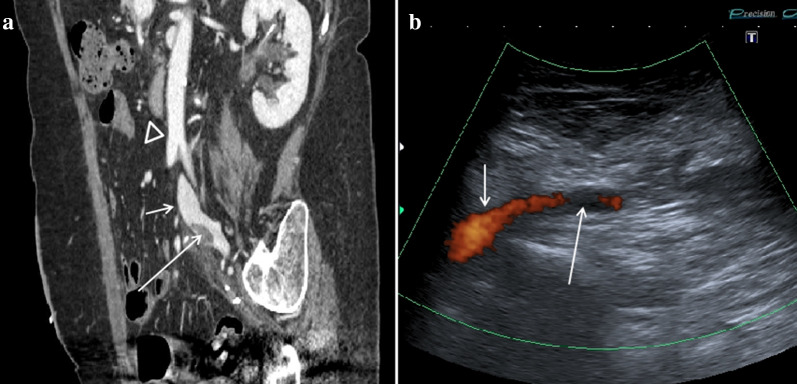
Vascular compression syndromes are rare alterations that have in common the compression of an arterial and/or venous vessel by contiguous structures and can be congenital or acquired. The best known are the Thoracic Outlet Syndrome, Nutcracker Syndrome, May-Thurner Syndrome, and Dunbar Syndrome. The incidence of these pathologies is certainly underestimated due to the non-specific clinical signs and their frequent asymptomaticity. Being a first-level method, Ultrasound plays a very important role in identifying these alterations, almost always allowing a complete diagnostic classification. If in expert hands, this method can significantly contribute to the reduction of false negatives, especially in the asymptomatic population, where the finding of the aforementioned pathologies often happens randomly following routine checks. In this review, we briefly discuss the best known vascular changes, the corresponding ultrasound anatomy, and typical ultrasound patterns.

Keywords: Abdominal ultrasound; Color Doppler ultrasound; Dunbar syndrome; Duplex Doppler ultrasound; May–Thurner syndrome; Nutcracker syndrome.


Conflict of interest statement

The authors declare that they have no competing interests.

Figures

Fig. 1
Fig. 1
TOS. Standard chest X-ray. Patient with bilateral cervical ribs: a right (short arrow) and left (long arrow) cervical rib. Patient with unilateral cervical rib: b right cervical rib (arrow)
Fig. 2
Fig. 2
Scheme summarizing the anatomical relationships between the shoulder structures in TOS. a Cost-clavicular space delimited inferiorly by first rib, superiorly by clavicle, and anteriorly by anterior scalene muscle. b Inter-scalene triangle delimited inferiorly by clavicle, medially by anterior scalene muscle, and laterally by middle scalene muscle
Fig. 3
Fig. 3
B-Mode US: transverse scan of the cost-clavicular space which highlights the anterior scalene muscle (short arrow), the middle scalene muscle (long arrow), and the posterior scalene muscle (long-dashed arrow). Subclavian artery (head of arrow). Subclavian vein (dashed short arrow)
Fig. 4
Fig. 4
a Standard radiography showing a cervical rib on the right (arrow). b Color Doppler US examination, performed with lowered arms, shows a regular diameter (12 mm) and a regular flow-C of the right subclavian artery. d Color Doppler US examination with raised arms shows artifacts due to turbulent flux. E: Duplex Doppler US shows increase in peak speed (105 cm/s)
Fig. 5
Fig. 5
Hypertrophy of the right anterior scalene muscle. a Duplex Doppler US examination of the right subclavian veins, with lowered arms, shows a regular diameter and flow. b With arms raised to 90° Duplex Doppler US shows a peak speed reduction due to compression by the anterior scalene muscle. c Duplex Doppler US of left subclavian vein, with lowered arms, shows a regular caliber and flow. d Which remain regular even with arms raised to 90°
Fig. 6
Fig. 6
NCS. Scheme summarizing that describes the relationships between the aorto-mesenteric angle, left renal vein, and duodenum. a Healthy patient with regular aorto-mesenteric angle. b Aorto-mesenteric angle lower than 22° which causes compression of the left renal vein
Fig. 7
Fig. 7
B-Mode US: longitudinal sub-xiphoid scan of the abdominal aorta performed in supine decubitus. a Measurement of the aorto-mesenteric angle "A" in patient with NCS. Abdominal aorta (short arrow). Superior mesenteric artery (long arrow). b Duplex Doppler US shows a peak speed reduction in left renal vein. c Measurement of the left renal vein diameter. d Power Doppler US shows varicosity of the gonadal plexus (vein diameter 5.5 mm)
Fig. 8
Fig. 8
Abdomen MDCT examination. a The reconstruction according to a sagittal plane shows the characteristic pattern with aorta and superior mesenteric artery "beak-like" appearance (black arrow). b The coronal plane reconstruction shows dilation of the gonadal vein and gonadal plexus (arrow). c The axial plane reconstruction shows a stenosis of duodenum (arrow). "D": Duodenum. d The axial plane reconstruction shows a stenosis of the left renal vein (arrow)
Fig. 9
Fig. 9
Abdomen MRI examination. a The axial plane reconstruction shows a stenosis of the left renal vein and duodenum (arrows) in the aorto-mesenteric angle (arrow). b The coronal plane reconstruction shows gonadal vein (short arrow) and gonadal plexus (long arrow) dilatation. c The coronal plane reconstruction shows the varicosities of the gonadal plexus (arrow), also evident in the reconstruction according to a sagittal plane (arrow)—D
Fig. 10
Fig. 10
a This angiographic image shows the endovascular stent after positioning into the left renal vein (arrows). b Duplex Doppler US highlights the patency of the vascular stent showing a flow with a peak velocity of about 29.8 cm/s. c After stenting, Color Doppler US show a increased flow of the left renal vein (18 cm/s). d Power Doppler US shows a regular caliber of the pampiniform plexus vein (diameters of 2 mm)
Fig. 11
Fig. 11
MTS. Scheme summarizing describing the main anatomical structures involved in the syndrome. a Left common iliac vein compression (short arrow) by the right common iliac artery (long arrow). AO Abdominal aorta. IV c Inferior cava vein. RR a Right renal artery. LRA Left renal artery. b This illustration shows the right common short iliac artery which compresses the left common iliac vein (long arrow) against the spinal column
Fig. 12
Fig. 12
Power Doppler US and Duplex Doppler US of common iliac veins. a Left common iliac vein (arrow) dilatation in the pre-stenotic tract (14 mm). b Right common iliac vein (long arrow) with regular diameter (12 mm). Right common iliac artery (short arrow). c Duplex Doppler US shows a regular peak speed in the post-stenotic tract of the left common iliac vein (15.8 cm/s) and peak speed reduction in the pre-stenotic tract (7.3 cm/s) -D
Fig. 13
Fig. 13
Abdomen MDCT examination. a The axial plane reconstruction shows a stenosis of the left common iliac vein (long arrow) by the right common iliac artery (short arrow) against the vertebral column. Fifth lumbar vertebra (L5). Left common iliac artery (head arrow). b The sagittal plane reconstruction shows the point where the right common iliac artery (short arrow) compresses the left common iliac vein (long arrow) against the vertebral column
Fig. 14
Fig. 14
Abdominal MDCT examination. a The sagittal plane reconstruction shows an enhancement defect (long arrow) in the left common iliac vein (short arrow) due to a thrombus. Abdominal aorta (head arrow). b Power Doppler US shows a thrombus (long arrow) in the left common iliac vein (short arrow)
Fig. 15
Fig. 15
DS. Scheme summarizing of the anatomical structures involved in DS. More caudal course of the MAL that compresses the CA in the expiratory apnea phase
Fig. 16
Fig. 16
Abdominal MDCT examination. a The axial plane reconstruction shows a stenosis of CA (arrow), origin off the abdominal aorta. b The sagittal plane reconstruction shows stenosis of CA with the "Hooked appearance" (long arrow). AO: Abdominal aorta. Superior mesenteric artery (short arrow)
Fig. 17
Fig. 17
Abdomen MRI examination. a The axial plane reconstruction shows a stenosis of CA (long arrow); origin off the abdominal aorta (short arrow). b The axial plane reconstruction, cranially to the CA origin, shows the MAL (arrows). Abdominal aorta (short arrow)
Fig. 18
Fig. 18
Transverse sub-xiphoid Ultrasonographic scan. a Color Doppler US performed in inspiratory apnea that shows a regular diameter of the CA (short arrow). Epatic artery (long arrow). Splenic artery (head of arrow). b Color Doppler US performed in expiratory apnea that shows severe stenosis at the origin of the CA with aliasing due to turbulent flow and high-speed peak. c Duplex Doppler US of the CA performed in inspiratory apnea that shows a slight increase in peak speed. d Duplex Doppler of the CA performed in expiratory apnea that shows very high peak speeds (> 200 cm/s) due to severe stenosis

References

    1. Jones MR, Prabhakar A, Viswanath O, et al. Thoracic outlet syndrome: a comprehensive review of pathophysiology, diagnosis, and treatment. Pain Ther. 2019;8(1):5–18. doi: 10.1007/s40122-019-0124-2. - DOI - PMC - PubMed
    1. Pesser N, Teijink JAW, Vervaart K et al. (2020) Value of Ultrasound in the Diagnosis of Neurogenic Thoracic Outlet Syndrome. Eur J Vasc Endovasc Surg. - PubMed
    1. Schut PC, Eggink AJ, Cohen-Overbeek TE, et al. Miscarriage is associated with cervical ribs in thoracic outlet syndrome patients. Early Hum Dev. 2020;144:105027. doi: 10.1016/j.earlhumdev.2020.105027. - DOI - PubMed
    1. Benzon HT, Rodes ME, Chekka K, et al. Scalene muscle injections for neurogenic thoracic outlet syndrome: case series. Pain Pract. 2012;12(1):66–70. doi: 10.1111/j.1533-2500.2011.00468.x. - DOI - PubMed
    1. Farina R, Foti PV, Iannace FA et al. (2019) Thoracic outlet syndrome: a rare case with bilateral cervical ribs and bilateral anterior scalene hypertrophy. J Ultrasound. - PMC - PubMed

LinkOut - more resources