

Exceptionally high but still growing predatory reef fish biomass after 23 years of protection in a Marine Protected Area
- PMID: 33556064
- PMCID: PMC7870052
- DOI: 10.1371/journal.pone.0246335
Exceptionally high but still growing predatory reef fish biomass after 23 years of protection in a Marine Protected Area
Abstract
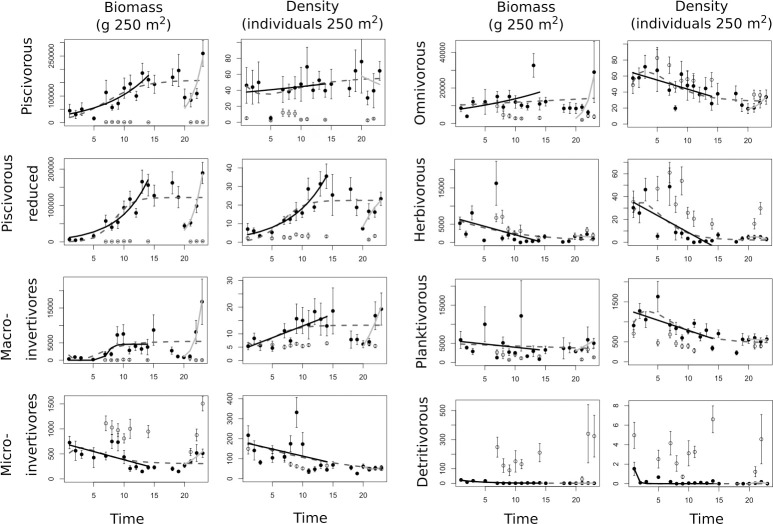
Marine Protected Areas (MPAs) help replenish fish assemblages, though different trophic levels may show diverse recovery patterns. Long-term protection is required to achieve total recovery but poaching events may prevent the achievement of full carrying capacity. Here, we have analysed the effect of long-term protection on the entire reef fish community and the different trophic levels in the Cabo de Palos-Islas Hormigas MPA (SE Spain; SW Mediterranean Sea) in order to assess their recovery patterns after 23 years of protection. We compared the values for carrying capacity obtained with the maximum values achieved at regional scale, and we assessed the effect of a reduction in the surveillance over a few years, during which poaching events increased, on the recovery patterns. We found that, overall, biomass of fishes increased with time while density diminished. In particular, piscivorous and macro-invertivore fish increased while the other trophic groups remained constant or declined, suggesting top-down processes. For the entire study period, those trophic groups were approaching carrying capacity; however, when accounting only for the period in which enforcement was high and constant, they grew exponentially, indicating that full carrying capacity may have not been achieved yet. When compared to other Mediterranean MPAs, the Cabo de Palos-Islas Hormigas MPA showed values for biomass that were disproportionately higher, suggesting that local factors, such as habitat structure and associated oceanographic processes, may be responsible for the dynamics found. Our results help to understand the potential trajectories of fish assemblages over a consolidated MPA and highlight empirically how the reduction of surveillance in a period may change the recovery patterns.
Conflict of interest statement
The authors have declared that no competing interests exist.
Figures


References
-
- Pérez-Ruzafa A, García-Charton JA, Marcos C. North East Atlantic vs. Mediterranean Marine Protected Areas as Fisheries Management Tool. Front Mar Sci 2017;4:245 10.3389/fmars.2017.00245 - DOI
-
- Guidetti P, Sala E. Community-wide effects of marine reserves in the Mediterranean Sea. Mar Ecol Prog Ser 2007;335:43–56. 10.3354/meps335043 - DOI
Publication types
MeSH terms
LinkOut - more resources
Full Text Sources
Other Literature Sources
