. 2021 Feb 8;16(2):e0246772.
doi: 10.1371/journal.pone.0246772. eCollection 2021.

Estimation of the fraction of COVID-19 infected people in U.S. states and countries worldwide

Affiliations

Estimation of the fraction of COVID-19 infected people in U.S. states and countries worldwide

Jungsik Noh et al. PLoS One. .

Abstract

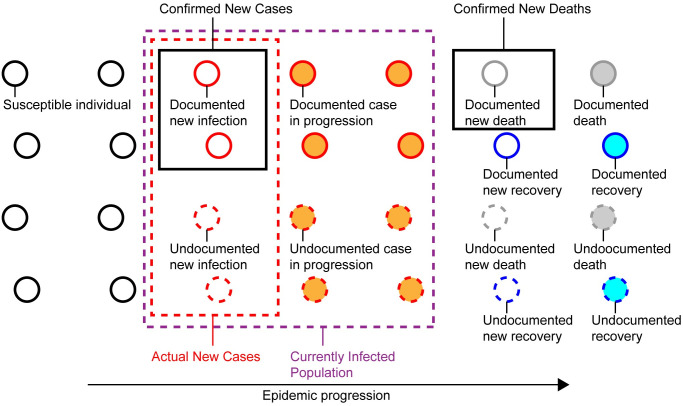
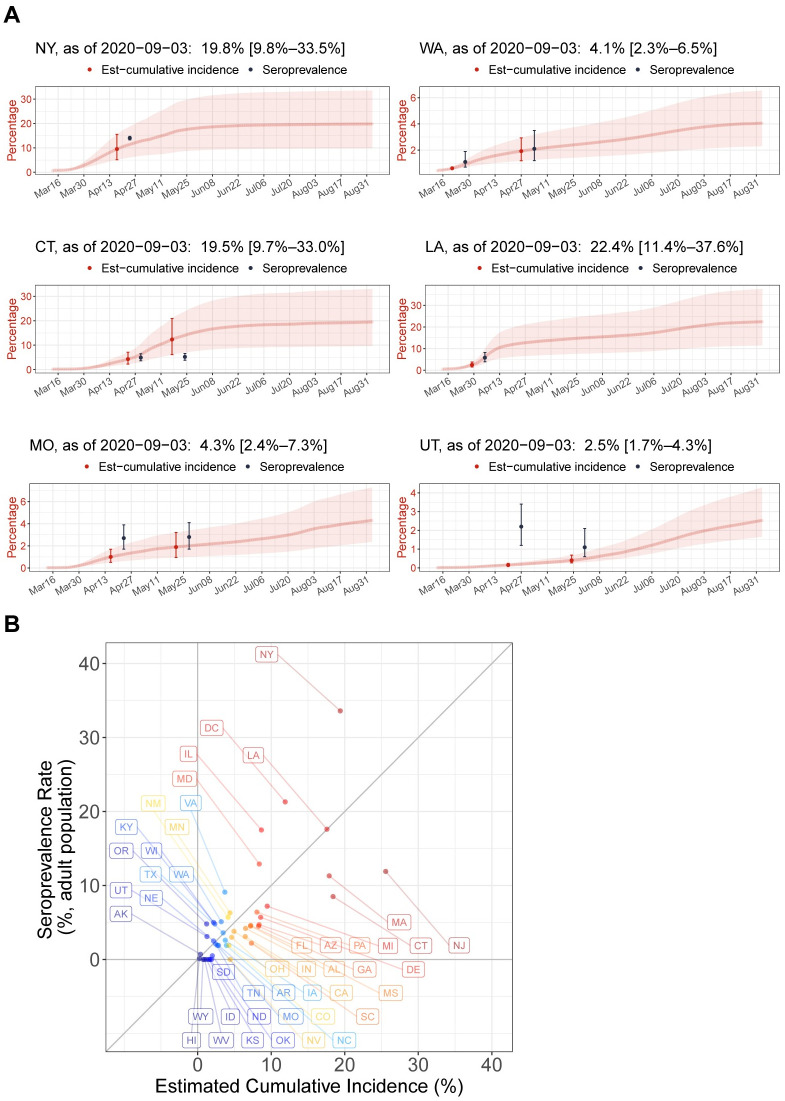
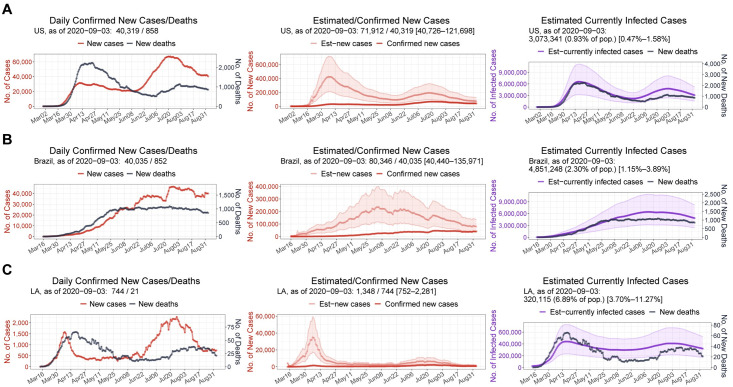
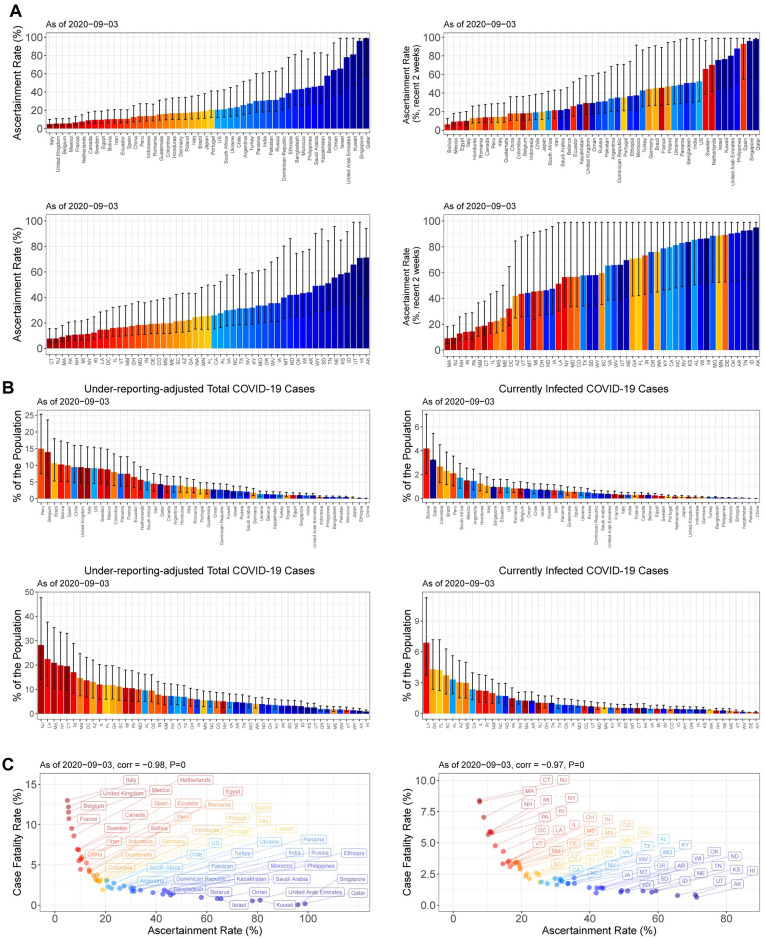
Since the beginning of the coronavirus disease 2019 (COVID-19) pandemic, daily counts of confirmed cases and deaths have been publicly reported in real-time to control the virus spread. However, substantial undocumented infections have obscured the true size of the currently infected population, which is arguably the most critical number for public health policy decisions. We developed a machine learning framework to estimate time courses of actual new COVID-19 cases and current infections in all 50 U.S. states and the 50 most infected countries from reported test results and deaths. Using published epidemiological parameters, our algorithm optimized slowly varying daily ascertainment rates and a time course of currently infected cases each day. Severe under-ascertainment of COVID-19 cases was found to be universal across U.S. states and countries worldwide. In 25 out of the 50 countries, actual cumulative cases were estimated to be 5-20 times greater than the confirmed cases. Our estimates of cumulative incidence were in line with the existing seroprevalence rates in 46 U.S. states. Our framework projected for countries like Belgium, Brazil, and the U.S. that ~10% of the population has been infected once. In the U.S. states like Louisiana, Georgia, and Florida, more than 4% of the population was estimated to be currently infected, as of September 3, 2020, while in New York this fraction is 0.12%. The estimation of the actual fraction of currently infected people is crucial for any definition of public health policies, which up to this point may have been misguided by the reliance on confirmed cases.


Conflict of interest statement

The authors have declared that no competing interests exist.

Figures

Fig 1
Fig 1. Undocumented COVID-19 cases.
In an epidemic process, a population is categorized into susceptible, infected, deceased, or recovered individuals. Counts of confirmed COVID-19 cases, deaths, and recoveries are insufficient to calculate the number of currently infected individuals (purple dotted box) because of substantial undocumented infections not captured by diagnostic tests. The input to the proposed framework is the daily counts of confirmed new cases and deaths (black boxes). Using pandemic parameters such as the Infection-Fatality-Rate and the mean duration periods from infection to death and recovery, the framework estimates the counts of actual new cases (red dotted box) and currently infected individuals.
Fig 2
Fig 2. Validation of prediction framework using seroprevalence rates in U.S. states.
(A) Seroprevalence rates in six U.S. states (black) surveyed until May 2020, are overlaid on computationally estimated time courses of cumulative incidence rates (red) from March 13 to September 3, 2020, for New York, Washington state, Connecticut, Louisiana, Missouri, and Utah from upper-left to lower-right. The indicated date of the seroprevalence rate is the mid-point of the serum collection period. The corresponding cumulative incidence estimate is on the date one-week prior to the date of the seroprevalence rate to account for time delays from infection to antibody detection. Error bars and shaded bands indicate 95% confidence intervals. (B) The Y-axis shows the seroprevalence rates in adult (≥18 years) populations of 45 U.S. states and Washington D.C. estimated from a nationwide plasma sample (n = 28,503) of patients on dialysis during July 2020. The X-axis shows the computationally estimated cumulative incidence rates for the states on July 8, 2020, that is one week prior to the mid-point of the plasma sample collection period, July 2020.
Fig 3
Fig 3. Estimated time courses of actual new cases and current infections.
7-day rolling-averaged counts of daily confirmed new cases and deaths (left) until September 3, 2020, for the U.S. (A), Brazil (B), and Louisiana (C). An estimate of new cases (middle) is the under-reporting-adjusted number of newly infected individuals each day. An estimate of current infections (right) is the under-reporting-adjusted number of infected individuals who have not yet been recovered or deceased. Shaded bands indicate 95%-confidence intervals.
Fig 4
Fig 4. Estimates of ascertainment rates, cumulative incidence rates, and actual fractions of current infections in 50 countries and 50 U.S. states.
(A) Estimates of ascertainment rates for the whole period until September 3, 2020 (left), and recent ascertainment rates (August 21–September 3, 2020) (right), in 50 countries with the most confirmed cases (upper) and 50 U.S. states (lower). (B) Cumulative incidence rates (left), and percentages of currently infected individuals in each population (right) in the 50 countries (upper) and 50 U.S. states (lower). Error bars indicate 95%-confidence intervals. (C) Scatter plots between the crude case-fatality-rates and the ascertainment rates for the 50 countries (left) and 50 U.S. states (right). Spearman rank correlations and their P-values are shown.

References

    1. COVID-19 Dashboard by the Center for Systems Science and Engineering at Johns Hopkins University. https://coronavirus.jhu.edu/map.html [Accessed September 3, 2020].
    1. Dong E, Du H, Gardner L. An interactive web-based dashboard to track COVID-19 in real time. Lancet Infect Dis. 2020;20(5):533–4. 10.1016/S1473-3099(20)30120-1 - DOI - PMC - PubMed
    1. Li R, Pei S, Chen B, Song Y, Zhang T, Yang W, et al. Substantial undocumented infection facilitates the rapid dissemination of novel coronavirus (SARS-CoV-2). Science. 2020;368(6490):489–93. 10.1126/science.abb3221 - DOI - PMC - PubMed
    1. Havers FP, Reed C, Lim T, Montgomery JM, Klena JD, Hall AJ, et al. Seroprevalence of Antibodies to SARS-CoV-2 in 10 Sites in the United States, March 23-May 12, 2020. JAMA Intern Med. 2020. 10.1001/jamainternmed.2020.4130 - DOI - PubMed
    1. Rosenberg ES, Tesoriero JM, Rosenthal EM, Chung R, Barranco MA, Styer LM, et al. Cumulative incidence and diagnosis of SARS-CoV-2 infection in New York. Ann Epidemiol. 2020;48:23–9 e4. 10.1016/j.annepidem.2020.06.004 - DOI - PMC - PubMed

Publication types