. 2021 Jul:49:101181.
doi: 10.1016/j.molmet.2021.101181. Epub 2021 Feb 6.

Spatiotemporal GLP-1 and GIP receptor signaling and trafficking/recycling dynamics induced by selected receptor mono- and dual-agonists

Affiliations

Spatiotemporal GLP-1 and GIP receptor signaling and trafficking/recycling dynamics induced by selected receptor mono- and dual-agonists

Aaron Novikoff et al. Mol Metab. 2021 Jul.

Abstract

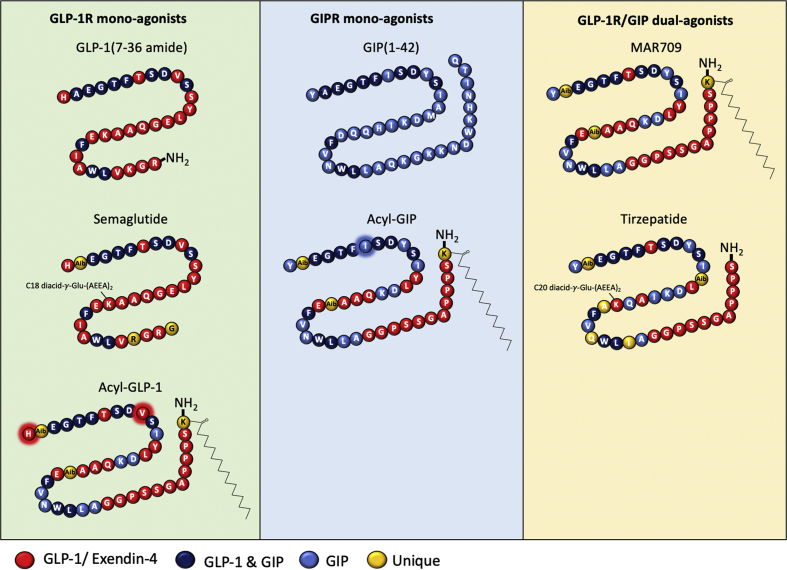
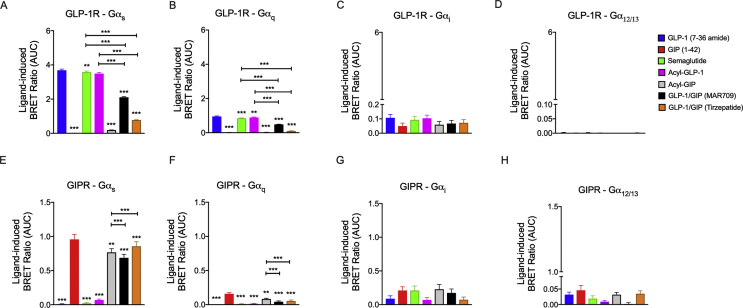
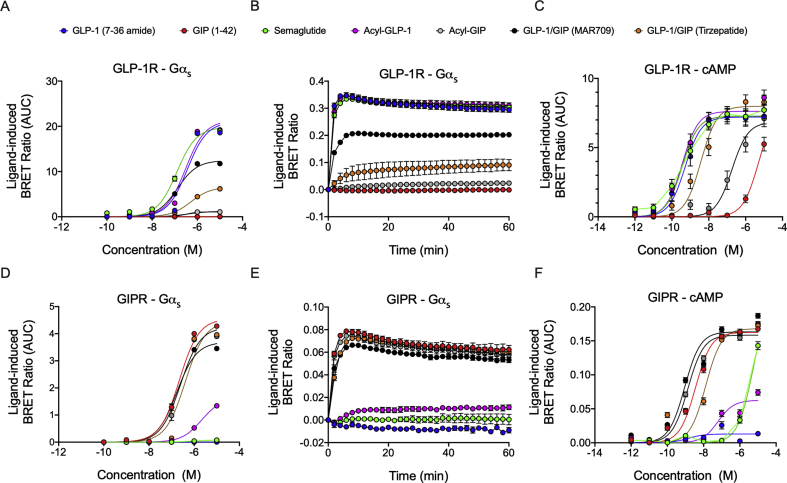
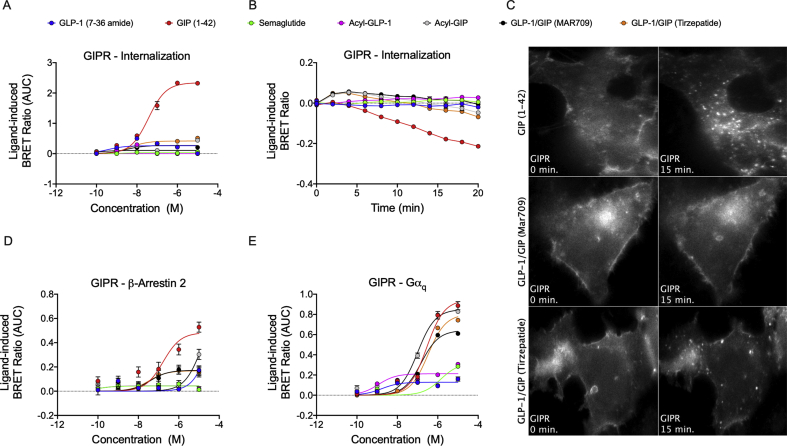
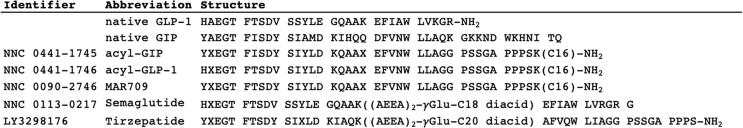
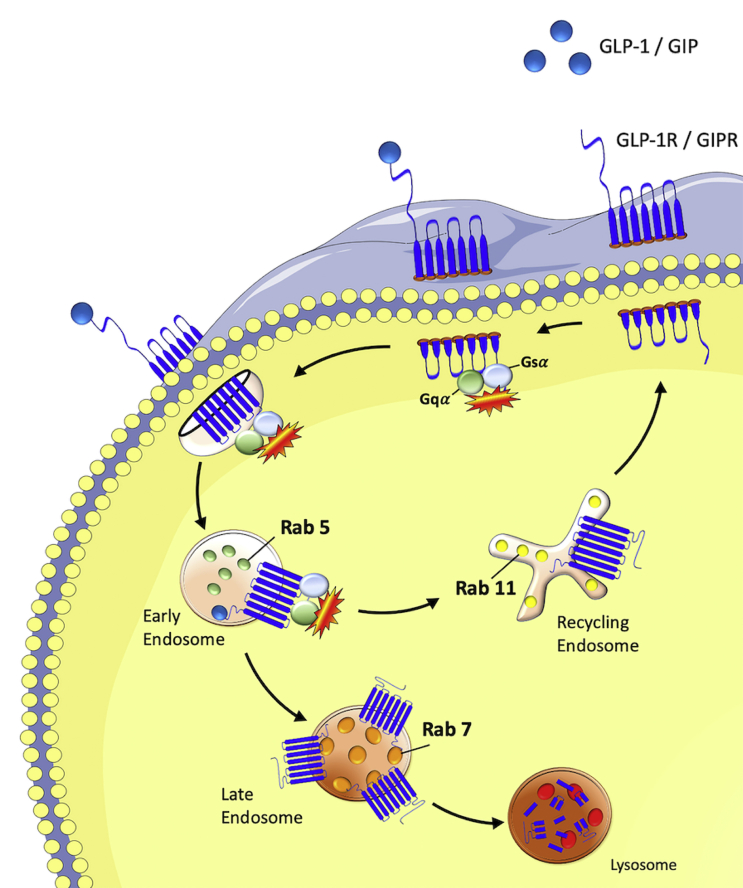
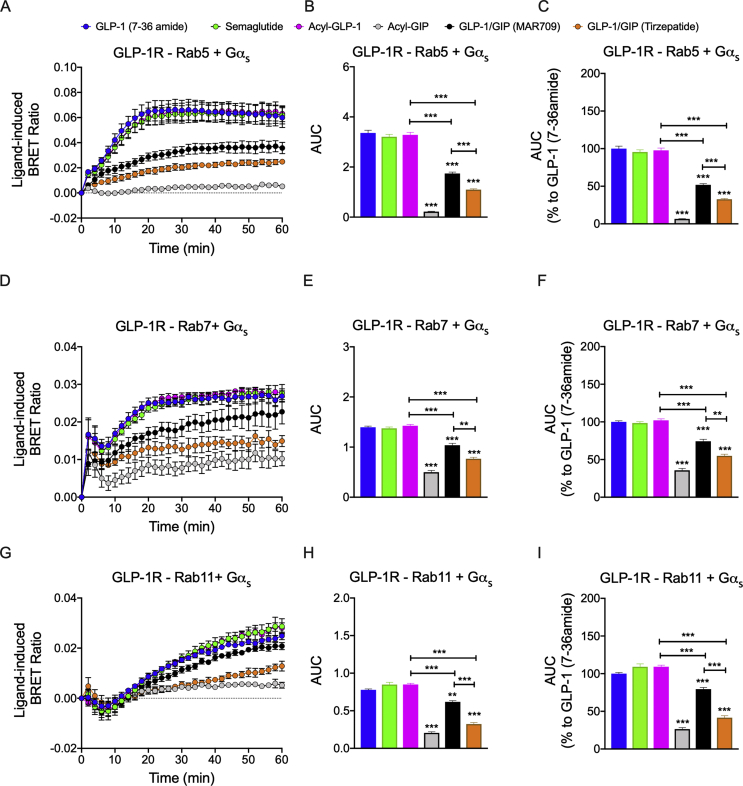
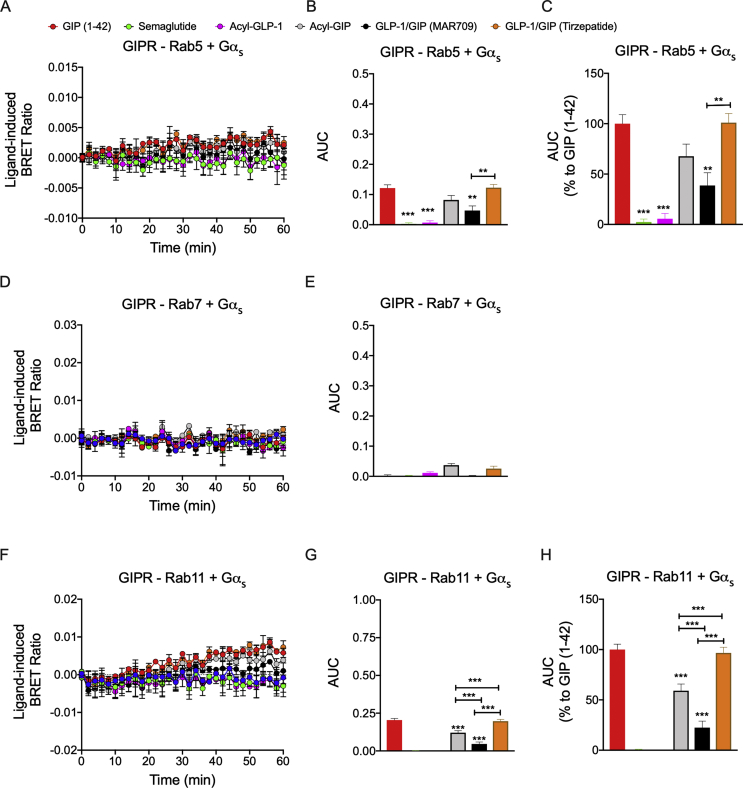
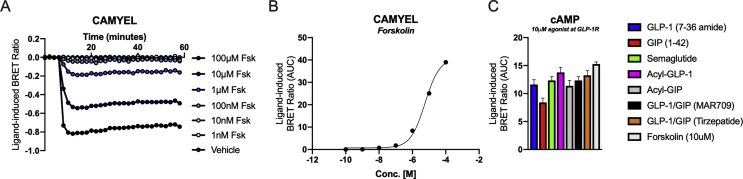
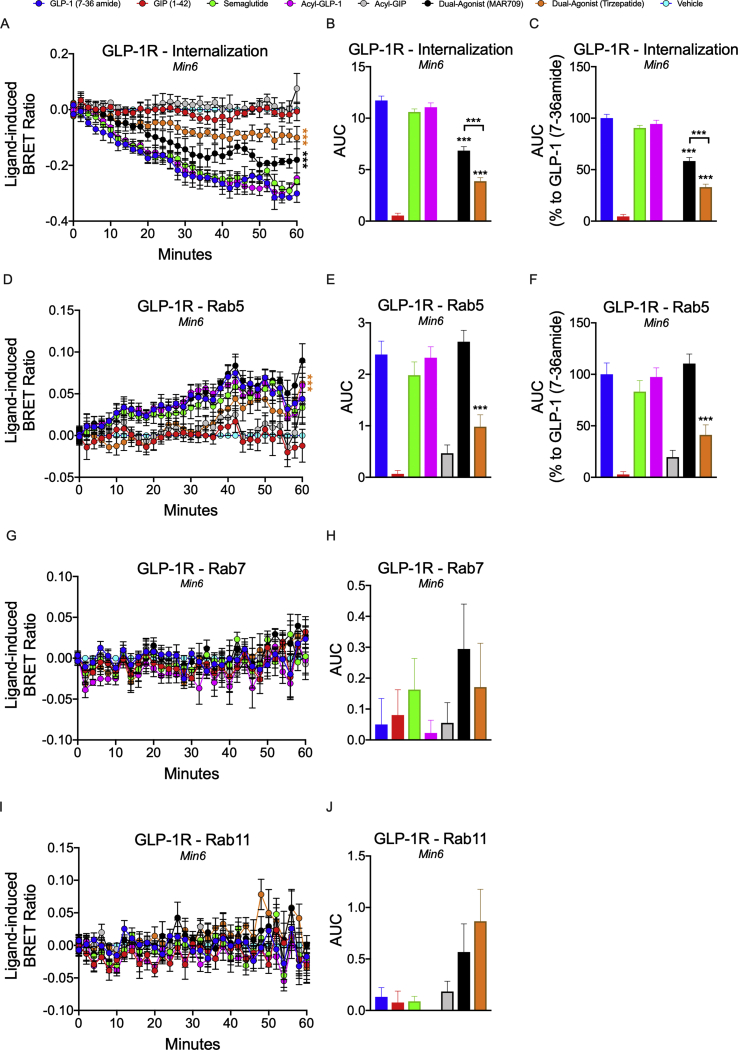
Objective: We assessed the spatiotemporal GLP-1 and GIP receptor signaling, trafficking, and recycling dynamics of GIPR mono-agonists, GLP-1R mono-agonists including semaglutide, and GLP-1/GIP dual-agonists MAR709 and tirzepatide.

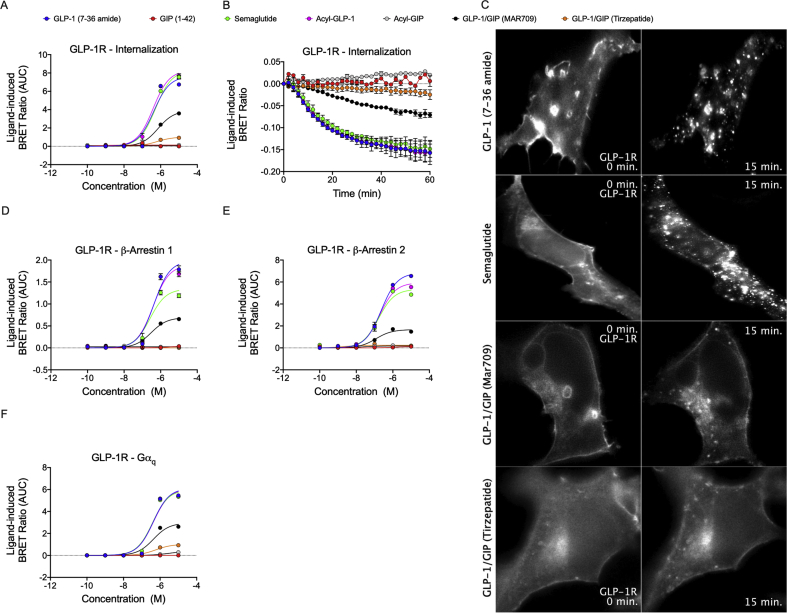
Methods: Receptor G protein recruitment and internalization/trafficking dynamics were assessed using bioluminescence resonance energy transfer (BRET)-based technology and live-cell HILO microscopy.

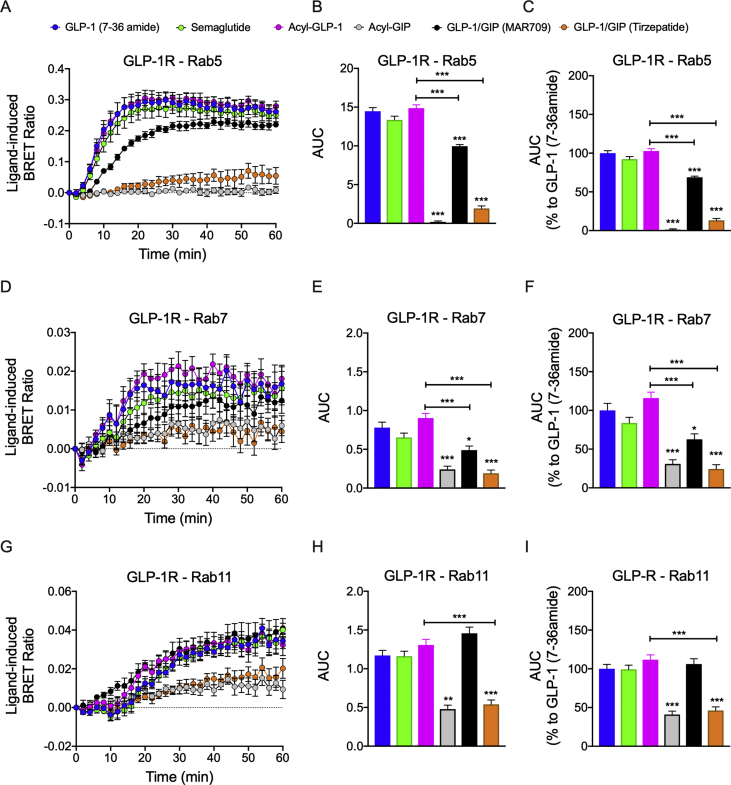
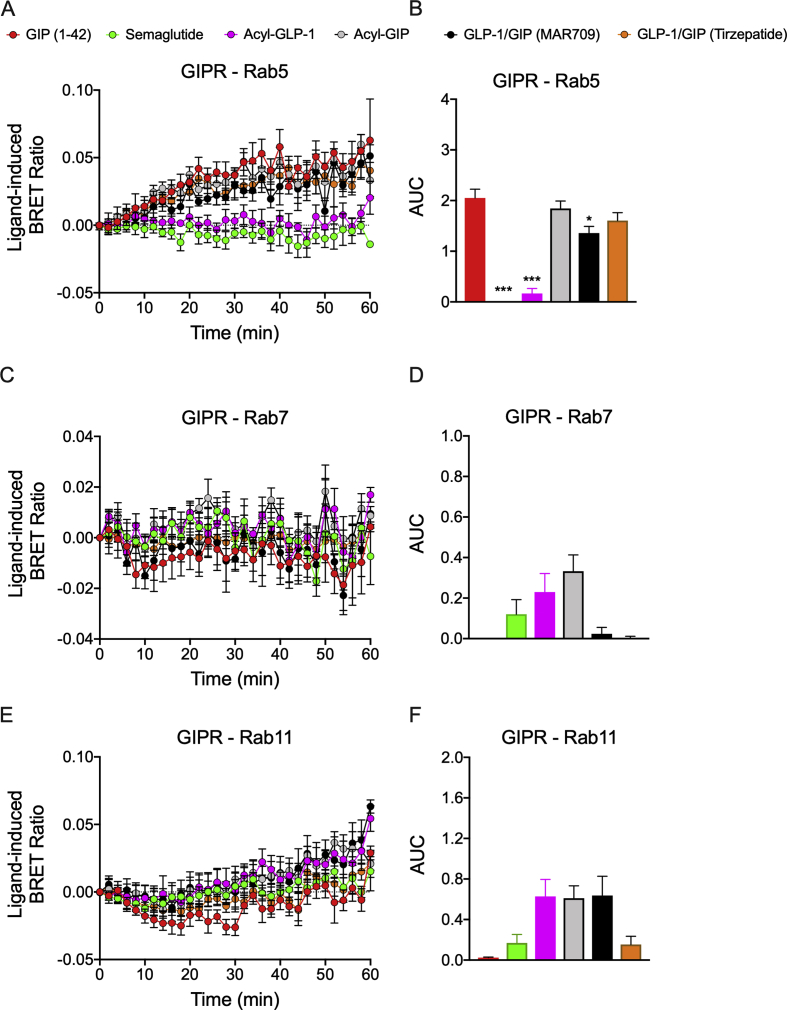
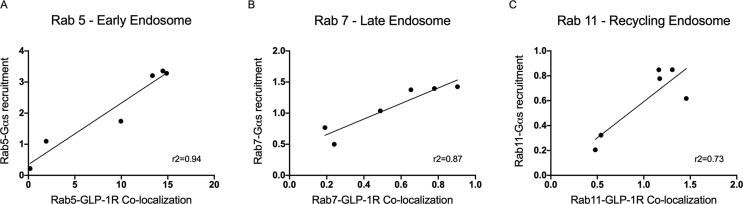
Results: Relative to native and acylated GLP-1 agonists, MAR709 and tirzepatide showed preserved maximal cAMP production despite partial Gαs recruitment paralleled by diminished ligand-induced receptor internalization at both target receptors. Despite MAR709's lower internalization rate, GLP-1R co-localization with Rab11-associated recycling endosomes was not different between MAR709 and GLP-1R specific mono-agonists.

Conclusions: Our data indicated that MAR709 and tirzepatide induce unique spatiotemporal GLP-1 and GIP receptor signaling, trafficking, and recycling dynamics relative to native peptides, semaglutide, and matched mono-agonist controls. These findings support the hypothesis that the structure of GLP-1/GIP dual-agonists confer a biased agonism that, in addition to its influence on intracellular signaling, uniquely modulates receptor trafficking.

Keywords: Biased agonism; Dual-agonists; GIPR; GLP-1R; Receptor Internalization; Receptor Trafficking.


Figures

Figure 1
Figure 1
Schematic and structure of the tested GLP-1R and GIPR ligands. GLP-1R mono-agonists comprised of human GLP-1 (7–36 amide), semaglutide, and fatty acyl-GLP-1 (a pharmacokinetically-matched His1 and Val10 mutant of MAR709) (left panel). GIPR mono-agonists include human GIP (1–42) and fatty acyl-GIP (a pharmacokinetically matched Ile7 mutant of MAR709) (middle panel). GLP-1/GIP dual-agonist MAR709 and tirzepatide (right panel).
Figure 2
Figure 2
Ligand-induced G protein recruitment at GLP-1R and GIPR. Ligand-induced (1 μM) recruitment of Nluc-tagged Gαs(A), Gαq(B), Gαi(C), and Gα12/13(D) to GFP-tagged GLP-1R in HEK293T cells. Ligand-induced (1 μM) recruitment of Nluc-tagged Gαs(E), Gαq(F),i(G), and Gα12/13(H) with GFP-tagged GIPR+ HEK293T cells. The positive iAUC (+iAUC) representation of vehicle and baseline-corrected 30 min response to each agonist is expressed as mean ± SEM. Bonferroni's test, ∗p < 0.05, ∗∗p < 0.005, and ∗∗∗p < 0.0005 using one-way ANOVA vs GLP-1 (7–36 amide) or GIP (1–42). Three independent experiments were performed with at least two technical replicates per group.
Figure 3
Figure 3
Dose-dependent effects of ligands on Gαsrecruitment and cAMP production. Dose–response curves (A) and temporal resolution (1 μM stimulation) (B) of ligand-induced BRET changes between Nluc-tagged Gαs recruitment to GFP-tagged GLP-1R. Dose–response curves of ligand-induced cAMP production GLP-1R+ HEK293T cells (C). Dose–response curves (D) and temporal resolution (1 μM stimulation) (E) of ligand-induced Gαs recruitment to the GIPR. Dose–response curves of ligand-induced cAMP production GIPR+ HEK293T cells (F). +iAUC representation of vehicle and baseline-corrected 60 min (Gαs recruitment) or 25 min (cAMP generation) temporal responses to each agonist is expressed as mean ± SEM. Three independent experiments were performed with at least two technical replicates per group.
Figure 4
Figure 4
Ligand-induced GLP-1R internalization. Dose–response curves (A) and temporal resolution (1 μM stimulation) (B) of ligand-induced hGLP-1-Rluc8 internalization as measured by loss of BRET with plasma membrane marker Venus-KRAS. Live HILO imaging of GLP-1R-GFP internalization in HEK293T cells at baseline and approximately 15 min after drug (1 μM) treatment (representative image from n = 4 experiments) (C). Dose–response curves for β-arrestin 1-Rluc8 (D), β-arrestin 2-Rluc8 (E), and Gαq-Nluc recruitment (F) to GLP-1R-GFP. The + iAUC representation of vehicle and baseline-corrected 60 min (GLP-1R internalization and Gαq recruitment) or 30 min (β-arrestin1/2 recruitment) temporal response to each agonist is expressed as mean ± SEM. Three independent experiments were performed with at least two technical replicates per group.
Figure 5
Figure 5
Ligand-induced GIPR internalization. Dose–response curves (A) and temporal resolution (1 μM stimulation) (B) of ligand-induced hGIPR-Rluc8 internalization. Live HILO imaging of GIPR-GFP internalization in HEK293T cells at baseline and approximately 15 min after drug (1 μM) treatment (C). Dose–response curves for β-arrestin 2-Rluc8 (D) and Gαq-Nluc recruitment (E). The + iAUC representation of vehicle and baseline-corrected 20 min (GIPR internalization), 30 min (β-arrestin1/2 recruitment), or 60 min (Gαq recruitment) temporal response to each agonist is expressed as mean ± SEM. Three independent experiments were performed with at least two technical replicates per group.
Figure 6
Figure 6
Ligand-induced GLP-1R endosomal trafficking. Ligand-induced co-localization of GLP-1R-Rluc8 with Venus-Rab5 early endosomes (AC), Venus-Rab7 late endosomes (DF), and Venus-Rab11 recycling endosomes (GI). The + iAUC representation of vehicle and baseline-corrected temporal response to each agonist is expressed as mean ± SEM. Bonferroni's test, ∗p < 0.05, ∗∗p < 0.005, and ∗∗∗p < 0.0005 using one-way ANOVA vs GLP-1 (7–36 amide). Six independent experiments were performed with at least two technical replicates per group.
Figure 7
Figure 7
Ligand-induced GIPR endosomal trafficking. Ligand-induced co-localization of GIPR with Venus-Rab5+ early endosomes (A and B), Venus-Rab7+ late endosomes (C and D), and Venus-Rab11+ recycling endosomes (E and F). The + iAUC representation of vehicle and baseline-corrected temporal response to each agonist is expressed as mean ± SEM. Bonferroni's test, ∗p < 0.05, ∗∗p < 0.005, and ∗∗∗p < 0.0005 using one-way ANOVA vs GIP (1–42). Six independent experiments were performed with at least two technical replicates per group.
Supplementary Table 1
Structure and identifiers of GLP-1 and GIP mono- and dual-agonists. Amino acid sequence, in-paper abbreviations, and external identifiers of the GLP-1 and GIP-derived compounds used.
Supplementary Figure 1
Schematic of the endosomal marker associated with GLP-1R/GIPR internalization and trafficking. Markers indicative of endosomal trafficking include Rab5 (early endosome), Rab7 (late endosome), and Rab11 (recycling endosome).
Supplementary Figure 2
Co-localization of GLP-1R with Gαsand Rab5, Rab7, or Rab11 in GLP-1R+HEK293T cells. Ligand-induced HEK293T GLP-1R-mediated proximal co-localization of Nluc-tagged Gαs with Venus-tagged Rab5 (A-C), Gαs and Rab7 (D-F), or Gαs and Rab11 (G-I) over 60 min. The +iAUC representation of vehicle and baseline-corrected temporal response to each agonist expressed as mean ± SEM. Bonferroni’s test, ∗p < 0.05, ∗∗p < 0.005, and ∗∗∗p < 0.0005 using one-way ANOVA vs GLP-1 (7-36 amide). Three independent experiments were performed with at least two technical replicates per group.
Supplementary Figure 3
Co-localization of GIPR with Gαsand Rab5, Rab7, or Rab11 in GIPR+HEK293T cells. Ligand-induced HEK293T GIPR-mediated proximal co-localization of Nluc-tagged Gαs and Venus-Rab5 (A-C), Gαs and Rab7 (D and E), or Gαs and Rab11 (F-H) over 60 min. The +iAUC representation of vehicle and baseline-corrected temporal response to each agonist is expressed as mean ± SEM. Bonferroni’s test, ∗p < 0.05, ∗∗p < 0.005, and ∗∗∗p < 0.0005 using one-way ANOVA vs GIP (1-42). Three independent experiments were performed with at least two technical replicates per group.
Supplementary Figure 4
CAMYEL cAMP sensor evidenced lack of saturation at 10 μM of GLP-1R agonist. Time course (A) and fitted dose-response curve (B) of cAMP-positive control forskolin as measured by the intracellular sensor CAMYEL in HEK293T cells. Stimulation with 10 μM of agonist or forskolin in GLP-1R+ HEK293T cells (C). The +iAUC representation of vehicle and baseline-corrected temporal response to each agonist is expressed as mean ± SE. Three independent experiments were performed with at least two technical replicates per group.
Supplementary Figure 5
GLP-1R internalization and Rab5 co-localization was differentially effected by the dual-agonists (1μM) in Min6 cells. Agonist-induced internalization of hGLP-1R-Rluc8 in Min6 cells for 60 min (A). Agonist-induced hGLP-1R-Rluc8 co-localization with Venus-Rab5+ (B), Venus-Rab7+ (C), and Venus-Rab11+ (D) endosomes in Min6 cells for 60 min. Temporal response for each agonist is expressed as mean ± SE. Tukey's test, ∗p < 0.05, ∗∗p < 0.005, and ∗∗∗p < 0.0005 using one-way ANOVA vs GLP-1 (7-36 amide). Six independent experiments were performed with at least two technical replicates per group.
Supplementary Figure 6
Degree of Rab-specific GLP-1R co-localization was positively associated with the degree of GLP-1R-mediated endosomal Gαs recruitment in HEK293T cells. Linear regression between Gαs recruitment and GLP-1R co-localization at the Rab5- (A), Rab7- (B), and Rab11-positive (C) endosomal compartments.

References

    1. Muller T.D., Finan B., Bloom S.R., D'Alessio D., Drucker D.J., Flatt P.R. Glucagon-like peptide 1 (GLP-1) Molecular Metabolism. 2019;30:72–130. - PMC - PubMed
    1. Deacon C.F., Johnsen A.H., Holst J.J. Degradation of glucagon-like peptide-1 by human plasma in vitro yields an N-terminally truncated peptide that is a major endogenous metabolite in vivo. Journal of Clinical Endocrinology & Metabolism. 1995;80:952–957. - PubMed
    1. Kieffer T.J., McIntosh C.H., Pederson R.A. Degradation of glucose-dependent insulinotropic polypeptide and truncated glucagon-like peptide 1 in vitro and in vivo by dipeptidyl peptidase IV. Endocrinology. 1995;136:3585–3596. - PubMed
    1. Mentlein R., Gallwitz B., Schmidt W.E. Dipeptidyl-peptidase IV hydrolyses gastric inhibitory polypeptide, glucagon-like peptide-1 (7-36)amide, peptide histidine methionine and is responsible for their degradation in human serum. European Journal of Biochemistry. 1993;214:829–835. - PubMed
    1. De Meester I., Korom S., Van Damme J., Scharpe S. CD26, let it cut or cut it down. Immunology Today. 1999;20:367–375. - PubMed

Publication types

MeSH terms

LinkOut - more resources