Comparative Study
. 2021 Feb 4;22(4):1581.
doi: 10.3390/ijms22041581.

Comparison of Antiviral Activity of Gemcitabine with 2'-Fluoro-2'-Deoxycytidine and Combination Therapy with Remdesivir against SARS-CoV-2

Affiliations
Comparative Study

Comparison of Antiviral Activity of Gemcitabine with 2'-Fluoro-2'-Deoxycytidine and Combination Therapy with Remdesivir against SARS-CoV-2

Yejin Jang et al. Int J Mol Sci. .

Abstract

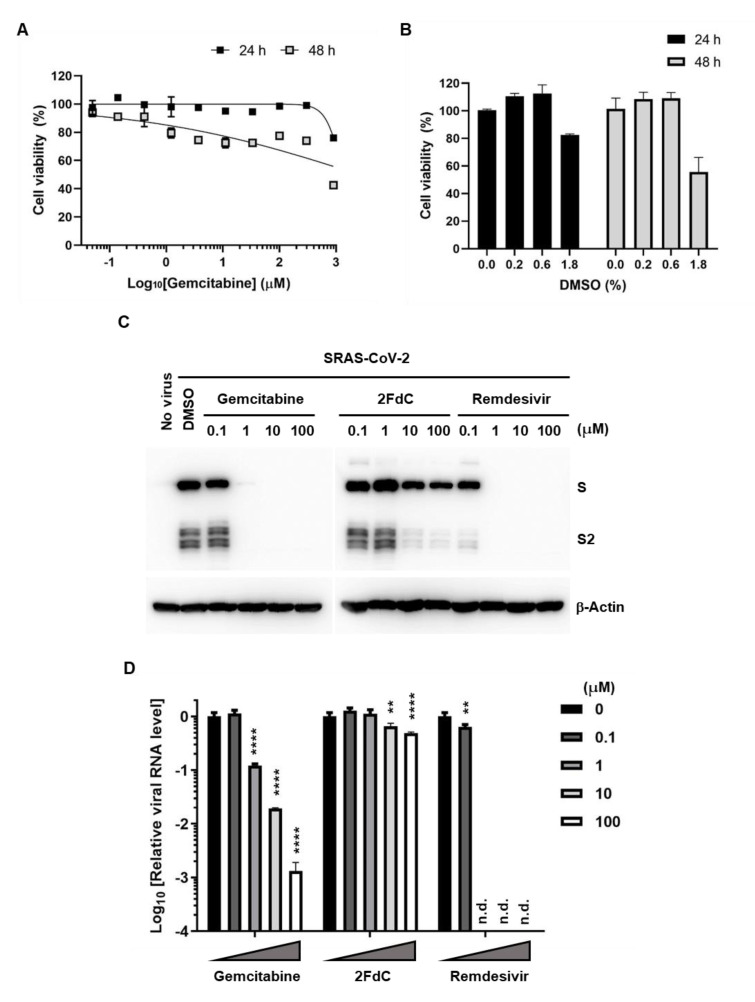
Severe acute respiratory syndrome coronavirus 2 (SARS-CoV-2) is the causative agent of the coronavirus disease 2019 (COVID-19) pandemic. The virus still spreads globally through human-to-human transmission. Nevertheless, there are no specific treatments clinically approved. This study aimed to compare antiviral activity of gemcitabine and its analogue 2'-fluoro-2'-deoxycytidine (2FdC) against SARS-CoV-2 as well as cytotoxicity in vitro. Fluorescent image-based antiviral assays revealed that gemcitabine was highly potent, with a 50% effective concentration (EC50) of 1.2 μM, more active than the well-known nucleoside monophosphate remdesivir (EC50 = 35.4 μM). In contrast, 2FdC was marginally active (EC50 = 175.2 μM). For all three compounds, the 50% cytotoxic concentration (CC50) values were over 300 μM toward Vero CCL-81 cells. Western blot and quantitative reverse-transcription polymerase chain reaction analyses verified that gemcitabine blocked viral protein expression in virus-infected cells, not only Vero CCL-81 cells but also Calu-3 human lung epithelial cells in a dose-dependent manner. It was found that gemcitabine has a synergistic effect when combined with remdesivir. This report suggests that the difluoro group of gemcitabine is critical for the antiviral activity and that its combination with other evaluated antiviral drugs, such as remdesivir, could be a desirable option to treat SARS-CoV-2 infection.

Keywords: 2′-fluoro-2′-deoxycytidine; SARS-CoV-2; antiviral activity; gemcitabine.


Conflict of interest statement

The authors declare no conflict of interest.

Figures

Figure 1
Figure 1
Chemical structures of the compounds tested and visualization of SARS-CoV-2-infected Vero cells. (A) Chemical structures of gemcitabine, 2FdC, and remdesivir. (B) MTT-based cytotoxicity assay of gemcitabine at different concentrations and time points. Vero cells were treated with increasing concentrations of gemcitabine for 24 h (black square) or 48 h (gray square). Percentage cell viability was measured by using MTT, in which mock-treated cells served as a control (100%). (C) Fluorescein diacetate-based cytotoxicity assay of gemcitabine. Vero cells were treated with increasing concentrations of gemcitabine for 24 (black square) and 48 h (gray square). Percentage cell viability was measured by addition of fluorescein diacetate, in which mock-treated cells served as a control (100%). (D) Fluorescein diacetate-based cytotoxicity assay of a delivery vehicle. Increasing concentrations of DMSO, 0.2, 0.6 and 1.8% (v/v), that were identically included in 100, 300 and 900 μM gemcitabine shown in (C), were treated to Vero cells for 24 (black bar) and 48 h (gray bar). Values in (BD) are means ± standard deviations from thee three independent experiments. (E) Visualization of SARS-CoV-2 infection. Vero cells were mock-infected (Mock) or infected with SARS-CoV-2 at a multiplicity of infection (MOI) of 0.02 for 24 h. Viral spike (S) protein was probed with mouse anti-S antibody and Alexa Fluor 488-conjugated goat anti-mouse antibody (green). Cellular nuclei were counterstained with DAPI (blue). Magnification ×20.
Figure 2
Figure 2
Evaluation of the antiviral activity of gemcitabine, 2FdC, and remdesivir against SARS-CoV-2 in a fluorescence image-based antiviral assay system. (A) Visualization of decrease in viral S protein level in the presence of the antiviral compounds. Vero cells were treated with 3-fold serial dilutions of each compound (300 to 0.02 μM over 10 concentrations) for 30 min. Cells were infected with SARS-CoV-2 at an MOI of 0.02. At 24 h post-infection, viral S protein (green) and nuclei (blue) were visualized by fluorescence microscopy. Representative images are shown from eight images per sample at compound concentrations of 1.2, 11.1, and 100.0 μM. Magnification ×20. (B) Antiviral activity (left y-axis, red circles) and cell viability (right y-axis, black squares) at increasing concentrations of gemcitabine (left panel), 2FdC (middle panel), and remdesivir (right panel). Percentage means and standard deviations are calculated from four different spots per sample in triplicate. EC50 and CC50 values were determined from a nonlinear regression equation and are shown below each panel. Selectivity index (SI), ratio of CC50 to EC50.
Figure 3
Figure 3
Reduction of viral S protein and viral RNA levels in Vero cells by gemcitabine. (A) Western blot analysis probing the S protein. Vero cells in 6-well plates were mock-infected (No virus) or infected with SARS-CoV-2 at an MOI of 0.001 for 1 h at 37 °C. Cells were treated with 10-fold increasing concentrations of gemcitabine, 2FdC, or remdesivir or with a delivery vehicle (0.2% DMSO) for 24 h. Cell lysates were harvested and subjected to 10% SDS-PAGE by loading 30 μg total protein per well. Full-length S and its cleaved product S2 were visualized using an S-specific antibody (upper panel), with β-actin serving as a loading control (lower panel). Both proteins are labeled on the right side of the gels. (B) Real-time RT-PCR was performed using culture supernatants from the same samples used for western blot analysis in (A). Viral RNA was amplified using an one-step RT-PCR kit targeting the N gene. The RNA titer from virus-infected, 0.2% DMSO-treated sample was used as a mock control, being set as 1. Changes in viral RNA level are depicted using a log scale from cycle threshold (Ct) values. Values are means ± standard deviations from thee three independent experiments. Multiple comparisons were performed between each test group and the control group by two-way analysis of variance (ANOVA). **** p < 0.0001.
Figure 4
Figure 4
Time-of-addition experiment of gemcitabine. (A) Schematic presentation of the time course of viral infection and the compound treatment. (B) Quantitative RT-PCR for detecting the SARS-CoV-2 N gene. Vero cells seeded in 24 wells were infected with SARS-CoV-2 at an MOI of 0.01 for 3 h, followed by washing with PBS. In parallel, 10 μM of gemcitabine (gray bars) or remdesivir (black bars) as a control was added at 3-h intervals starting from 3 h before viral infection. At 20 h post-infection, their culture supernatants were harvested for viral RNA preparation and real-time RT-PCR. RNA quantities were calculated relative to the amount from virus-infected, mock compound-treated cells, which was arbitrarily set as 100%. Data represent means and standard deviations from three independent experiments. n.d., not detected.
Figure 5
Figure 5
Competition assay between gemcitabine and each rNTP. (A) Real-time RT-PCR for measuring viral RNA amounts. Vero cells seeded in 6-well plates were infected with SARS-CoV-2 at an MOI of 0.001 and then treated with increasing concentrations of one of rNTPs including rATP, rUTP, rGTP and rCTP (1, 10, and 100 μM) in the absence (white bars) or presence of gemcitabine (1 μM; black bars) for 24 h. Culture supernatants were harvested for RT-PCR with primers specific for the viral N gene. Infected cells mock-treated or treated with gemcitabine only were used as positive (100%) and negative controls, respectively. Data represent means and standard deviations from three independent experiments. Multiple comparisons were performed between each test group and the rNTP-untreated controls by two-way ANOVA. * p < 0.05; ** p < 0.01; *** p < 0.001; **** p < 0.0001. (B) Western blot analysis for visualization of viral S protein. The cell lysates prepared for (A) with 100 μM rNPTs in the absence (−) or presence of 1 μM gemcitabine (+) were harvested for immunoblotting with anti-S antibody by using β-actin as a loading control. ‘No virus’ means a naive sample without SARS-CoV-2 infection.
Figure 6
Figure 6
Reduction of viral S protein and viral RNA levels in Calu-3 cells by gemcitabine. (A) Cytotoxicity of gemcitabine to Calu-3 cells. Cells were treated with increasing concentrations of gemcitabine for 24 (black square) and 48 h (gray square). Percentage cell viability was measured by MTT assay, in which mock-treated cells served as a control (100%). (B) Effect of DMSO on cell viability. Increasing concentrations of DMSO, 0.2, 0.6 and 1.8% (v/v), that were identically included in 100, 300 and 900 μM gemcitabine shown in (A), were treated to Calu-3 cells for 24 (black bars) and 48 h (gray bars) for cell viability assay. Values are means ± standard deviations from thee three independent experiments in (A,B). (C) Western blot of the S protein. Calu-3 cells in 6-well plates were mock-infected (No virus) or infected with SARS-CoV-2 at an MOI of 0.002 for 1 h at 37 °C. Cells were treated with 10-fold increasing concentrations of gemcitabine, 2FdC, or remdesivir or with 0.2% DMSO. On the next day, cell lysates were subjected to 10% SDS-PAGE and immunoblotting. Full-length S and its cleaved product S2 were visualized using an S-specific antibody (upper panel), with β-actin serving as a loading control (lower panel). (D) Real-time RT-PCR was performed using culture supernatants from the same samples used in (A) by targeting the viral N gene. The RNA titer from virus-infected samples but not treated with any antiviral compound (DMSO) was used as a mock control. Changes in viral RNA level are depicted using a log scale. Values are means ± standard deviations from thee three independent experiments. Multiple comparisons were performed between each test group and the mock control group by two-way analysis of variance (ANOVA). ** p < 0.01; **** p < 0.0001. n.d., not detected.
Figure 7
Figure 7
Synergistic effect of gemcitabine with remdesivir. (A) Isobologram showing the synergistic interaction between gemcitabine and remdesivir for inhibition of SARS-CoV-2 infection in Vero cells. It was plotted using the relative FIC50 values of gemcitabine on the horizontal axis and the values of remdesivir on the vertical axis. (B) The sums of both FIC50 values (ΣFIC50s) at the combination ratios of gemcitabine to remdesivir, 4:1, 3:2, 2:3 and 1:4, and their mean values were quantified. (C) Isobologram of the interaction between 2FdC and remdesivir against SARS-CoV-2 in Vero cells. (D) The sums of both FIC50 values (ΣFIC50s) at the fixed combination ratios of 2FdC to remdesivir, 4:1, 3:2, 2:3 and 1:4, and their mean value were quantified. Values are means ± standard deviations from thee three independent experiments. ** p < 0.01.

References

    1. Maters P.S., Perlman S. Coronaviridae. In: Knife D.M., Howley P.M., editors. Fields Virology. Volume 2. Lippincott Williams and Wilkins; Philadelphia, PA, USA: 2013. pp. 825–858.
    1. Song Z., Xu Y., Bao L., Zhang L., Yu P., Qu Y., Zhu H., Zhao W., Han Y., Qin C. From SARS to MERS, Thrusting Coronaviruses into the Spotlight. Viruses. 2019;11:50. doi: 10.3390/v11010059. - DOI - PMC - PubMed
    1. Wu A., Peng Y., Huang B., Ding X., Wang X., Niu P., Meng J., Zhu Z., Zhang Z., Wang J., et al. Genome Composition and Divergence of the Novel Coronavirus (2019-nCoV) Originating in China. Cell Host Microbe. 2020;27:325–328. doi: 10.1016/j.chom.2020.02.001. - DOI - PMC - PubMed
    1. Wang D., Hu B., Hu C., Zhu F., Liu X., Zhang J., Wang B., Xiang H., Cheng Z., Xiong Y., et al. Clinical Characteristics of 138 Hospitalized Patients With 2019 Novel Coronavirus-Infected Pneumonia in Wuhan, China. JAMA. 2020;323:1061–1069. doi: 10.1001/jama.2020.1585. - DOI - PMC - PubMed
    1. Zhu N., Zhang D., Wang W., Li X., Yang B., Song J., Zhao X., Huang B., Shi W., Lu R., et al. A Novel Coronavirus from Patients with Pneumonia in China, 2019. N. Engl. J. Med. 2020;382:727–733. doi: 10.1056/NEJMoa2001017. - DOI - PMC - PubMed

Publication types

MeSH terms