. 2021 Feb 8;20(1):30.
doi: 10.1186/s12943-021-01326-6.

Selective treatment pressure in colon cancer drives the molecular profile of resistant circulating tumor cell clones

Affiliations

Selective treatment pressure in colon cancer drives the molecular profile of resistant circulating tumor cell clones

Laure Cayrefourcq et al. Mol Cancer. .

Abstract

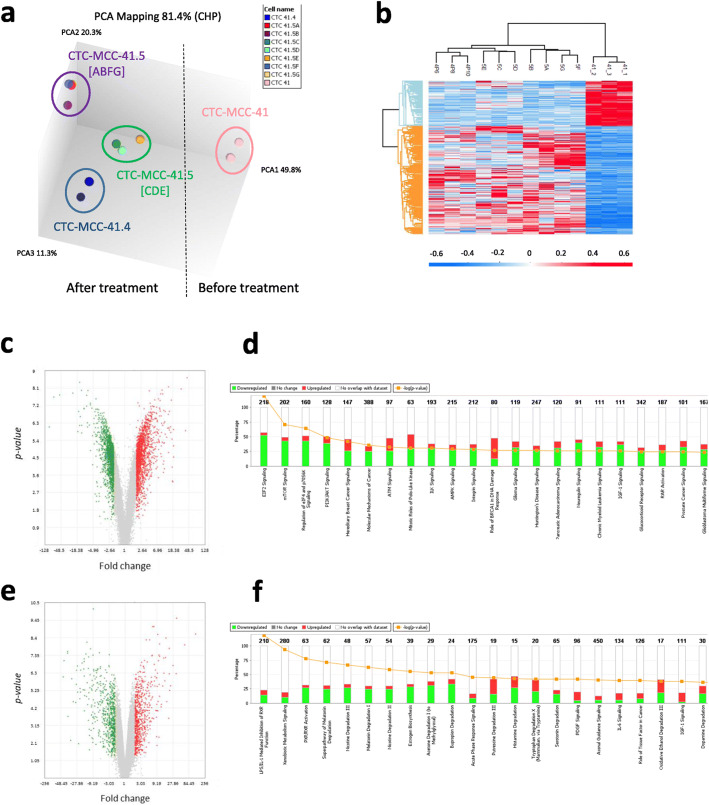
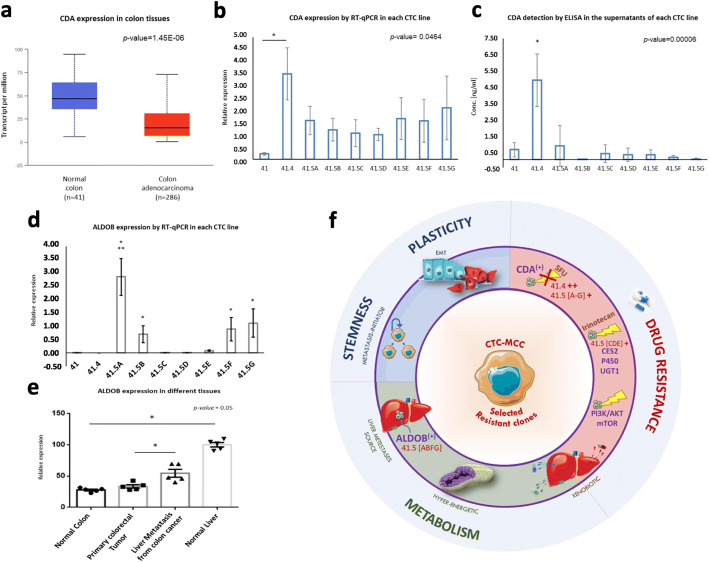
The characterization of circulating tumor cells (CTCs) holds promises for precision medicine because these cells are an important clinical indicator of treatment efficacy. We established the first and still only nine permanent colon CTC lines from peripheral blood samples of a patient with metastatic colon cancer collected at different time points during treatment and cancer progression. The study objectives were (i) to compare the gene expression profiles of these CTC lines, and (ii) to determine the main features acquired during treatment. The number of upregulated genes was higher in the CTC lines obtained after treatment, indicating that they acquired properties to escape treatment pressure. Among these upregulated genes, some are involved in the mTOR and PI3K/AKT signaling pathways. Moreover, cytidine deaminase expression was significantly increased in the CTC lines obtained after failure of the first- and second-line 5-fluorouracile-based treatments, suggesting that these CTCs can eliminate this specific drug and resist to therapy. Several enzymes involved in xenobiotic metabolism also were upregulated after treatment, suggesting the activation of detoxification mechanisms in response to chemotherapy. Finally, the significant higher expression of aldolase B in four of the six CTC lines obtained after treatment withdrawal and cancer progression indicated that these clones originated from liver metastases. In conclusion, these CTC lines generated at different time points during treatment of metastatic colon cancer in a single patient are characterized by the deregulation of different genes that promote (i) drug resistance, (ii) xenobiotic and energy metabolism, and (iii) stem cell properties and plasticity.

Trial registration: ClinicalTrials.gov NCT01596790.

Keywords: ALDOB; CDA; Circulating tumor cells; Clonal evolution; Colon cancer; Gene expression.


Conflict of interest statement

CAP declare to have had an honorarium from Menarini. The other authors declare that they have no competing interests.

Figures

Fig. 1
Fig. 1
Transcriptomic analysis of the nine CTC lines obtained from a patient with metastatic colon cancer at different times during disease progression. a Unsupervised 3D PCA representing the gene expression patterns of the CTC line obtained before treatment (n = 3 samples) and the eight CTC lines obtained after treatment initiation (n = 10 samples); b Hierarchical clustering of the CTC lines based on the differentially expressed transcripts (DETs) in CTC-MCC-41 (before treatment) and the other eight lines. The color intensity indicates the transcript expression level (red for upregulated transcripts and blue for downregulated transcripts); c Volcano plots showing the distribution of gene expression fold changes and p-values using the TAC software. Transcripts upregulated in CTC-MCC-41 are indicated in green, and transcripts upregulated in the other eight CTC lines are in red. d Top enriched pathways for the DETs (ANOVA analysis), ranked in increasing order (Fisher’s exact test p-value) identified by Ingenuity® Pathway Analysis, by comparing CTC-MCC-41 (before treatment) and the other eight lines. The “EIF2 signaling”, “mTOR and “PI3K/AKT signaling” pathways were significantly deregulated. Red: genes upregulated in CTC-MCC-41 compared with the other eight CTC lines; green: genes upregulated in the eight post-treatment CTC lines; white: no overlap with the data set; Orange - log (p-value); e Volcano plots showing the distribution of gene expression fold changes and p-values using the TAC software, with transcripts upregulated in the CTC-MCC-41.5 [ABFG] subgroup (green) and in the CTC-MCC-41.5 [CDE] subgroup (red). f Top enriched pathways for the DETs based on the ANOVA analysis, ranked in increasing order (Fisher’s exact test p-values) identified by Ingenuity® Pathway Analysis, in the comparison of the seven CTC-MCC-41.5 lines obtained just before the patient’s death. Many “metabolism” pathways were significantly deregulated, including “xenobiotic metabolism signaling”. Abbreviations: TAC, Transcriptome Analysis Console; DET, differentially expressed transcripts
Fig. 2
Fig. 2
Major features of the aggressive colon cancer CTC clones selected after treatment. a Boxplot showing cytidine deaminase (CDA) relative expression in normal colon (n = 41) and colon adenocarcinoma (n = 286) samples using UALCAN (p-value = 1.45E-06). b RT-qPCR analysis of CDA gene expression in the nine CTC lines (mean values of triplicate experiments with standard deviation). c ELISA measurement of CDA protein level (ng/ml) in the conditioned medium from the nine CTC lines (mean values from triplicate experiments with standard deviation). Aldolase B (ALDOB) expression analysis (d) by RT-qPCR in the nine CTC lines [*significant upregulation in the CTC-MCC-41.5 [ABFG] cell lines compared with all the other CTC lines (p-value = 0.0134), and only with the CTC-MCC-41.5 [CDE] lines (p-value = 0.0466); **significantly upregulation compared with all the other CTC lines (p-value = 0.0017)], and e in tissue samples (normal colon, normal liver, primary colorectal tumor, liver metastases of colon cancer) (n = 5/tissue). f Representation of the cancer hallmarks of the CTC lines resistant to treatment: (i) Stemness and Plasticity: metastasis-competent potential, (ii) Drug resistance: different molecules and pathways involved in treatment resistance and drug detoxification, such as the CDA enzyme implicated in pyrimidine analogue metabolism (e.g. for 5-FU), (iii) Metabolism: xenobiotic metabolism linked to therapy resistance, energy metabolism linked to mitochondrial activity, and ALDOB activity that gave information also on the liver metastasis origin of the CTC41.5[ABFG] lines. Abbreviation: EMT, epithelial-mesenchymal transition

References

    1. Alix-Panabières C. The future of liquid biopsy. Nature. 2020;579(7800):S9. doi: 10.1038/d41586-020-00844-5. - DOI - PubMed
    1. Pantel K, Alix-Panabieres C. Liquid biopsy and minimal residual disease - latest advances and implications for cure. Nat Rev Clin Oncol. 2019;16(7):409–424. doi: 10.1038/s41571-019-0187-3. - DOI - PubMed
    1. Koch C, Kuske A, Joosse SA, Yigit G, Sflomos G, Thaler S, et al. Characterization of circulating breast cancer cells with tumorigenic and metastatic capacity. EMBO Mol Med. 2020;12(9):e11908. doi: 10.15252/emmm.201911908. - DOI - PMC - PubMed
    1. Cortés-Hernández LE, Eslami SZ, Alix-Panabières C. Circulating tumor cell as the functional aspect of liquid biopsy to understand the metastatic cascade in solid cancer. Mol Asp Med. 2020;72:100816. doi: 10.1016/j.mam.2019.07.008. - DOI - PubMed
    1. Cayrefourcq L, Mazard T, Joosse S, Solassol J, Ramos J, Assenat E, et al. Establishment and characterization of a cell line from human circulating colon cancer cells. Cancer Res. 2015;75(5):892–901. doi: 10.1158/0008-5472.CAN-14-2613. - DOI - PubMed

Publication types

MeSH terms

Substances

Associated data