. 2021 Feb 8;10(1):11.
doi: 10.1186/s40164-021-00198-2.

A global, regional, and national survey on burden and Quality of Care Index (QCI) of hematologic malignancies; global burden of disease systematic analysis 1990-2017

Affiliations

A global, regional, and national survey on burden and Quality of Care Index (QCI) of hematologic malignancies; global burden of disease systematic analysis 1990-2017

Mohammad Keykhaei et al. Exp Hematol Oncol. .

Abstract

Background: Hematologic malignancies (HMs) are a heterogeneous group of cancers that comprise diverse subgroups of neoplasms. So far, despite the major epidemiologic concerns about the quality of care, limited data are available for patients with HMs. Thus, we created a novel measure-Quality of Care Index (QCI)-to appraise the quality of care in different populations.

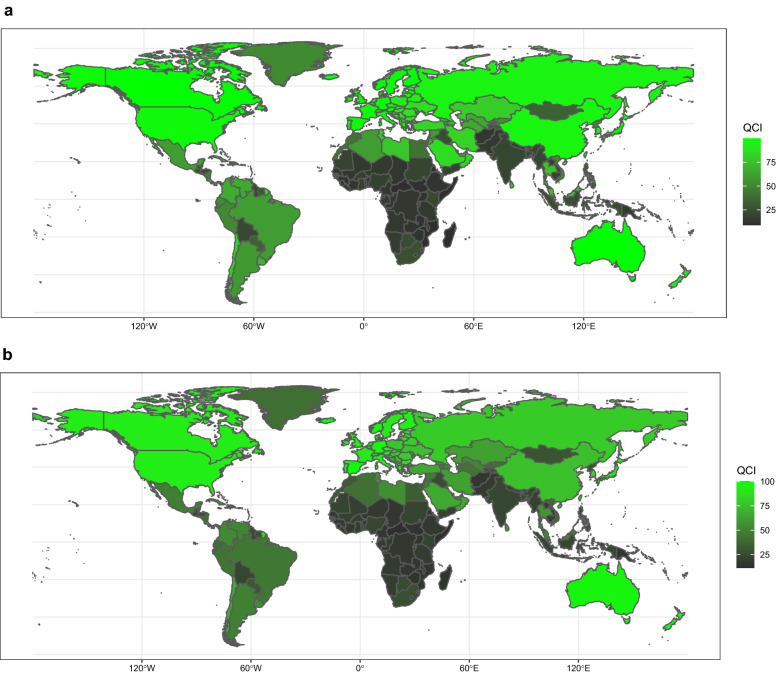
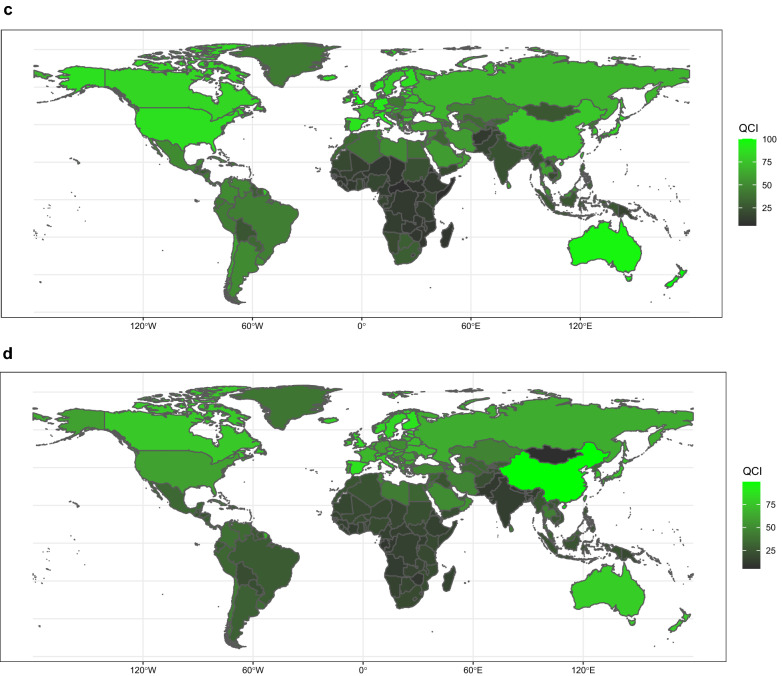
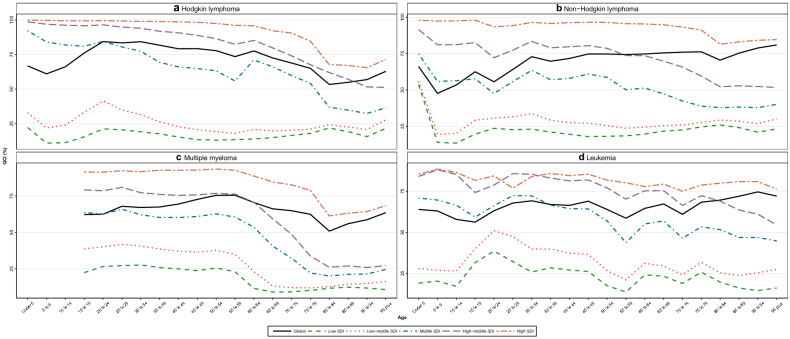
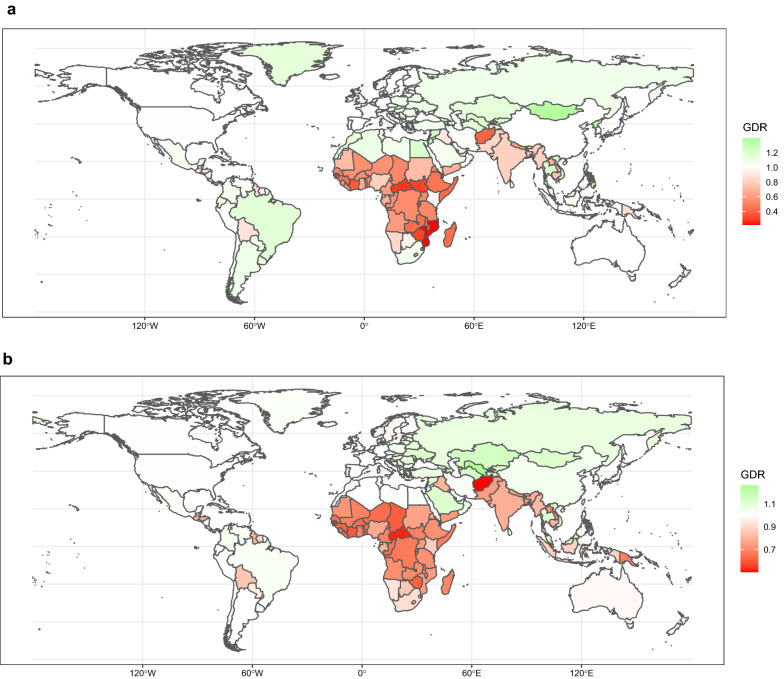
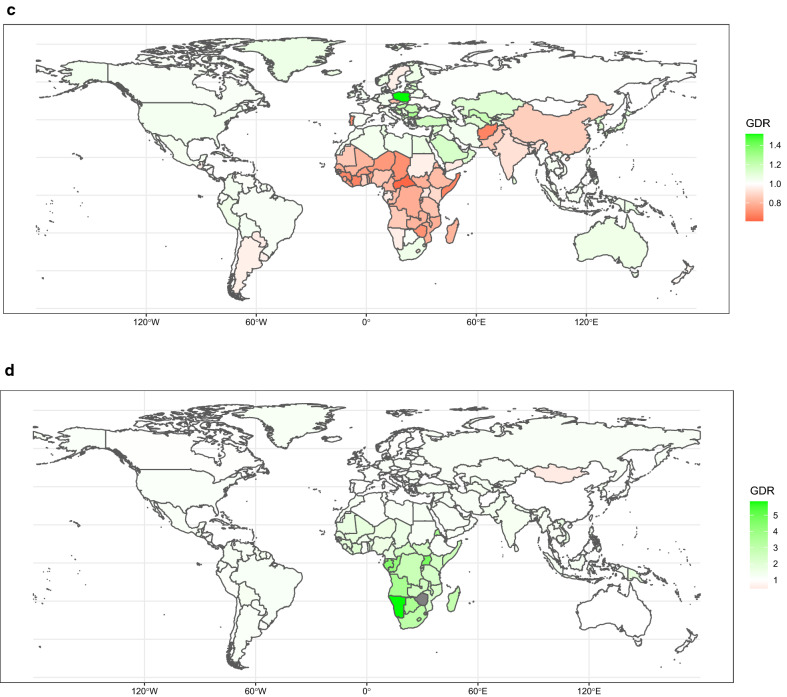
Methods: The Global Burden of Disease data from 1990 to 2017 applied in our study. We performed a principal component analysis on several secondary indices from the major primary indices, including incidence, prevalence, mortality, years of life lost, years lived with disability, and disability-adjusted life-years (DALYs) to create the QCI, which provides an overall score of 0-100 of the quality of cancer care. We estimated the QCI for each age group on different scales and constructed the gender disparity ratio to evaluate the gender disparity of care in HMs.

Results: Globally, while the overall age-standardized incidence rate of HMs increased from 1990 to 2017, the age-standardized DALYs and death rates decreased during the same period. Across countries, in 2017, Iceland (100), New Zealand (100), Australia (99.9), and China (99.3) had the highest QCI scores for non-Hodgkin lymphoma, multiple myeloma, Hodgkin lymphoma, and leukemia. Conversely, Central African Republic (11.5 and 6.1), Eritrea (9.6), and Mongolia (5.4) had the lowest QCI scores for the mentioned malignancies respectively. Overall, the QCI score was positively associated with higher sociodemographic of nations, and was negatively associated with age advancing.

Conclusions: The QCI provides a robust metric to evaluate the quality of care that empowers policymakers on their responsibility to allocate the resources effectively. We found that there is an association between development status and QCI and gender equity, indicating that instant policy attention is demanded to improve health-care access.

Keywords: Hematologic malignancies; Hodgkin lymphoma; Leukemia; Multiple myeloma; Non-hodgkin lymphoma; Quality of Care Index.


Conflict of interest statement

The authors declare that they have no competing interests.

Figures

Fig. 1
Fig. 1
Age-standardized map of QCI scores, HL (a), NHL (b), MM c), and leukemia (d), 2017. The QCI scores are illustrated on a scale of 0–100, so that higher scores represent better quality of care. Countries and territories are pictured by their QCI scores on a color-based scale where grey represents the lowest scores and green represents the highest scores. HL Hodgkin lymphoma, MM multiple myeloma, NHL non-Hodgkin lymphoma, QCI Quality of Care Index
Fig. 1
Fig. 1
Age-standardized map of QCI scores, HL (a), NHL (b), MM c), and leukemia (d), 2017. The QCI scores are illustrated on a scale of 0–100, so that higher scores represent better quality of care. Countries and territories are pictured by their QCI scores on a color-based scale where grey represents the lowest scores and green represents the highest scores. HL Hodgkin lymphoma, MM multiple myeloma, NHL non-Hodgkin lymphoma, QCI Quality of Care Index
Fig. 2
Fig. 2
Age trend of QCI, HL (a), NHL (b), MM (c), and leukemia (d), 2017. The QCI scores are illustrated on a scale of 0–100, with 0 being the worst scores and 100 being the best scores. This figure demonstrates estimates for both sexes combined. Each line represents the association between QCI score and age in different regions including SDI quintile regions and global region. HL Hodgkin lymphoma, MM multiple myeloma, NHL non-Hodgkin lymphoma, QCI Quality of Care Index, SDI Socio-demographic Index
Fig. 3
Fig. 3
Age-standardized map of GDR, HL (a), NHL (b), MM (c), and leukemia (d), 2017. The GDR is QCI score for females divided by QCI score for males, so that higher scores represent better care in females and lower scores represent better care in men. This figure illustrates the GDR in different countries and territories. Countries and territories are pictured by their GDR on a color-based scale where white represents the absence of disparity. GDR gender disparity ratio, HL Hodgkin lymphoma, MM multiple myeloma, NHL non-Hodgkin lymphoma, QCI Quality of Care Index
Fig. 3
Fig. 3
Age-standardized map of GDR, HL (a), NHL (b), MM (c), and leukemia (d), 2017. The GDR is QCI score for females divided by QCI score for males, so that higher scores represent better care in females and lower scores represent better care in men. This figure illustrates the GDR in different countries and territories. Countries and territories are pictured by their GDR on a color-based scale where white represents the absence of disparity. GDR gender disparity ratio, HL Hodgkin lymphoma, MM multiple myeloma, NHL non-Hodgkin lymphoma, QCI Quality of Care Index

References

    1. GBD 2017 DALYs and HALE Collaborators. Global, regional, and national disability-adjusted life-years (DALYs) for 359 diseases and injuries and healthy life expectancy (HALE) for 195 countries and territories, 1990–2017: a systematic analysis for the Global Burden of Disease Study 2017. Lancet. 2018;392(10159):1859–922. - PMC - PubMed
    1. WHO Classification of Tumours of Haematopoietic and Lymphoid Tissues: International Agency for Research on Cancer- World Health Organization. https://www.iarc.fr/news-events/who-classification-of-tumours-of-haemato....
    1. Rodriguez-Abreu D, Bordoni A, Zucca E. Epidemiology of hematological malignancies. Ann Oncol. 2007;18(Suppl 1):i3–i8. doi: 10.1093/annonc/mdl443. - DOI - PubMed
    1. Bray F, Ferlay J, Soerjomataram I, Siegel RL, Torre LA, Jemal A. Global cancer statistics 2018: GLOBOCAN estimates of incidence and mortality worldwide for 36 cancers in 185 countries. CA Cancer J Clin. 2018;68(6):394–424. doi: 10.3322/caac.21492. - DOI - PubMed
    1. Dong Y, Shi O, Zeng Q, Lu X, Wang W, Li Y, et al. Leukemia incidence trends at the global, regional, and national level between 1990 and 2017. Exp Hematol Oncol. 2020;9:14. doi: 10.1186/s40164-020-00170-6. - DOI - PMC - PubMed

LinkOut - more resources