. 2021 Feb 16;118(7):e2019789118.
doi: 10.1073/pnas.2019789118.

Placental genomic risk scores and early neurodevelopmental outcomes

Affiliations

Placental genomic risk scores and early neurodevelopmental outcomes

Gianluca Ursini et al. Proc Natl Acad Sci U S A. .

Abstract

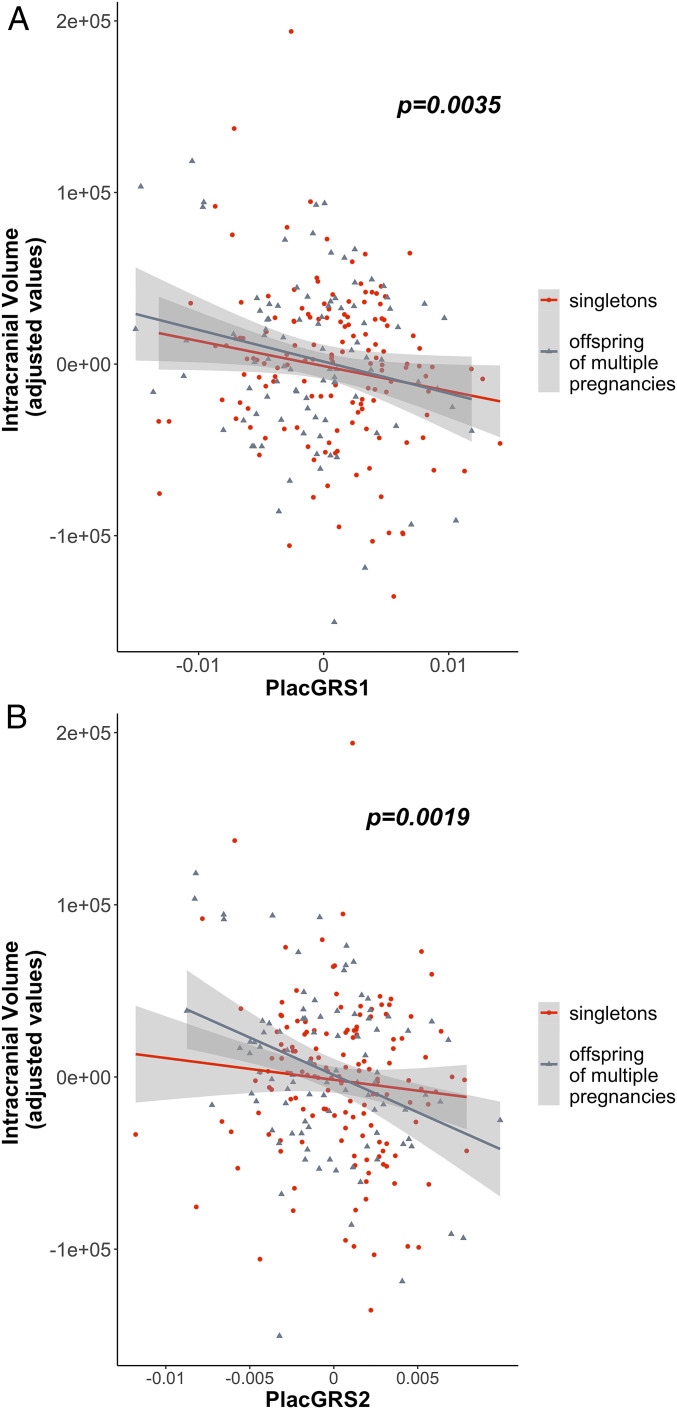
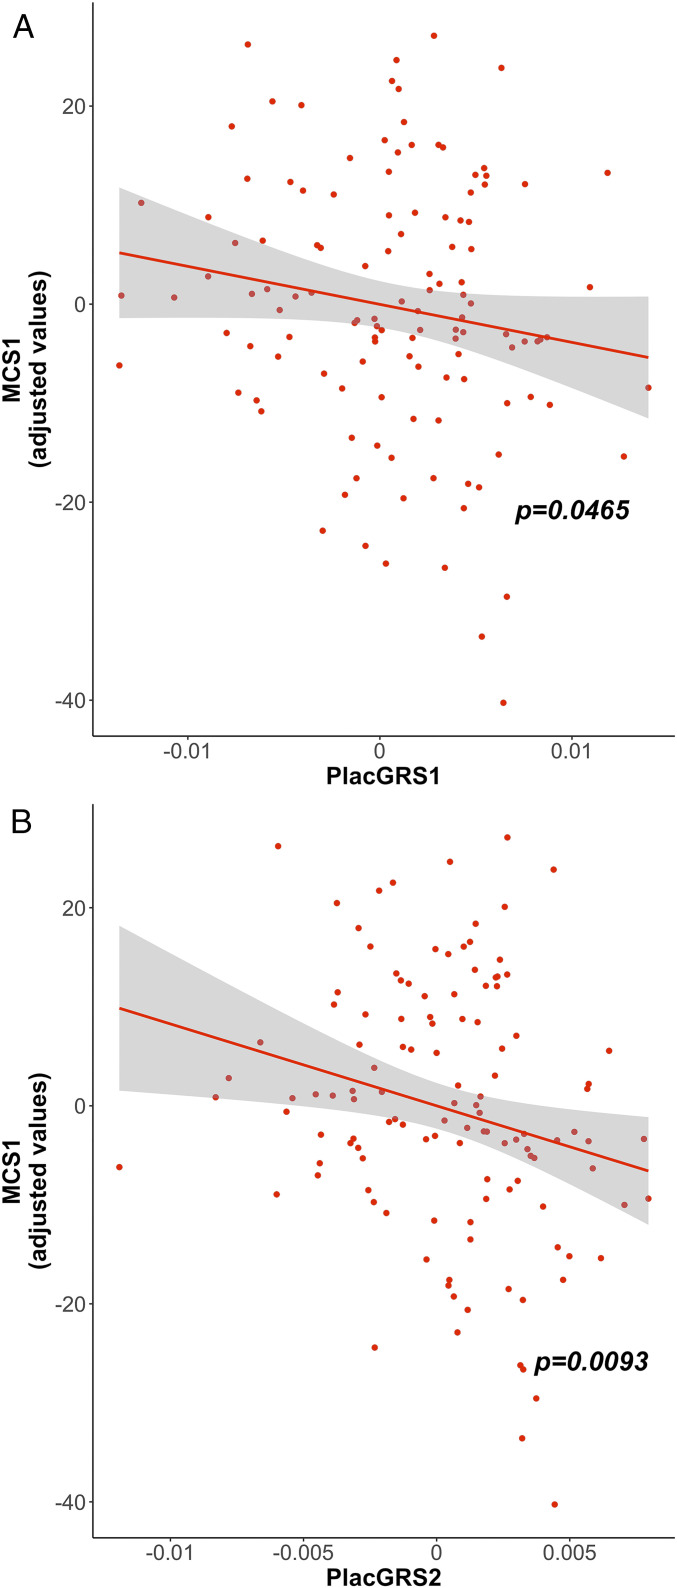
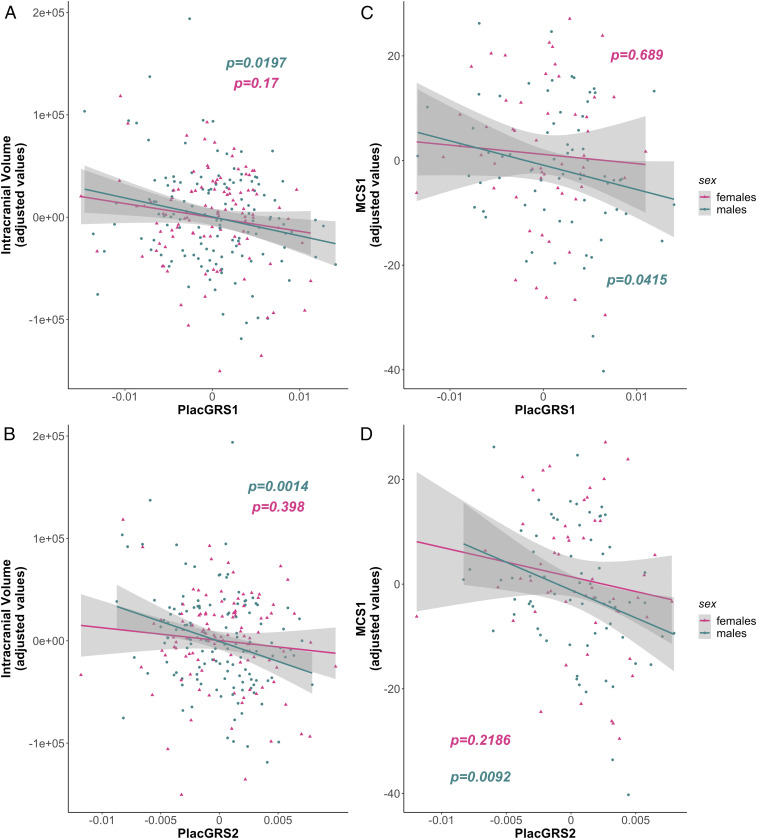
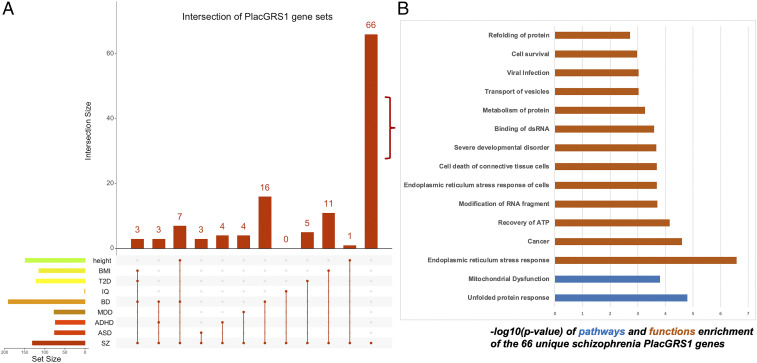
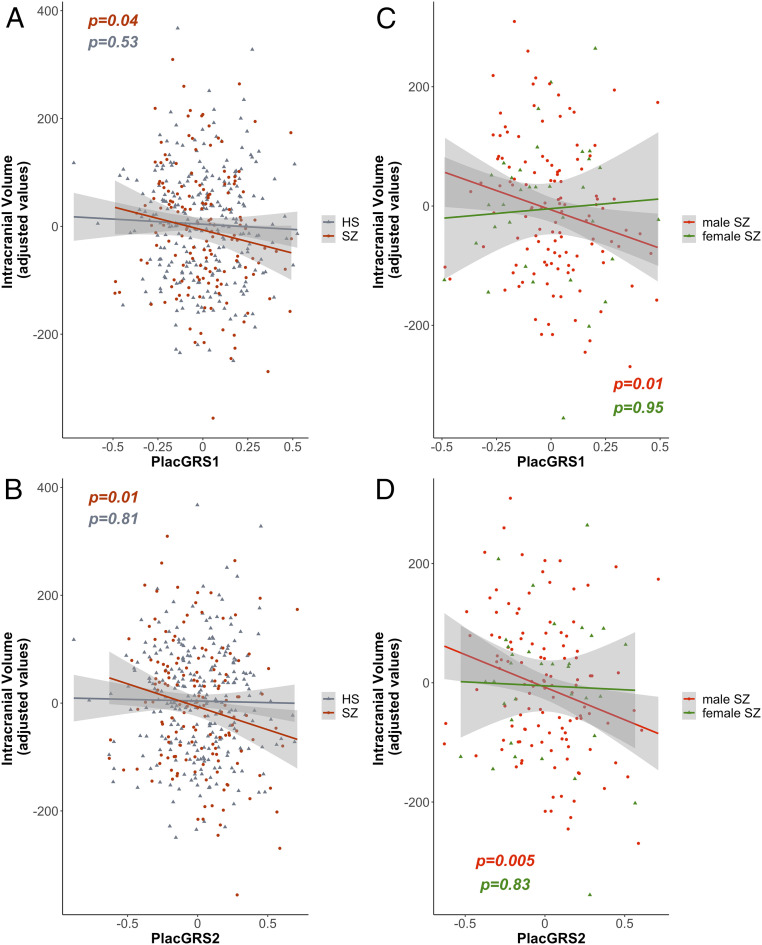
Tracing the early paths leading to developmental disorders is critical for prevention. In previous work, we detected an interaction between genomic risk scores for schizophrenia (GRSs) and early-life complications (ELCs), so that the liability of the disorder explained by genomic risk was higher in the presence of a history of ELCs, compared with its absence. This interaction was specifically driven by loci harboring genes highly expressed in placentae from normal and complicated pregnancies [G. Ursini et al., Nat. Med. 24, 792-801 (2018)]. Here, we analyze whether fractionated genomic risk scores for schizophrenia and other developmental disorders and traits, based on placental gene-expression loci (PlacGRSs), are linked with early neurodevelopmental outcomes in individuals with a history of ELCs. We found that schizophrenia's PlacGRSs are negatively associated with neonatal brain volume in singletons and offspring of multiple pregnancies and, in singletons, with cognitive development at 1 y and, less strongly, at 2 y, when cognitive scores become more sensitive to other factors. These negative associations are stronger in males, found only with GRSs fractionated by placental gene expression, and not found in PlacGRSs for other developmental disorders and traits. The relationship of PlacGRSs with brain volume persists as an anlage of placenta biology in adults with schizophrenia, again selectively in males. Higher placental genomic risk for schizophrenia, in the presence of ELCs and particularly in males, alters early brain growth and function, defining a potentially reversible neurodevelopmental path of risk that may be unique to schizophrenia.

Trial registration: ClinicalTrials.gov NCT00001486.

Keywords: developmental trajectories; genomic risk scores; neurodevelopment; placental gene expression; schizophrenia.


Conflict of interest statement

The authors declare no competing interest.

Figures

Fig. 1.
Fig. 1.
Placental genomic risk for schizophrenia and intracranial volume in neonates. Scatterplots of the relationship of neonatal ICV with placental genomic risk scores for schizophrenia, constructed from alleles showing significant association with schizophrenia, with GWAS P < 5 × 10⁻⁸ (PlacGRS1; A) and GWAS P < 1 × 10⁻⁶ (PlacGRS2; B) in loci containing genes highly expressed in placenta and differentially expressed in placentae from complicated compared with normal pregnancies. The figure shows the negative relationship between ICV and PlacGRSs in singletons (n = 147; red dots) and offspring of multiple pregnancies (n = 95; gray dots), with the P value in the whole sample.
Fig. 2.
Fig. 2.
Placental genomic risk for schizophrenia and developmental scores at 1 y. Scatterplots of the relationship of MCS1 with placental genomic risk scores for schizophrenia (PlacGRS1, A; PlacGRS2, B). The figure shows the negative relationship between PlacGRSs and MCS1 in singletons, with the corresponding P value (n = 122; red dots). See SI Appendix, Fig. S2 for results in offspring of multiple pregnancies.
Fig. 3.
Fig. 3.
Sex-related differences in the relationship between placental genomic risk for schizophrenia and early neurodevelopmental outcomes. (A and B) Scatterplots of the relationship of neonatal ICV with placental genomic risk scores for schizophrenia (PlacGRS1, A; PlacGRS2, B) in males (n = 133; turquoise dots) and females (n = 109; violet dots). (C and D) Scatterplots of the relationship of MCS1 with placental genomic risk scores for schizophrenia (PlacGRS1, C; PlacGRS2, D) in male (n = 68; turquoise dots) and female singletons (n = 54; violet dots) (P values in the male sample are in turquoise; P values in the female sample are in violet).
Fig. 4.
Fig. 4.
Overlap between placental gene sets for schizophrenia and other developmental disorders and traits. (A) UpSetR (93) plot representing the intersection/overlap of the schizophrenia placental gene sets (PlacGRS1) with placental gene sets of other disorders and traits (height, BMI, type 2 diabetes [T2D], IQ, BD, major depressive disorder [MDD], ADHD, and autism spectrum disorder [ASD]). The vertical red-orange bars (Top) represent the number of genes (numbers above the bars) at the intersections. The intersections are indicated, in the combination matrix (Bottom), by the red-orange dots and connecting lines: for example, the first bar indicates that 3 genes are common to the placental gene sets of BMI, T2D, BD, and schizophrenia (SZ), while the last bar indicates that 66 genes are unique to the placental schizophrenia gene set and are not contained in any other gene set. Only intersections with placental schizophrenia gene sets are shown, and only intersections with size greater than two genes are shown among the intersections of more than two gene sets (SI Appendix, Fig. S4 shows all the intersections with placental schizophrenia gene sets for PlacGRS1 and PlacGRS2). (B) Pathways and functions enriched for the PlacGRS1 genes (n = 66) that uniquely map to the schizophrenia-risk loci genes and are not contained in any other gene set (last bar of the UpSetR plot in A) (see also Datasets S1 and S2). Bars depict the negative logarithm of the P values of the enriched functions (orange bars) and pathways (blue bars).
Fig. 5.
Fig. 5.
Placental genomic risk for schizophrenia and intracranial volume in adult controls and patients with schizophrenia. (A and B) Scatterplots of the relationship of ICV with placental genomic risk scores for schizophrenia (PlacGRS1, A; PlacGRS2, B) in adult healthy subjects (HS; n = 269; gray dots) and in patients with schizophrenia (n = 154; dark red dots) (P values for HS are in gray; P values for SZ are in dark red). (C and D) Scatterplots of the relationship of ICV with placental genomic risk scores for schizophrenia (PlacGRS1, C; PlacGRS2, D) in male (n = 120; red dots) and female (n = 54; green dots) patients with SZ (P values for the male sample are in red; P values for the female sample are in green).

Similar articles

Cited by

References

    1. Brown A. S., Derkits E. J., Prenatal infection and schizophrenia: A review of epidemiologic and translational studies. Am. J. Psychiatry 167, 261–280 (2010). - PMC - PubMed
    1. Patterson P. H., Neuroscience. Maternal effects on schizophrenia risk. Science 318, 576–577 (2007). - PubMed
    1. Cannon M., Jones P. B., Murray R. M., Obstetric complications and schizophrenia: Historical and meta-analytic review. Am. J. Psychiatry 159, 1080–1092 (2002). - PubMed
    1. Davies C., et al. , Prenatal and perinatal risk and protective factors for psychosis: A systematic review and meta-analysis. Lancet Psychiatry 7, 399–410 (2020). - PubMed
    1. Liu C. H., Keshavan M. S., Tronick E., Seidman L. J., Perinatal risks and childhood premorbid indicators of later psychosis: Next steps for early psychosocial interventions. Schizophr. Bull. 41, 801–816 (2015). - PMC - PubMed

Publication types

Associated data