. 2021 Feb 8;12(2):160.
doi: 10.1038/s41419-021-03452-x.

Characterization of ferroptosis in kidney tubular cell death under diabetic conditions

Affiliations

Characterization of ferroptosis in kidney tubular cell death under diabetic conditions

Seonghun Kim et al. Cell Death Dis. .

Erratum in

Abstract

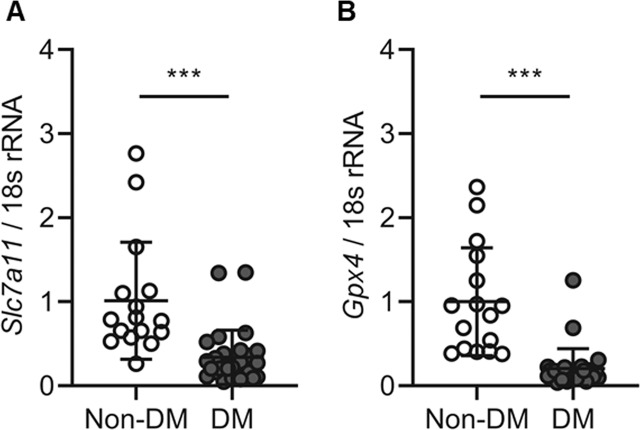
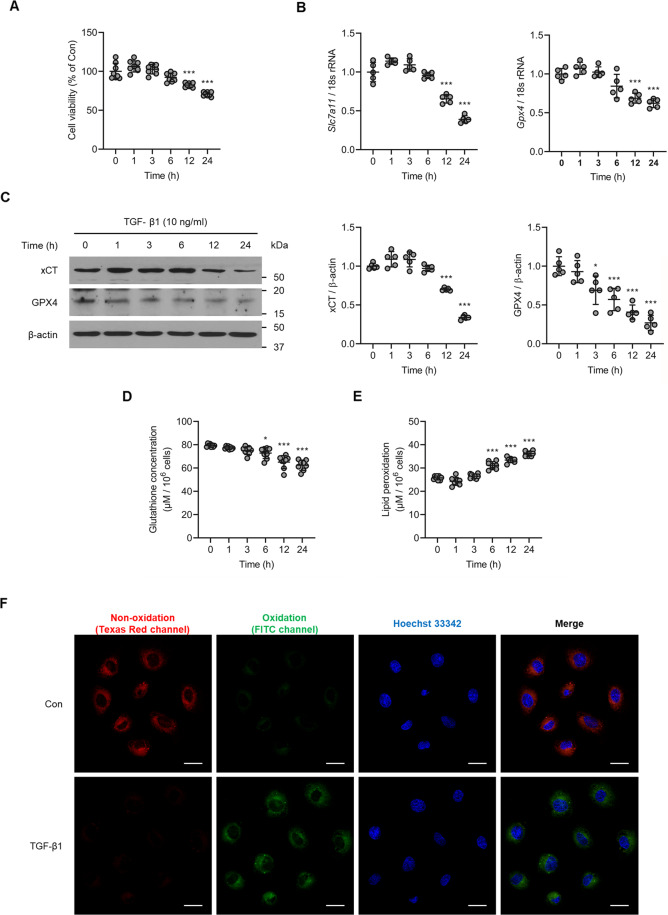
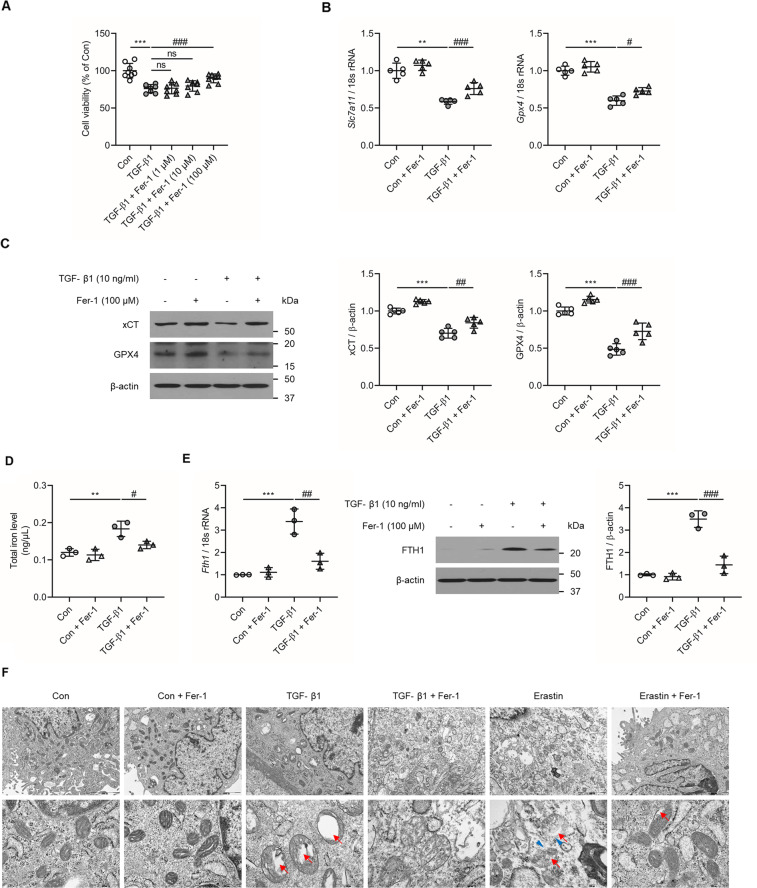
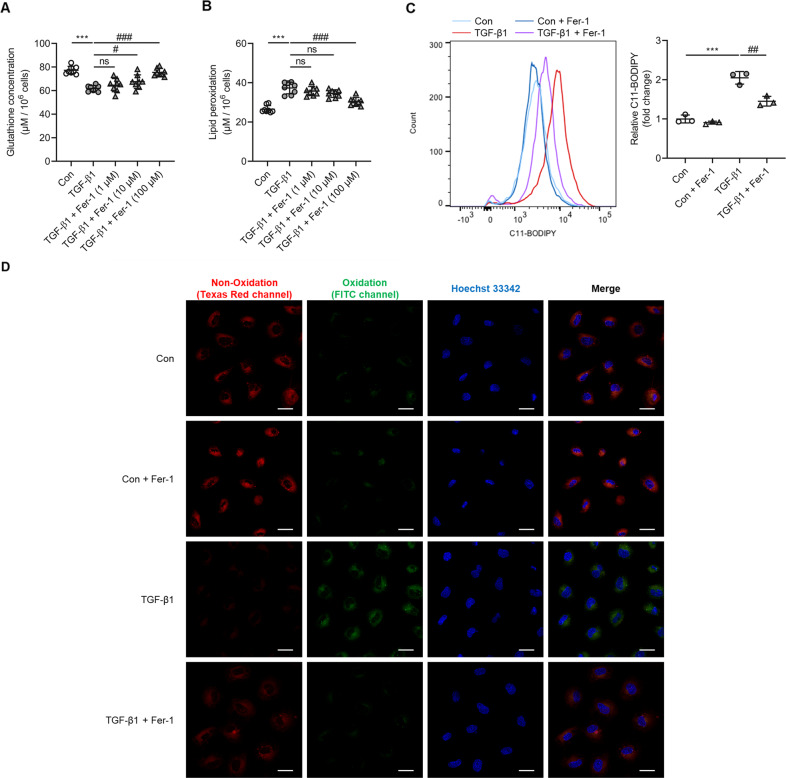
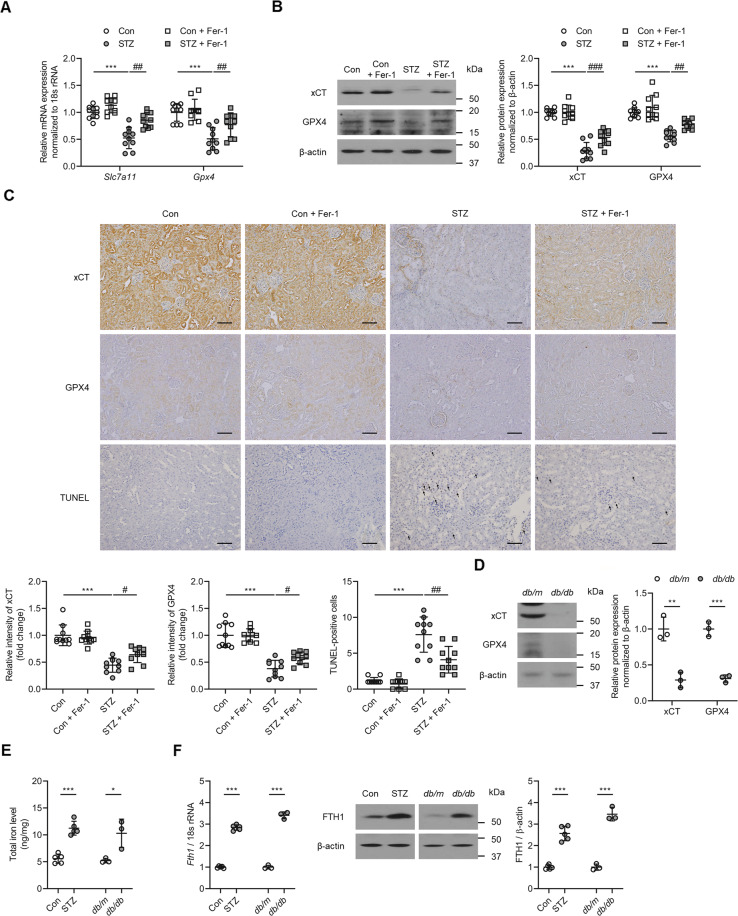
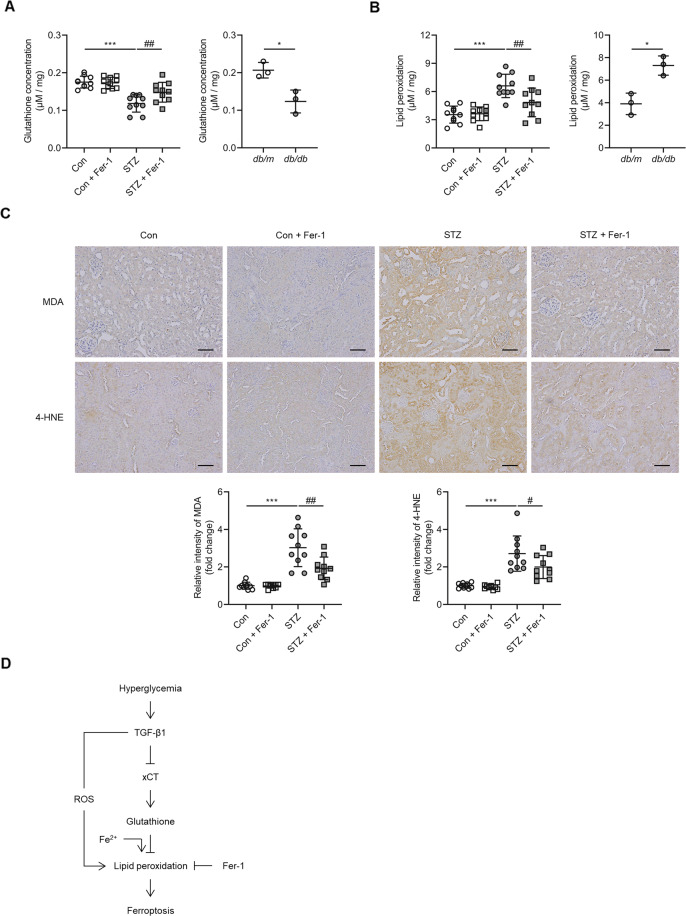
Kidney tubular cell death induced by transforming growth factor-β1 (TGF-β1) is known to contribute to diabetic nephropathy, a major complication of diabetes. Caspase-3-dependent apoptosis and caspase-1-dependent pyroptosis are also involved in tubular cell death under diabetic conditions. Recently, ferroptosis, an atypical form of iron-dependent cell death, was reported to cause kidney disease, including acute kidney injury. Ferroptosis is primed by lipid peroxide accumulation through the cystine/glutamate antiporter system Xc- (xCT) and glutathione peroxidase 4 (GPX4)-dependent mechanisms. The aim of this study was to evaluate the role of ferroptosis in diabetes-induced tubular injury. TGF-β1-stimulated proximal tubular epithelial cells and diabetic mice models were used for in vitro and in vivo experiments, respectively. xCT and GPX4 expression, cell viability, glutathione concentration, and lipid peroxidation were quantified to indicate ferroptosis. The effect of ferroptosis inhibition was also assessed. In kidney biopsy samples from diabetic patients, xCT and GPX4 mRNA expression was decreased compared to nondiabetic samples. In TGF-β1-stimulated tubular cells, intracellular glutathione concentration was reduced and lipid peroxidation was enhanced, both of which are related to ferroptosis-related cell death. Ferrostatin-1 (Fer-1), a ferroptosis inhibitor, alleviated TGF-β1-induced ferroptosis. In diabetic mice, kidney mRNA and protein expressions of xCT and GPX4 were reduced compared to control. Kidney glutathione concentration was decreased, while lipid peroxidation was increased in these mice, and these changes were alleviated by Fer-1 treatment. Ferroptosis is involved in kidney tubular cell death under diabetic conditions. Ferroptosis inhibition could be a therapeutic option for diabetic nephropathy.


Conflict of interest statement

The authors declare that they have no conflict of interest.

Figures

Fig. 1
Fig. 1. Expression of ferroptosis-related molecules Slc7a11 and Gpx4 was decreased in diabetic nephropathy of kidney biopsy tissues.
A, B Slc7a11 and Gpx4 mRNA expression was significantly decreased in the DM group compared to the non-DM group. Bonferroni t tests were used for statistical analysis. Error bars represent SD. ***P < 0.001 versus non-DM group; non-DM group, n = 17; DM group, n = 28.
Fig. 2
Fig. 2. TGF-β1 induces kidney tubular cell death along with changes in ferroptosis-related molecules.
A Cell viability measured via an MTT assay revealed a significant increase in the death of cultured NRK-52E cells exposed to TGF-β1 (10 ng/ml) in a time-dependent manner. B TGF-β1 caused a marked decrease in mRNA expression of ferroptosis-related molecules Slc7a11 and Gpx4 in NRK-52E cells. C Expression of xCT and GPX4 protein was significantly decreased in TGF-β1-stimulated NRK-52E cells compared to control cells. D Glutathione concentration was significantly decreased in cultured NRK-52E cells exposed TGF-β1 (10 ng/ml) after 6, 12, and 24 h. E TGF-β1 significantly induced lipid peroxidation in NRK-52E cells after 6, 12, and 24 h. F Lipid peroxidation assessed using image-iT® revealed an increase in TGF-β1-treated NRK-52E cells after 12 h. As shown is representative of three independent replicates. One-way ANOVA and Bonferroni post hoc tests were used for statistical analysis. Error bars represent SD. Original magnification, ×40 for all. Scale bar = 20 µm. *P < 0.05; ***P < 0.001 versus 0 h group.
Fig. 3
Fig. 3. Effect of Fer-1 treatment on cell viability and changes in ferroptosis-related molecules in TGF-β1-stimulated NRK-52E cells at 12 h.
A MTT assay revealed that administration of Fer-1 (100 µM) significantly abrogated the decrease in cell viability in cultured NRK-52E cells exposed to TGF-β1 (10 ng/ml). B The decrease in Slc7a11 and Gpx4 mRNA expression seen in TGF-β1-stimulated NRK-52E cells was significantly ameliorated after Fer-1 treatment. C The decrease in xCT and GPX4 protein expression seen in TGF-β1-stimulated NRK-52E cells was significantly attenuated after Fer-1 treatment. D The increase in total iron levels in TGF-β1-stimulated NRK-52E cells was significantly abrogated after Fer-1 treatment. E The increase in protein and mRNA expression levels of FTH1 in TGF-β1-stimulated NRK-52E cells was significantly attenuated after Fer-1 treatment. F Transmission electron microscope images of mitochondria. Red arrow indicates mitochondria cristae vanish. Blue arrowhead indicates outer mitochondria membrane rupture. As shown is representative of three independent replicates. One-way ANOVA and Bonferroni post hoc tests were used for statistical analysis. Error bars represent SD. Original magnification, ×150 for upper and ×600 for lower. Scale bar = 2000 µm (upper), 500 µm (lower). **P < 0.01; ***P < 0.001 versus Con group. #P < 0.05; ##P < 0.01; ###P < 0.001 versus TGF-β1 group.
Fig. 4
Fig. 4. Ferroptosis inhibitors attenuated glutathione concentration and lipid peroxidation in TGF-β1-stimulated NRK-52E cells after 12 h.
A The decrease in glutathione concentration seen in cultured NRK-52E cells exposed TGF-β1 (10 ng/ml) was significantly ameliorated by Fer-1 (10 and 100 µM) treatment. B Administration of Fer-1 significantly attenuated the increase in lipid peroxidation seen in TGF-β1-stimulated NRK-52E cells. C FACS evaluated BODIPY 581/591-C11 fluorescence intensity. D Lipid peroxidation assessed using Image-iT® revealed that the increase seen in cultured NRK-52E cells after exposure to TGF-β1 was significantly abrogated by Fer-1 treatment. As shown is representative of three independent replicates. One-way ANOVA and Bonferroni post hoc tests were used for statistical analysis. Error bars represent SD. Original magnification, ×40 for all. Scale bar = 20 µm. ***P < 0.001 versus Con group. #P < 0.05; ##P < 0.01; ###P < 0.001 versus TGF-β1 group.
Fig. 5
Fig. 5. Effect of Fer-1 on cell viability and changes in ferroptosis-related molecules in the kidney of diabetic mice.
A Kidney Slc7a11 and Gpx4 mRNA expression was significantly lower in STZ mice than the Con group, and changes in the STZ kidney were abrogated by Fer-1 treatment. B xCT and GPX4 protein expression assessed by western blot was significantly lower in the STZ kidney, and this was ameliorated by administration of Fer-1. C TUNEL staining showed a significant increase in cell death in the STZ kidney, which was alleviated by Fer-1 treatment. D Protein and mRNA expression of xCT and GPX4 in kidney samples of db/db mice. E Total iron levels measured in kidney samples of STZ and db/db mice. F Protein and mRNA expression level of FTH1 in kidney samples of STZ and db/db mice. One-way ANOVA and Bonferroni post hoc tests were used for statistical analysis. Error bars represent SD. Original magnification, ×20 for all. Scale bar = 100 µm. **P < 0.01; ***P < 0.001 versus Con group. #P < 0.05; ##P < 0.01; ###P < 0.001 versus STZ group. n = 10 for each group of STZ. n = 3 for each group of db/db.
Fig. 6
Fig. 6. Effect of Fer-1 on glutathione concentration and lipid peroxidation in the kidney of diabetic mice.
A Glutathione concentration in the kidneys of STZ and db/db mice. B Lipid peroxidation assessed by MDA levels in the kidneys of STZ and db/db mice. C Immunohistochemistry for MDA and 4-HNE was significantly increased in the STZ group, and this was abrogated by administration of Fer-1. D Schematic diagram of TGF-β1-induced ferroptosis in diabetic nephropathy. One-way ANOVA and Bonferroni post hoc tests were used for statistical analysis. Error bars represent SD. Original magnification, ×20 for all. Scale bar = 100 µm. *P < 0.05; ***P < 0.001 versus Con group. #P < 0.05; ##P < 0.01 versus STZ group; ROS reactive oxygen species. n = 10 for each group of STZ. n = 3 for each group of db/db.

References

    1. Brenner BM, et al. Effects of losartan on renal and cardiovascular outcomes in patients with type 2 diabetes and nephropathy. N. Engl. J. Med. 2001;345:861–869. doi: 10.1056/NEJMoa011161. - DOI - PubMed
    1. McClellan WM, et al. Albuminuria and racial disparities in the risk for ESRD. J. Am. Soc. Nephrol. 2011;22:1721–1728. doi: 10.1681/ASN.2010101085. - DOI - PMC - PubMed
    1. D D’Agati V, Fogo AB, Bruijn JA, Jennette JC. Pathologic classification of focal segmental glomerulosclerosis: a working proposal. Am. J. Kidney Dis. 2004;43:368–382. doi: 10.1053/j.ajkd.2003.10.024. - DOI - PubMed
    1. Mason RM, Wahab NA. Extracellular matrix metabolism in diabetic nephropathy. J. Am. Soc. Nephrol. 2003;14:1358–1373. doi: 10.1097/01.ASN.0000065640.77499.D7. - DOI - PubMed
    1. Morais C, Westhuyzen J, Pat B, Gobe G, Healy H. High ambient glucose is effect neutral on cell death and proliferation in human proximal tubular epithelial cells. Am. J. Physiol. Ren. Physiol. 2005;289:F401–F409. doi: 10.1152/ajprenal.00408.2004. - DOI - PubMed

Publication types

MeSH terms

Substances