. 2021 Feb 8;7(1):10.
doi: 10.1038/s41523-021-00215-x.

Ancestry-associated transcriptomic profiles of breast cancer in patients of African, Arab, and European ancestry

Affiliations

Ancestry-associated transcriptomic profiles of breast cancer in patients of African, Arab, and European ancestry

Jessica Roelands et al. NPJ Breast Cancer. .

Abstract

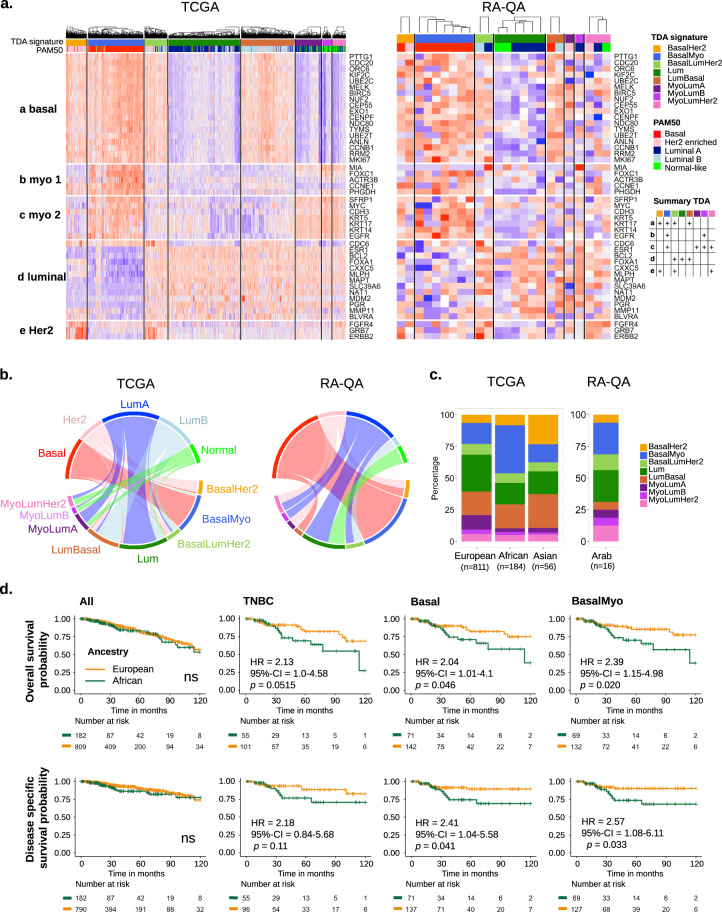
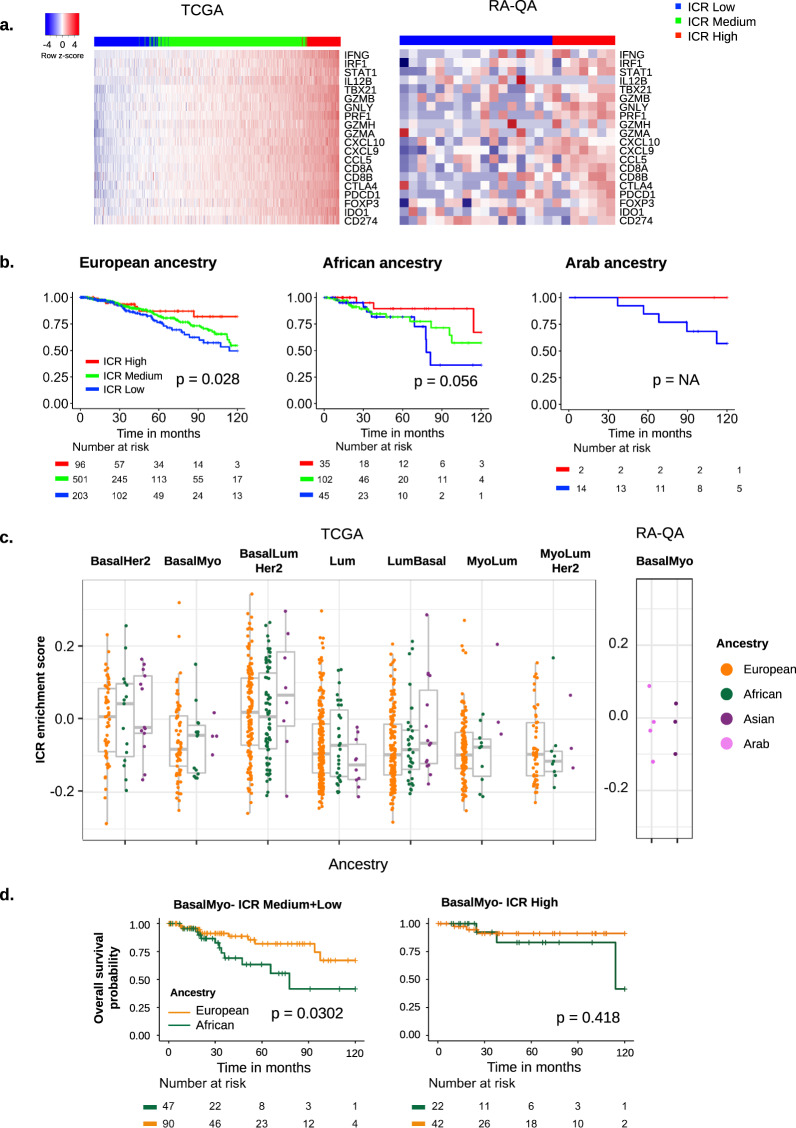
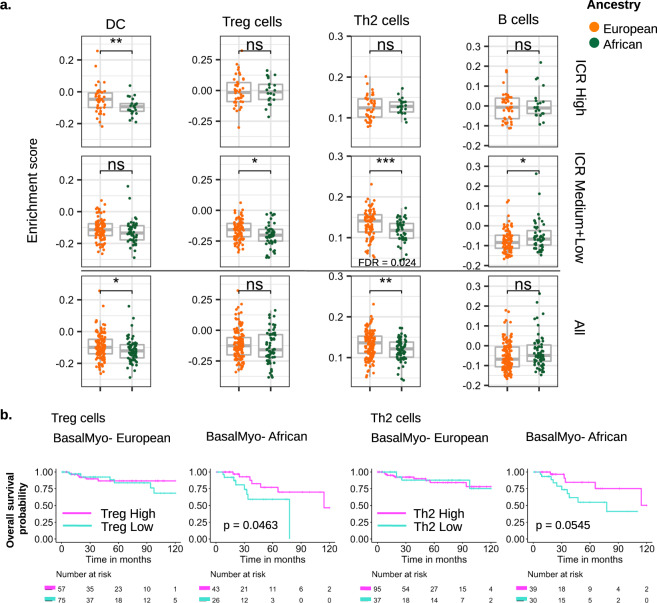
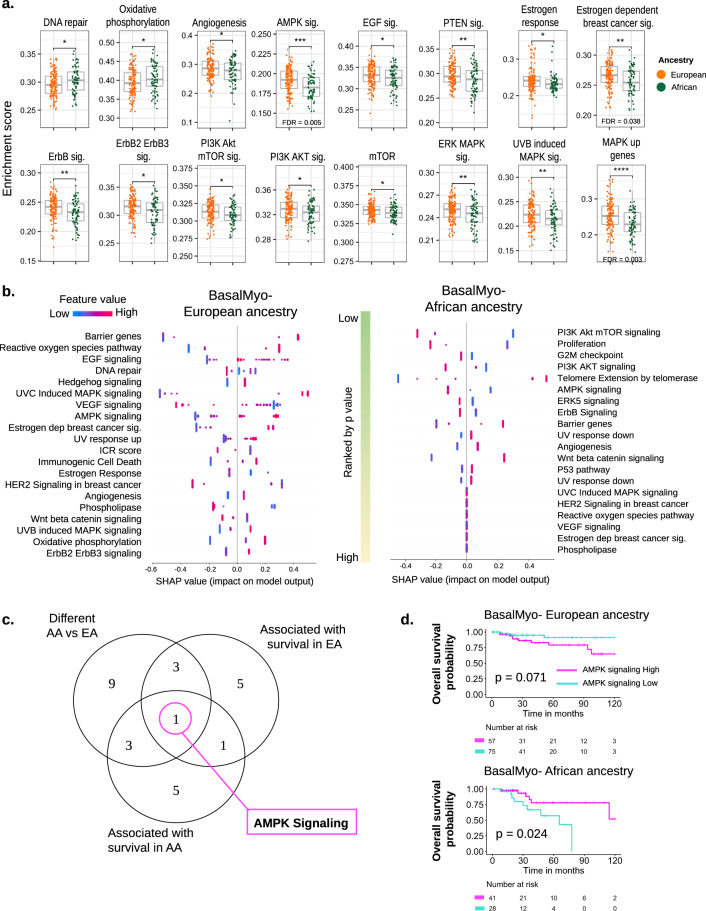
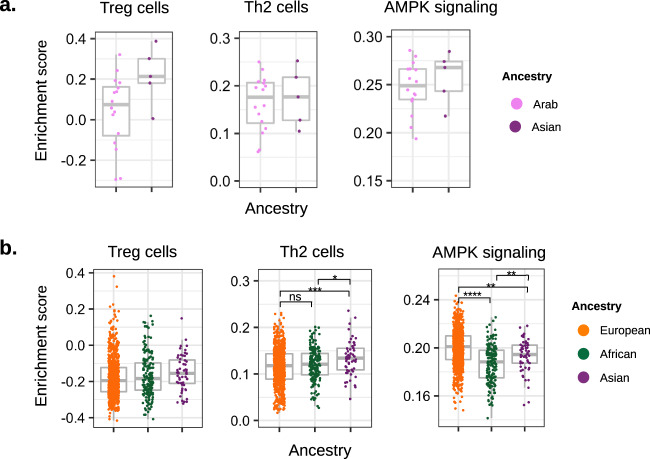
Breast cancer largely dominates the global cancer burden statistics; however, there are striking disparities in mortality rates across countries. While socioeconomic factors contribute to population-based differences in mortality, they do not fully explain disparity among women of African ancestry (AA) and Arab ancestry (ArA) compared to women of European ancestry (EA). In this study, we sought to identify molecular differences that could provide insight into the biology of ancestry-associated disparities in clinical outcomes. We applied a unique approach that combines the use of curated survival data from The Cancer Genome Atlas (TCGA) Pan-Cancer clinical data resource, improved single-nucleotide polymorphism-based inferred ancestry assignment, and a novel breast cancer subtype classification to interrogate the TCGA and a local Arab breast cancer dataset. We observed an enrichment of BasalMyo tumors in AA patients (38 vs 16.5% in EA, p = 1.30E - 10), associated with a significant worse overall (hazard ratio (HR) = 2.39, p = 0.02) and disease-specific survival (HR = 2.57, p = 0.03). Gene set enrichment analysis of BasalMyo AA and EA samples revealed differences in the abundance of T-regulatory and T-helper type 2 cells, and enrichment of cancer-related pathways with prognostic implications (AA: PI3K-Akt-mTOR and ErbB signaling; EA: EGF, estrogen-dependent and DNA repair signaling). Strikingly, AMPK signaling was associated with opposing prognostic connotation (AA: 10-year HR = 2.79, EA: 10-year HR = 0.34). Analysis of ArA patients suggests enrichment of BasalMyo tumors with a trend for differential enrichment of T-regulatory cells and AMPK signaling. Together, our findings suggest that the disparity in the clinical outcome of AA breast cancer patients is likely related to differences in cancer-related and microenvironmental features.


Conflict of interest statement

The authors declare no competing interests.

Figures

Fig. 1
Fig. 1. Distribution of breast cancer molecular subtypes defined by topological data analysis (TDA) signatures across ancestries.
a Heatmap of expression of PAM50 genes organized by TDA signature classes in TCGA breast cancer and RA-QA cohort. Samples are annotated by TDA signature class (upper annotation bar) and classical PAM50 intrinsic molecular subtype (lower annotation bar). The combination patterns of upregulated expression of five distinct gene groups defining each TDA class are summarized in a table on the right (Summary TDA). b Reclassification of breast cancer samples from classical PAM50 intrinsic molecular subtypes (upper part of circos) to TDA signature classes (lower part of circos) in TCGA and RA-QA breast cancer cohorts. c Stacked bar chart of distribution of TDA classes by ancestry. d Kaplan–Meier plots showing overall survival (upper panels) and disease-specific survival (lower panels) by ancestry. Difference between the survival of patients with European and African ancestry is shown for the complete TCGA breast cancer cohort (left), patients with TNBC according to hormone receptor status (middle left), patients with PAM50-defined basal breast cancer (middle right), and patients with tumors classified as BasalMyo by TDA classification (right). Censor points are indicated by vertical lines.
Fig. 2
Fig. 2. Tumor immune phenotypes and clinical outcome by ancestry.
a Heatmap of ICR gene expression in TCGA and RA-QA breast cancer cohorts. Classification of samples by ICR consensus clustering segregates TCGA samples in ICR low, ICR medium, and ICR high groups. Samples of RA-QA cohort were classified as ICR low or ICR high. b Kaplan–Meier plots showing overall survival across ICR groups in breast cancer TCGA patients of EA (left), TCGA patients of AA (middle), and RA-QA patients of ArA (right). c ICR enrichment scores across ancestries within TDA signature classes. Box plots indicate medians and interquartile range, and whiskers represent 10th and 90th percentile. All data points are plotted individually. d Overall survival of EA and AA patients in TCGA BasalMyo samples classified as ICR medium + low (left), and ICR high (right). Censor points are indicated by vertical lines.
Fig. 3
Fig. 3. Enrichment of immune cell subpopulations in AA and EA patients with BasalMyo breast tumors.
a. Enrichment scores of signatures reflecting the abundance of dendritic cells (DCs), T-regulatory cells (Tregs), T-helper 2 (Th2), and B cells in BasalMyo tumor samples of EA and AA patients. Box plots are facetted by ICR groups, ICR high (upper panels), ICR medium + low (middle panels), and across all samples (lower panels). Box plots indicate medians and interquartile range, and whiskers represent 10th and 90th percentile. All data points are plotted individually. T test (two-sided): *p < 0.05, **p < 0.01, ***p < 0.001, and n.s. not significant. Adjusted p value (FDR) by Benjamini and Hochberg method. b Kaplan–Meier plots of overall survival in EA and AA patients with BasalMyo breast cancer dichotomized by enrichment scores of TReg (left panels) and Th2 cell signatures (right panels). Cutoff for dichotomization in “High” and “Low” categories is based on optimal enrichment cutoff determined by XGBoost model used for survival analysis. Censor points are indicated by vertical lines.
Fig. 4
Fig. 4. Differentially enriched oncogenic pathways with prognostic connotation in EA and AA patients with BasalMyo breast tumors.
a Enrichment scores of signatures of tumor-associated pathways that are differentially regulated between EA and AA patients with BasalMyo tumors. Box plots indicate medians and interquartile range, and whiskers represent 10th and 90th percentile. All data points are plotted individually. T test (two-sided): *p < 0.05, **p < 0.01, ***p < 0.001, and ****p < 0.0001. Adjusted p value (FDR) by Benjamini and Hochberg method. b SHAP plots of tumor-associated pathways that are associated with overall survival in EA (left) and AA (right) patients with BasalMyo breast tumors. Pathways are ranked by p value to reflect the importance of each feature in the survival model. Each dot represents a single sample and is colored by relative enrichment score. Corresponding impact on model output (SHAP value) ranges from −1 (indicating the absence of an event) to +1 (indicating the occurrence of an event, in this case, death). c Intersection of differentially enriched tumor-associated pathways with ten most important pathways in AA and EA patients with BasalMyo breast tumors. AMPK signaling is differentially regulated in AA vs EA and is of importance in survival models of both AA and EA patients. d Kaplan–Meier curves visualizing the prognostic value of AMPK signaling in EA (upper) and AA (lower) BasalMyo patients. Dichotomization of samples by AMPK signaling is based on optimal enrichment score cutoff as determined by XGBoost model. Censor points are indicated by vertical lines.
Fig. 5
Fig. 5. Enrichment of selected immune cell subpopulations and oncogenic pathways in Arab breast cancer patients.
Enrichment scores for signatures for T-regulatory cells (Tregs, left), T-helper 2 cells (Th2, middle), and AMPK signaling (right) in panel (a). RA-QA cohort comparing ArA to AsA breast cancer patients, independent of molecular subtype. b TCGA breast cancer cohort comparing EA, AA and AsA breast cancer patients, independent of intrinsic molecular subtype. Box plots indicate medians and interquartile range, and whiskers represent 10th and 90th percentile. All data points are plotted individually. T test (two-sided): *p < 0.05, **p < 0.01, ***p < 0.001, ****p < 0.0001, and ns, not significant.

Similar articles

Cited by

References

    1. Spratt DE, et al. Racial/ethnic disparities in genomic sequencing. JAMA Oncol. 2016;2:1070–1074. doi: 10.1001/jamaoncol.2016.1854. - DOI - PMC - PubMed
    1. Newman LA. Breast cancer disparities: socioeconomic factors versus biology. Ann. Surg. Oncol. 2017;24:2869–2875. doi: 10.1245/s10434-017-5977-1. - DOI - PubMed
    1. Huo D, et al. Population differences in breast cancer: survey in indigenous African women reveals over-representation of triple-negative breast cancer. J. Clin. Oncol. 2009;27:4515–4521. doi: 10.1200/JCO.2008.19.6873. - DOI - PMC - PubMed
    1. Perez CA, et al. Black race as a prognostic factor in triple-negative breast cancer patients treated with breast-conserving therapy: a large, single-institution retrospective analysis. Breast Cancer Res. Treat. 2013;139:497–506. doi: 10.1007/s10549-013-2550-x. - DOI - PubMed
    1. Komenaka IK, et al. Race and ethnicity and breast cancer outcomes in an underinsured population. J. Natl. Cancer Inst. 2010;102:1178–1187. doi: 10.1093/jnci/djq215. - DOI - PubMed