. 2021 Feb 8;12(1):857.
doi: 10.1038/s41467-021-20996-w.

Droplet printing reveals the importance of micron-scale structure for bacterial ecology

Affiliations

Droplet printing reveals the importance of micron-scale structure for bacterial ecology

Ravinash Krishna Kumar et al. Nat Commun. .

Abstract

Bacteria often live in diverse communities where the spatial arrangement of strains and species is considered critical for their ecology. However, a test of this hypothesis requires manipulation at the fine scales at which spatial structure naturally occurs. Here we develop a droplet-based printing method to arrange bacterial genotypes across a sub-millimetre array. We print strains of the gut bacterium Escherichia coli that naturally compete with one another using protein toxins. Our experiments reveal that toxin-producing strains largely eliminate susceptible non-producers when genotypes are well-mixed. However, printing strains side-by-side creates an ecological refuge where susceptible strains can persist in large numbers. Moving to competitions between toxin producers reveals that spatial structure can make the difference between one strain winning and mutual destruction. Finally, we print different potential barriers between competing strains to understand how ecological refuges form, which shows that cells closest to a toxin producer mop up the toxin and protect their clonemates. Our work provides a method to generate customised bacterial communities with defined spatial distributions, and reveals that micron-scale changes in these distributions can drive major shifts in ecology.


Conflict of interest statement

The authors declare no competing interests.

Figures

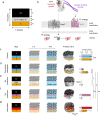
Fig. 1
Fig. 1. Droplet printing generates viable bacterial communities with defined micron-scale patterning.
a A schematic of the fabrication of printed bacterial communities by droplet printing (depicted in the x, z and x, y dimensions), transfer to LB medium and growth. b A composite (brightfield and fluorescence) stereomicroscope image of two side-by-side spotted colonies of susceptible (S) gfp and S rfp strains grown for 24 h at 37 °C from starting cell densities of 108 cells mL−1. c A photograph of a printed array (after 18 h of growth and transfer to M9 medium) with a 1-euro coin for size comparison. Images in b and c are taken at the same magnification. d A higher magnification, composite (transmitted light and fluorescence) confocal microscope image of a 7 × 8 × 1 (x, y, z droplets) printed array containing S gfp and S rfp strains segregated to opposite sides of the structure. e A confocal fluorescence microscopy image of an S rfp microcolony in the x, y planes (n = 4 biologically independent experiments). f A 3D rendering of z-stacked confocal microscopy images of the same printed community as in d (n = 4 biologically independent experiments). g Segmented fluorescence images of printed communities (7 × 8 × 1 (x, y, z droplets)) of S gfp and S rfp strains at graded degrees of genetic mixing accompanied by the corresponding printing map and the calculated segregation indices (SI) at a local neighbourhood of 100 μm (see ‘Methods'). The local neighbourhood is the spatial scale on which genetic mixing is measured. In bg, S gfp and S rfp strains are false-coloured orange and sky blue, respectively. h A plot showing the calculated SI of printed arrays (smooth lines) at different sizes of local neighbourhoods (‘spans’) (7.6–151.5 μm) compared to the SI of the printing maps (dashed lines). Data points are the mean of n = 9 printed arrays, and error bars are the standard deviation. i A bar chart showing the frequency of S gfp and S rfp strains in arrays printed at different SI values. Each data point is a biologically independent replicate and the height of the bars are the mean frequencies of the strains. The grey line shows the initial starting frequency (0.5 for both genotypes). A Kruskal–Wallis test found a non-significant difference between the median frequencies of S gfp at different SI values (P = 0.2736; see Supplementary Table 1 for statistical tests). In i, the term ‘frequency’ (f) of a genotype a in a printed array containing genotypes a and b after 18 h of competition is defined as f=Aa/(Aa+Ab), where A is the total cross-sectional area that a genotype occupies in the printed array.
Fig. 2
Fig. 2. Micron-scale structure shapes competition between susceptible and colicin-producing strains by creating ecological refuges.
a The characteristics of each colicin-producing strain used in this study. 1The ‘killing rank’ ranks the ability of each of the colicin-producing strain to kill colicin-susceptible strains, see refs. , and data therein. b, c A schematic hypothesis, of how susceptible and colicin-producer frequencies change over time, in a genetically mixed spatial structure (SI = 0.50) (b), and in a genetically segregated spatial structure (SI = 0.94) (c), if susceptible growth rates outweigh the cost of toxin production. d, Segmented fluorescence images of S cells (white) and E7 cells (yellow) in communities printed at an initial SI of 0.50 (n = 6), 0.67 (n = 3), 0.88 (n = 3) and 0.94 (n = 6) with accompanying printing maps. A Kruskal Wallis test showed a statistically significant relationship between the change in frequencies of S with SI (Kruskal–Wallis statistic: 15.63, P < 0.001, see Supplementary Table 2 for the statistical test). eg Segmented fluorescence images of S cells (white) and A cells (vermillion) (n = 3 and n = 4 for SI =  0.50 and 0.94, respectively) (e), and E2 cells (blue) (n = 4 and n = 10 for SI = 0.50 and 0.94, respectively) (f), and E8 cells (bluish-green) (n = 7 and n = 7 for SI = 0.50 and 0.94, respectively) (g), in communities printed at an initial SI = 0.50 and 0.94. h Segmented fluorescence images of E2 cells (blue) and R1 cells (reddish-purple) in communities printed at an initial SI of 0.50 (n = 9) and 0.94 (n = 6). In dh, each fluorescently segmented image was taken after 18 h of competition. Below each fluorescently segmented imaged is a stacked bar chart of the frequencies of strains in the array. Each data point represents a biologically independent replicate; the mean frequencies of each strain are where the bars meet. In eh, unpaired Mann–Whitney tests were performed to assess the statistical significance of the changes in frequencies of competing strains at different SI values. For e, P = 0.6286; for f, P = 0.0020; for g, P = 0.4462; for h, P = 0.0336 (see Supplementary Tables 3 for statistical tests). In h, one-sample t and Wilcoxon tests showed a statistically significant (P = 0.0039) and non-significant (P > 0.6250) difference between the median frequencies of E2 and R1 at SI = 0.50 and 0.94, respectively (see Supplementary Tables 3 for statistical tests).
Fig. 3
Fig. 3. Micron-scale structure shapes competition between colicin-producing strains and can drive mutual destruction.
ad Competition schematics followed by the corresponding segmented fluorescence images of E2 cells (blue) and E7 cells (yellow) (n = 4 and n = 3 for SI = 0.50 and 0.94, respectively) (a), E2 cells and A cells (vermillion) (n = 7 and n = 6 for SI = 0.50 and 0.94, respectively) (b), E2 cells and E8 cells (bluish-green) (n = 3 and n = 3 for SI = 0.50 and 0.94, respectively) (c) and E2* cells (bluish-grey) and E8 cells (n = 9 and n = 7 for SI = 0.50 and 0.94, respectively) (d) in genetically mixed (SI = 0.50) and fully segregated (SI = 0.94) printed communities after 18 h of competition. In the bacterial warfare schematics, the curly arrows represent autoinduction, the single- inhibition arrows represent lower aggression, the double-inhibition arrows represent higher aggression and the vertical arrow represents a faster growth rate. Above each segmented fluorescence image is the corresponding printing map. Below each segmented fluorescence image is a stacked bar chart of the frequencies of strains in each printed array after 18 h of competition. Each data point is a biologically independent replicate, and the mean frequencies of each strain are denoted where the bars meet. The mean frequency of E8 in E2* vs E8 at SI = 0.50 (d) is shown as the length of the bar and the data points denote the frequencies of E2*. To the right of each segmented fluorescence image is a bar chart of the productivities of strains in printed arrays. Each data point is a biologically independent replicate and the mean productivities of each strain are denoted by the heights of the bars. In ad, unpaired Mann–Whitney tests were performed to assess the statistical significance in the changes in frequencies of competing strains at different SI values. For a, P = 0.0286; for b, P > 0.9999; for c, P = 0.0286; for d, P = 0.0337 (see Supplementary Tables 4 for statistical tests). In ad, the term ‘productivity’ (p) of a genotype a in a printed array after 18 h of competition is defined as p = Aa/AS, where AS is the total cross-sectional area that a susceptible genotype occupies after 18 h of competition (at the same starting density and spatial pattern as genotype a), but without interference competition.
Fig. 4
Fig. 4. Susceptible cells protect clonemates by binding incoming toxin.
a Schematic of the printing map used for testing clonemate absorption. The producer strip (E2) consists of 7 × 4 × 1 droplets (black), the changeable strip consists of 7 × 2 × 1 droplet (grey) and the sensitive strip consists of 7 × 2 × 1 droplets (orange) in the x, y and z dimensions, respectively. b A schematic of the two resistance strategies used for creating R1 and R2. R1 is resistant to colicins because of deletion of the BtuB receptor (which normally binds colicins). R2 is resistant to colicins through constitutive expression of the cognate immunity protein, which binds and inactivates the toxin when it enters the cytosol. cg Printing maps, competition schematics, composite bright-field and fluorescence microscopy images and bar charts of printed communities comprising three bioinks. c The control printed arrays containing three S strains (n = 7). A Wilcoxon test showed that the median productivities of S-skyblue (S rfp) and S-orange (S gfp) were non-significantly different (P > 0.9999, see Supplementary Table 5 for the statistical test). d Printed arrays containing E2 cells (black) and two S strains (n = 13). A Wilcoxon test showed that the median productivities of S-skyblue and S-orange were significantly different (P = 0.0002, see Supplementary Table 6 for the statistical test). e Printed arrays containing E2 cells, a strip of agarose not containing bacteria and S cells (n = 4). Mann–Whitney tests showed the median productivities of S-orange in e and d, and e and f were significantly (P = 0.0029) and non-significantly (P = 0.1143) different, respectively (see Supplementary Tables 7 for the statistical test). f Printed arrays containing E2 cells, R1 cells (reddish-purple) and S cells (n = 4). A Mann–Whitney test showed that the median productivities of S-orange in d and f were significantly different (P = 0.008, see Supplementary Table 8). g Printed arrays containing E2 cells, R2 cells (red) and S cells (n = 12). A Mann–Whitney test showed that the median productivities of S-orange in d and g were non-significantly different (P = 0.604, see Supplementary Table 9). In dg, arrows on schematics represent the predicted colicin reach during the competition experiments (not to scale). In the bar charts, each data point is a biologically independent replicate and the height of the bars are mean productivity values. In cg, the term ‘productivity’ (p) of a genotype a in a printed array after 18 h of competition is defined as p = Aa/AS, where AS is the total cross-sectional area that a susceptible genotype occupies after 18 h of competition (at the same starting density and spatial pattern as genotype a), but without interference competition.

Similar articles

Cited by

References

    1. West SA, Diggle SP, Buckling A, Gardner A, Griffin AS. The social lives of microbes. Annu. Rev. Ecol. Evol. Syst. 2007;38:53–77. doi: 10.1146/annurev.ecolsys.38.091206.095740. - DOI
    1. Little AEF, Robinson CJ, Peterson SB, Raffa KF, Handelsman J. Rules of engagement: interspecies interactions that regulate microbial communities. Annu. Rev. Microbiol. 2008;62:375–401. doi: 10.1146/annurev.micro.030608.101423. - DOI - PubMed
    1. Waters CM, Bassler BL. Quorum sensing: cell-to-cell communication in bacteria. Annu. Rev. Cell Dev. Biol. 2005;21:319–346. doi: 10.1146/annurev.cellbio.21.012704.131001. - DOI - PubMed
    1. Hibbing ME, Fuqua C, Parsek MR, Peterson SB. Bacterial competition: surviving and thriving in the microbial jungle. Nat. Rev. Microbiol. 2009;8:15–25. doi: 10.1038/nrmicro2259. - DOI - PMC - PubMed
    1. Nadell CD, Drescher K, Foster KR. Spatial structure, cooperation and competition in biofilms. Nat. Rev. Microbiol. 2016;14:589–600. doi: 10.1038/nrmicro.2016.84. - DOI - PubMed

Publication types