. 2021 Feb 8;12(1):872.
doi: 10.1038/s41467-021-21089-4.

Sequence-encoded and composition-dependent protein-RNA interactions control multiphasic condensate morphologies

Affiliations

Sequence-encoded and composition-dependent protein-RNA interactions control multiphasic condensate morphologies

Taranpreet Kaur et al. Nat Commun. .

Abstract

Multivalent protein-protein and protein-RNA interactions are the drivers of biological phase separation. Biomolecular condensates typically contain a dense network of multiple proteins and RNAs, and their competing molecular interactions play key roles in regulating the condensate composition and structure. Employing a ternary system comprising of a prion-like polypeptide (PLP), arginine-rich polypeptide (RRP), and RNA, we show that competition between the PLP and RNA for a single shared partner, the RRP, leads to RNA-induced demixing of PLP-RRP condensates into stable coexisting phases-homotypic PLP condensates and heterotypic RRP-RNA condensates. The morphology of these biphasic condensates (non-engulfing/ partial engulfing/ complete engulfing) is determined by the RNA-to-RRP stoichiometry and the hierarchy of intermolecular interactions, providing a glimpse of the broad range of multiphasic patterns that are accessible to these condensates. Our findings provide a minimal set of physical rules that govern the composition and spatial organization of multicomponent and multiphasic biomolecular condensates.


Conflict of interest statement

The authors declare no competing interests.

Figures
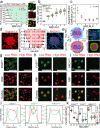
Fig. 1
Fig. 1. Mixture composition controls the structure and dynamics of binary condensates.
a Left: State diagram of PLP-RRP mixtures with RRP-to-PLP mixing ratio (mole: mole). Shaded green region: co-phase-separation regime for PLP-RRP (PLP homotypic saturation concentration: Csat = 240 µM, RRP=[RGRGG]5). Shaded regions are drawn as a guide to the eye. Right: Representative fluorescence images of PLP-RRP condensates. Scale bars, 20 µm. b PLP partition (n = 60 droplets per sample), and c PLP diffusion rate (n = 3 droplets per sample) in PLP-RRP condensates at variable RRP-to-PLP mixing ratios (mole/mole). The error bars are defined as the range of the data (1–99%) while the red line represents the mean value. d Center: State diagram of RRP-RNA mixtures with RNA-to-RRP mixing ratio (wt/wt). The shaded region shows the phase-separation regime and is drawn as a guide to the eye. Equilibrium MD configurations of condensates at CRNA=0.5×CRRP (left), and CRNA=1.7×CRRP (right). RRP: red; RNA: blue. CRRP = 1.3 mg/ml. e A schematic diagram showing that RRP decorates the RRP-RNA condensates’ surface at CRRP>CRNA while RNA surface enrichment occurs at CRNA>CRRP, leading to differential surface recruitment of PLP clients (green) in the two types of condensates. f Equilibrium MD configurations of RRP-RNA condensates with PLP clients (green) at low-RNA and high-RNA (CRNA=0.5×CRRP and CRNA=1.7×CRRP, respectively). RRP: red; RNA: blue. CRRP = 1.3 mg/ml, CPLP = 0.4 mg/ml. gi Fluorescence microscopy images showing the recruitment behavior of EWSPLP, FUSPLP, and BRG1LCD into RRP-RNA droplets at variable RNA-to-RRP ratios. Scale bars represent 10 µm. j Intensity profiles across RRP-RNA condensates at low-RNA concentration (yellow lines in gi) showing the surface recruitment of EWSPLP, FUSPLP, BRG1LCD (green: client, red: RRP). k Client partition coefficient in RRP-RNA condensates at variable RNA-to-RRP mixing ratios for FUSPLP (n = 50 droplets), EWSPLP (n = 100 droplets), and BRG1LCD (n = 75 droplets). A two-tailed t-test with no adjustments was used for statistical analysis (****p-value < 0.0001, ***0.0001 < p-value < 0.001 and no star: p-value > 0.05). See source data file for source data (bc, k) and p-values. For gk, samples were prepared at [FUSRGG3] = 1 mg/ml and at a poly(rU)-to-FUSRGG3 weight ratio of 0.2 (low RNA) and 2.5 (high RNA) or as indicated. For d and f, RRP = FUSRGG3; RNA = poly(rU). For ac, f, PLP = FUSPLP. Buffer: 25 mM Tris-HCl (pH = 7.5), 150 mM NaCl, 20 mM DTT.
Fig. 2
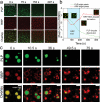
Fig. 2. RNA induces condensate switching from PLP-RRP to RRP-RNA.
a Multicolor confocal fluorescence time-lapse images showing dissolution of PLP-RRP (RRP: FUSRGG3) droplets and subsequent formation of RRP-RNA droplets upon addition of poly(rU) RNA. Scale bar = 20 µm. b A plot of the total area covered by condensates in the green (PLP) and red (RRP) channels for the data shown in (a) and in Movie S1. The areas were calculated by counting the green pixels (for PLP) and the red pixels (for RRP) and plotted as a function of time. The images indicate the various stages of sample evolution after RNA addition. The white region (left) indicates the time-window where PLP and RRP co-localize; the cyan shaded region indicates the time-window when RRP is leaving the PLP-RRP condensates; the white region (right) indicates the subsequent dissolution of PLP-RRP condensates and the formation of RRP-RNA condensates. Source data are provided as a Source Data file. Scale bar represents 5 µm. c Same assay as (a) but with poly(rA) RNA. (RRP: [RGRGG]5). Scale bars represent 4 µm. All samples were prepared in 25 mM Tris-HCl, 150 mM NaCl, and 20 mM DTT buffer. PLP: FUSPLP.
Fig. 3
Fig. 3. RNA causes the demixing of RRP and PLP.
a Fluorescence time-lapse images showing the sequestration of RRP (FUSRGG3) from PLP-RRP droplets and the formation of RRP-RNA droplets upon addition of poly(rU) RNA. [PLP] = 250 µM; [FUSRGG3] = 750 µM or 2.6 mg/ml; and poly(rU) RNA is added to a final concentration of 13 mg/ml. b PLP and RRP intensities as a function of time within a PLP-RRP condensate [red circle in (a)]. c Fluorescence images of coexisting PLP droplets and RRP-RNA droplets 20 min after RNA addition. [PLP] = 250 µM; [FUSRGG3] = 1250 µM (4.3 mg/ml); and poly(rU) RNA is added to a final concentration of 10.8 mg/ml. d A schematic diagram summarizing the effect of RNA on PLP-RRP condensates. e Fluorescence microscopy images of coexisting PLP condensates (green) and RRP-RNA condensates (red), prepared using rU40 RNA. Each type of droplet was prepared independently at initial concentrations of [PLP] = 400 µM, [FUSRGG3] = 4.0 mg/ml and [rU40] = 4.0 mg/ml and then mixed (1:1 vol/vol). f Fluorescence images of the coexisting PLP condensates (green) and RRP-RNA condensates (red) prepared using poly(rA) RNA. g A schematic showing that RNA-induced de-mixing of PLP-RRP condensate (yellow) into PLP (green) and RRP-RNA (red) condensates can sort diverse clients into different condensates. h Fluorescence micrographs and intensity profiles showing recruitment of a FAM-labeled short ssRNA and Alexa488-labeled Pol II CTD into PLP-RRP condensates in the absence of RNA (top). These RNA and polypeptide molecules are differentially sorted when poly(rU) RNA is added to the mixture (bottom)−FAM-RNA (blue) into RRP-RNA condensates and Pol II CTD (red) into PLP condensates. PLP condensates (PLP = 400 µM) were mixed (1:1 by volume) with a sample containing 4.0 mg/ml [RGRGG]5 and 0.0 mg/ml (top) or 8.0 mg/ml (bottom) of poly(rU) RNA. i, j Fluorescence time-lapse images and intensity profiles (across the yellow dashed line) for coexisting PLP droplets and RRP-RNA ([RGRGG]5-rU40) droplets in the absence (i) and presence of RNase-A (j). Both samples were prepared at [PLP] = 400 μM, [RGRGG]5 = 1 mg/ml and [rU40] = 1 mg/ml. For the sample in (j), RNase-A concentration was 1.6 mg/ml. Buffer contains 25 mM Tris-HCl (pH = 7.5), 150 mM NaCl, and 20 mM DTT. PLP = FUSPLP. Scale bar = 10 µm for (a, c) and 5 µm for (ej).
Fig. 4
Fig. 4. RNA-to-RRP ratio tunes the morphology of coexisting condensates.
a A schematic diagram showing that the relative ranking of interfacial tensions dictates the morphology of the biphasic condensates (A-droplet, B + C-droplet, D-dispersed phase). b Fluorescence microscopy images and intensity profiles for coexisting homotypic PLP droplets (green) and heterotypic RRP-RNA condensates (red) at different RNA-to-RRP ratios. Each type of droplet was separately prepared at initial concentrations of [PLP]=400 µM, [RGRGG]5=4.0 mg/ml and variable poly(rU) RNA-to-RRP ratios (wt/wt), as indicated and then mixed (1:1 vol/vol). All samples were prepared in 25 mM Tris-HCl, 150 mM NaCl, and 20 mM DTT buffer. All Scale bars represent 5 µm. c Contact angle plot (bottom) for coexisting PLP (θPLP in green) and RRP-RNA (θRRP in red) condensates for all the samples shown in (b) (n = 25 droplets per sample). The dashed line represents the average value of θRRP across all samples. Data are presented as mean values ±1 s.d. (top) A schematic showing the coexisting condensates’ morphology at low and high θPLP. Color gradient (blue) represents the increasing RNA concentration. Source data are provided as a Source Data file. d Coexistence patterns of a model doublet-of-droplet as a function of interfacial tensions calculated using a fluid interfacial modeling tool (Surface Evolver). e Proposed mechanism of RNA-mediated fluid-fluid interface regulation. At low RNA concentration, RNA-RRP condensates (red) are enriched with RRP chains on their surfaces, thus facilitating RRP-PLP interfacial binding and mediating a wetting behavior. At high RNA concentration, RRP-RNA condensate surfaces (blue) are enriched with RNA chains, limiting the available RRP molecules for PLP binding, which is responsible for minimal wetting behavior with PLP condensates (green). f Equilibrium MD snapshots at variable RNA-to-RRP mixing ratios (see Fig. S22b for the corresponding density profiles). (RRP = FUSRGG3, red; RNA = poly(rU), blue; PLP=FUSPLP, green). CRRP = 5.6 mg/ml, RNA-to-RRP ratio = 0.3, 1.8, 3.2 (respectively for the three snapshots shown), CPLP = 7.22 mg/ml.
Fig. 5
Fig. 5. Intermolecular interactions between RNA and protein components tune the morphology of coexisting condensates.
a State diagram of PLP-KRP mixtures as a function of KRP-to-PLP ratio (mole: mole), showing that KRP, [KGKGG]5, does not affect PLP phase-separation (compare with Fig. 1a for RRP-PLP mixtures). b PLP partition coefficient (n = 60 droplets per sample) and diffusion rate (n = 3 droplets per sample) in PLP-KRP condensates as a function of KRP-to-PLP mixing ratio (mole: mole). The error bars represent the range of data (1–99%) for the bottom panel while the red line represents the mean value. Source data are provided as a Source Data file. c Fluorescence images showing that the morphology of coexisting PLP homotypic condensates and KRP-RNA condensates is non-engulfing and does not vary with RNA-to-KRP stoichiometry. Each type of droplet was separately prepared at initial concentrations of [FUSPLP] = 400 µM, [KGKGG]5 = 4 mg/ml, and variable poly(rU) RNA-to-KRP ratios (wt/wt), as indicated, and mixed (1:1 vol/vol). d A schematic diagram showing that due to insignificant KRP-PLP interfacial interactions, the PLP homotypic and KRP-RNA heterotypic condensates do not share any interface (non-engulfment) at both low and high RNA. e Domain architecture of FUSFL showing both PLP and RBD modules. f Fluorescence microscopy images and intensity profiles for coexisting homotypic FUSFL droplets (red) and heterotypic RRP-RNA condensates at different RNA-to-RRP ratio. Each type of droplet was separately prepared at initial concentrations of [FUSFL] = 21.3 µM, [FUSRGG3] = 1 mg/ml and variable poly(rU) RNA-to-RRP ratios (wt/wt), as indicated, and mixed (1:1 vol/vol). g Fluorescence micrographs and intensity profiles for Janus droplets formed by coexisting homotypic FUSFL droplets (red) and heterotypic KRP-RNA condensates (green). Each type of droplet was separately prepared at initial concentrations of [FUSFL] = 22 µM, [KGKGG5] = 4 mg/ml and poly(rU) = 3 mg/ml and mixed (1:1 vol/vol). All samples were made in a buffer containing 25 mM Tris-HCl, 150 mM NaCl, and 20 mM DTT. Scale bars represent 10 µm for (c, g) and 2 µm for (f).
Fig. 6
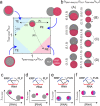
Fig. 6. The stability diagram of a pair of coexisting condensates provides a link between intermolecular interactions and multiphasic morphology.
a Stability diagram for PLP droplets coexistence pattern with RRP-RNA droplets from fluid-interface modeling simulations. In these simulations, γPLP was fixed and γRRP+RNA and γ[RRP+RNA]PLP were varied. The shaded regions mark the different morphological states: total engulfment (TE), partial engulfment (PE), and non-engulfment (NE). The solid black arrow indicates a continuous morphological transition with RNA dosage as described in the text. The dashed lines correspond to discrete transitions due to sequence variations. b Simulation strips showing the continuous and discrete morphological transitions as the values of the interfacial tensions are varied along with the corresponding arrows in the stability diagram in (a). cf Schematic diagrams showing the interactions between the ternary components as well as the observed morphology as a function of RNA concentration. The schematic plots show how the interactions between the two types of droplets (χ) are expected to change as a function of RNA dosage. The solid lines in the schematic interaction diagrams indicate strong interactions while the dashed lines indicate weak and/or absent interactions.

Similar articles

Cited by

References

    1. Banani SF, Lee HO, Hyman AA, Rosen MK. Biomolecular condensates: organizers of cellular biochemistry. Nat. Rev. Mol. Cell Biol. 2017;18:285–298. doi: 10.1038/nrm.2017.7. - DOI - PMC - PubMed
    1. Shin, Y. & Brangwynne, C. P. Liquid phase condensation in cell physiology and disease. Science10.1126/science.aaf4382 (2017). - PubMed
    1. Alberti S. Phase separation in biology. Curr. Biol. 2017;27:R1097–R1102. doi: 10.1016/j.cub.2017.08.069. - DOI - PubMed
    1. Forman-Kay JD, Kriwacki RW, Seydoux G. Phase separation in biology and disease. J. Mol. Biol. 2018;430:4603. doi: 10.1016/j.jmb.2018.09.006. - DOI - PMC - PubMed
    1. Hyman AA, Weber CA, Jülicher F. Liquid-liquid phase separation in biology. Annu. Rev. Cell Dev. Biol. 2014;30:39–58. doi: 10.1146/annurev-cellbio-100913-013325. - DOI - PubMed

Publication types